Dynamic Structural Analysis Of An FSAE Chassis For Rider Comfort
- Suresh Kumar R , BMS College of Engineering, Bengaluru, India
- Anantha Padmanabham K.C , BNM Institute of Technology, Bengaluru, India,
- Satvik S P , BMS College of Engineering, Bengaluru, India
- Sashank V V N , BMS College of Engineering, Bengaluru, India
Article Information:
Abstract:
Background: Formula competitions poses challenge to design, build, and race formula-style cars, emphasizing innovation, performance, and cost- effectiveness. The chassis, serving as the primary structural component, must withstand dynamic loads from acceleration, braking, cornering, and impacts while ensuring driver safety and optimal vehicle performance. The present work focuses on the dynamic structural analysis of a Formula Society of Automotive Engineers (FSAE) chassis using Finite Element Analysis (FEA) to evaluate its performance under various loading conditions. The chassis was modeled using Solid Works and analyzed in ANSYS for torsional rigidity, front impact resistance, and side impact protection. Key parameters including stress distribution, deformation patterns, and stiffness characteristics were evaluated. Results: from the torsional test revealed a maximum deformation of 13.812 mm with adequate torsional stiffness for handling requirements. Front impact analysis demonstrated effective energy absorption with controlled deformation, while side impact tests showed maximum deformation of 41.487 mm, confirming compliance with safety standards. The analysis identified critical stress regions, leading to design optimization for weight reduction without compromising structural integrity.
Keywords:
Article :
INTRODUCTION:
The chassis, often referred to as the vehicle's backbone, plays a critical role in determining the overall performance, safety, and handling characteristics of the race car. It serves as the primary structural framework that supports all major components including the suspension system, powertrain, steering mechanism, driver safety structures, and aerodynamic elements. Given the extreme operating conditions encountered during competition – including high-speed cornering, aggressive acceleration and braking, and potential impacts – the chassis must exhibit exceptional strength, stiffness, and energy absorption capabilities. Dynamic structural analysis using Finite Element Methods (FEM) has become an essential tool in modern chassis design, allowing engineers to predict structural behavior under various loading conditions before physical prototyping. This computational approach enables iterative design refinement, identification of stress concentrations, and optimization of material usage.
Patil and Chikkali (2020) [1] conducted FEA analysis of an FSAE chassis using ANSYS software, focusing on static structural analysis under various loading conditions. Their study emphasized the importance of torsional stiffness in chassis design and proposed optimization techniques using different cross-sectional geometries for frame members. They achieved a 15% weight reduction while maintaining structural integrity through strategic material redistribution. Mohamad et al. (2017) [2] performed static structural analysis of a race car chassis specifically designed for FSAE competitions. Their research highlighted the critical role of suspension mounting points in stress distribution and proposed reinforcement strategies for high-stress regions. They validated their computational results with experimental strain gauge measurements, showing good correlation between predicted and actual stress values. Anil et al. (2025) [3] provided a comprehensive review of material selection, design methodologies, and analysis techniques for FSAE chassis across different engineering applications. Their work compared various materials including AISI 4130 chromoly steel, 6061 aluminum alloy, and carbon fiber composites, discussing trade-offs between weight, cost, stiffness, and manufacturability. They identified chromoly steel as the most balanced choice for competition vehicles considering all factors. Chavan et al. (2020) [4] reviewed both static and dynamic analysis approaches for FSAE chassis, emphasizing the limitations of static analysis in capturing real-world dynamic behavior. They advocated for transient dynamic analysis to better simulate actual racing conditions and proposed methodology for incorporating road profile inputs in chassis simulations. Riley and George (2002) [5] from Cornell University presented one of the earliest comprehensive studies on FSAE chassis design, analysis, and testing. Their work established fundamental principles for chassis design that continue to influence current practices, including space frame geometry optimization and joint design considerations.
From the above, it is evident that limited studies have been performed focusing specifically on the Indian FSAE competition context, insufficient exploration of combined loading scenarios where multiple dynamic loads act simultaneously on the chassis and inadequate investigation of chassis behavior under repeated loading cycles simulating endurance race conditions. This work focusses on dynamic analysis under competition-specific loading conditions while considering practical manufacturing constraints.
CHASSIS DESIGN:
The design of the chassis began with a set of fundamental considerations that shaped its development. Foremost among these was regulatory compliance, with strict adherence to Supra SAE (Society of Automotive Engineers) India Rulebook Section 3 (Chassis and Frame) [6] requirements. These included specifications for minimum tube dimensions, roll hoop design, and the integration of an impact attenuator. Alongside compliance, the structural configuration was carefully evaluated. A space frame architecture was chosen over a monocoque design, primarily because it offered greater manufacturability within the constraints and aligned with rulebook allowances [7]. Material selection played a crucial role in balancing performance and practicality [10]. Various options were assessed based on strength-to-weight ratio, cost, weldability, and availability, ensuring that the chosen material met both engineering and logistical needs. Driver safety was another central priority, leading to the incorporation of side impact structures, a front impact attenuator, reinforced roll hoops, and secure mounting points for the driver harness. Suspension integration was also addressed with precision, as the placement of suspension pickup points was critical to achieving the desired kinematic characteristics and efficient load transfer paths. Finally, manufacturing feasibility guided the overall design, with simplifications introduced to ensure compatibility with available workshop facilities such as tube bending, notching, and welding equipment [11].
The chassis geometry evolved through multiple iterations, reflecting both conceptual exploration and optimization. The initial concept, designated BZR 3 (2024 Design), featured a traditional space frame with front and rear bulkheads shown in Fig. 1. It included a main roll hoop and a front roll hoop to protect the driver, symmetrical side impact structures, and a conventional triangulation pattern to provide structural rigidity.
Building on this foundation, the optimized BZR 4 (2025 Design) introduced several refinements. Torsional stiffness was significantly enhanced through improved triangulation, while the front bulkhead was redesigned to achieve better load distribution. Stress analysis informed the optimization of tube diameters, ensuring strength without unnecessary weight. Strategic material removal further contributed to weight reduction, and the cockpit was reconfigured to improve driver ergonomics and accessibility. Together, these changes resulted in a chassis that was lighter, stiffer, and safer, while also being more practical for manufacturing and operation. Fig. 2 shows the 2025 BZR 4 Chassis Design.
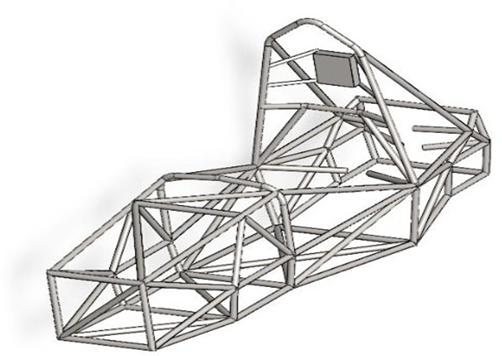
Figure 1: 2024 BZR 3 Chassis Design'
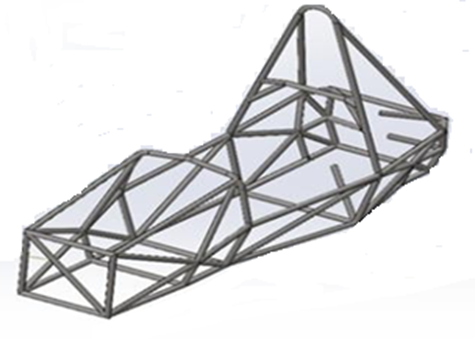
Figure 2: 2025 BZR 4 Chassis Design
The BZR 4 design introduced several significant improvements that enhanced both performance and practicality. Most notably, the chassis achieved a 12% increase in torsional stiffness, providing greater structural rigidity and improved handling characteristics. At the same time, overall weight was reduced by 8%, contributing to better acceleration, efficiency, and maneuverability. Stress distribution across the frame members was also optimized, ensuring that loads were carried more evenly and reducing the likelihood of localized failures. In addition, the design incorporated simplified joints, which not only improved manufacturability but also made fabrication more reliable and cost-effective. Together, these advancements resulted in a chassis that was lighter, stronger, and easier to produce, while maintaining high levels of safety and performance.
MATERIAL SELECTION:
After evaluating multiple material options, AISI 4130 chromoly steel was selected for the chassis construction the properties of which are as in Table 1
Table 1: Properties of AISI 4130 chromoly steel
|
Density |
7.85 gm/mm3 |
|
Tensile strength, ultimate |
560 MPa |
|
Tensile strength, yield |
460 MPa |
|
Modulus of elasticity |
190-210 GPa |
|
Shear modulus |
80 GPa |
|
Poissons ratio |
0.27-0.30 |
|
Elongation at break (in 50 mm) |
21.50% |
|
Reduction of area |
59.6 |
|
Hardness, Brinell |
217 |
|
Strength to weight ratio |
0.059 |
4. METHODOLOGY
4.1 Mesh Generation
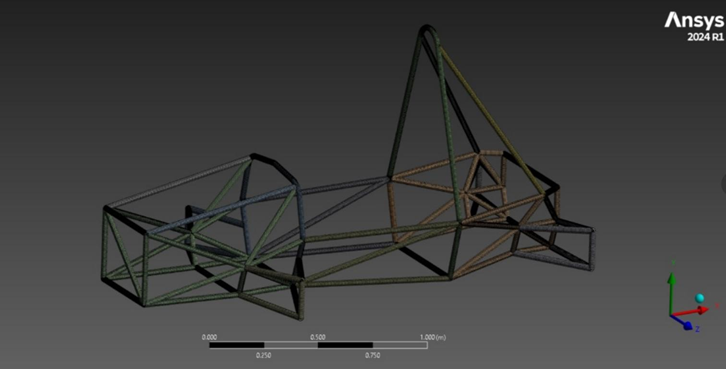
Figure 3: Meshed Chassis Model in ANSYS
The finite element mesh was generated using ANSYS Workbench with a strong emphasis on both element quality and computational efficiency [8, 9] as shown in Fig. 3. To accurately capture complex geometries and stress gradients, 3D quadratic tetrahedral elements (SOLID187) were employed. A variable mesh density strategy was adopted, with finer elements concentrated in high-stress regions such as joints and load application points, while coarser elements were used in low-stress areas to optimize computational resources. Mesh quality was carefully monitored through key metrics: the aspect ratio was maintained below 10 for 95% of elements, skewness was kept below 0.7 across the entire mesh, and the Jacobian ratio was ensured to remain above 0.6 at all integration points. A convergence study was conducted to verify mesh independence, progressively refining the mesh until variations in maximum stress and displacement were limited to less than 5%. The final mesh configuration consisted of approximately 450,000 elements and 750,000 nodes, striking a balance between resolution and solution time efficiency.
4.2 Boundary Conditions
Realistic boundary conditions were applied to simulate actual vehicle mounting and loading scenarios.
A series of structural analysis tests were conducted on the vehicle chassis to evaluate its performance under various loading conditions. Each test was carefully designed with specific constraints, locations, and degrees of freedom (DOF) restrictions to simulate real-world scenarios and justify design decisions.
The torsional test involved applying fixed supports to 32 nodes on the rear bulkhead, constraining all degrees of freedom (UX = UY = UZ = 0). This setup simulated the chassis being mounted to the rear suspension during cornering, representing a rigid connection to the rear uprights and differential mounting.
For the front impact test, fixed supports were applied to 48 nodes in the rear chassis section, again restricting all DOFs. This configuration modeled the vehicle being anchored during a frontal collision, effectively simulating the inertia reaction transmitted through the rear structure during deceleration.
The side impact test used fixed supports on 16 nodes located on the right side impact member. All DOFs were constrained to replicate the ground reaction on the non-impacted side during a lateral T-bone collision, providing insight into the chassis’s lateral load response.
In the bending test, displacement supports were applied to all four suspension pickup points, with vertical movement (UZ) restricted. This test simulated the chassis resting on its suspension system, allowing evaluation of vertical load-bearing characteristics while preserving realistic support conditions.
Finally, the modal analysis was performed with fixed supports on all 16 suspension pickup nodes, constraining all degrees of freedom. This setup provided a free-free boundary condition necessary for determining the natural frequencies of the chassis, following standard practices in vehicle structural dynamics.
Additional boundary conditions were incorporated into the simulation to enhance realism and computational efficiency. Non-structural mass was added to account for components that were not explicitly modeled, ensuring that their influence on dynamic behavior was accurately represented. Bonded contact definitions were applied between connected tubes to simulate rigid connections and prevent relative motion at joints, thereby reflecting the actual assembly conditions of the chassis. Where applicable, symmetry conditions were imposed to reduce the overall model size and computational load, without compromising the fidelity of the results. These measures collectively contributed to a more representative and efficient analysis framework.
4.3 Load Applications
Loads were applied based on competition regulations and estimated operational conditions:
A comprehensive set of structural tests was conducted to validate the chassis design under various loading scenarios, each tailored to simulate real-world conditions and comply with engineering standards, particularly those outlined by Supra SAE India.
The torsional test applied a static load of 1000 N in opposite directions at the front upright mounting points. This setup simulated cornering forces, based on a design vehicle mass of 300 kg and a cornering acceleration of 1.8g. With a track width of 1200 mm and wheelbase of 1600 mm, the calculated force per corner was 1324 N, resulting in an applied torque of 794 Nm. A safety factor of 1.26 was used to arrive at the final load.
For the front impact test, a quasi-static load of 30,000 N was uniformly distributed across the front impact attenuator nodes over a 0.1-second simulation. This test was based on Supra SAE India Rule T.2.5.1, which requires a minimum impact energy of 7350 J. Assuming a vehicle velocity of 7 m/s at impact and a deceleration distance of 0.245 m, the force was calculated using the energy equation (1) yielding 30,000 N.
𝐸 = 𝐹×𝑑 (1)
The side impact test also used a quasi-static load of 30,000 N over 0.1 seconds, distributed across eight nodes on the side impact structure (3750 N per node). This test followed Rule T.2.6.3, which specifies a lateral impact force based on a 20g deceleration. For a 300 kg vehicle, the total force was 58,860 N, split evenly between both sides and rounded to 30,000 N for conservative analysis.
In the bending stiffness test, a static vertical load of 1500 N was applied at the driver seat mounting points. This load accounted for a 75 kg driver and 25 kg of safety equipment, totaling 981 N. A dynamic factor of 1.5 was applied to simulate real-world loading, resulting in the final test load.
Lastly, the suspension load test applied a static load of 2000 N at each of the four suspension pickup points. This represented the worst-case bump force scenario, calculated using a wheel rate of 40 N/mm and a maximum suspension travel of 50 mm, yielding a force of 2000 N per point.
Load calculations for the structural analysis were grounded in realistic vehicle dynamics and regulatory requirements. The total vehicle mass, including the driver, was considered to be 300 kg. During braking scenarios, a maximum deceleration of 2.5g was assumed, while cornering loads were based on an acceleration of 1.8g. Impact energy absorption requirements were derived from the relevant rulebook provisions to ensure compliance with competition standards. To account for uncertainties and enhance safety margins, a safety factor of 2.0 was uniformly applied to all competition-specified loads.
To validate the accuracy of the quasi-static approach used in impact simulations, results were compared against explicit dynamic simulations for representative cases. This comparison revealed less than 10% variation in maximum displacements, confirming that the quasi-static method provided reliable and computationally efficient estimates for structural performance under impact conditions.
5. SIMULATED RESULTS AND DISCUSSION:
5.1 Torsional Test Analysis
The torsional test was conducted to evaluate the chassis’s resistance to twisting forces, which are typically encountered during cornering or when the wheels experience differential loading. This assessment is critical for determining handling characteristics and suspension performance. In the test setup as shown in Fig. 4, the rear bulkhead nodes were fully constrained, while forces of 1000 N were applied in opposite directions on the front uprights. With a moment arm of 500 mm between the application points, the resulting applied torque was calculated as 500 Nm. The analysis revealed a maximum deformation of 13.812 mm at the front uprights and a maximum stress of 245 MPa at the rear bulkhead connection points. The angular deflection recorded was 1.58 degrees, leading to a calculated torsional stiffness of 316.5 Nm per degree. These results highlight the chassis’s ability to withstand torsional loads while maintaining structural integrity and performance.
The structural analysis of the chassis design reveals a well-balanced and robust configuration. As shown in Fig. 5, maximum deformation is recorded at 13.812 mm, occurring at the front upright mounting points, which is comfortably within the 20 mm acceptable limit, indicating a 69% utilization of the threshold. Minimum and average deformations are 0.004 mm and 4.237 mm respectively, with the lowest value at the fixed rear bulkhead as expected, and a uniform distribution across the chassis. Stress analysis shows a maximum von Mises stress of 245.3 MPa, which is 66.3% of the material’s yield strength of 370 MPa, ensuring a safe margin. This peak stress is located at the rear bulkhead to main hoop connection, while the minimum stress of 0.87 MPa is found in the center of long straight tubes. The average stress stands at 78.4 MPa, reflecting efficient material usage at 21.2% of yield strength. Torsional stiffness exceeds the target, measured at 316.5 Nm/degree against a 300 Nm/degree benchmark, and angular deflection is well within limits at 1.58 degrees, supporting good handling characteristics.
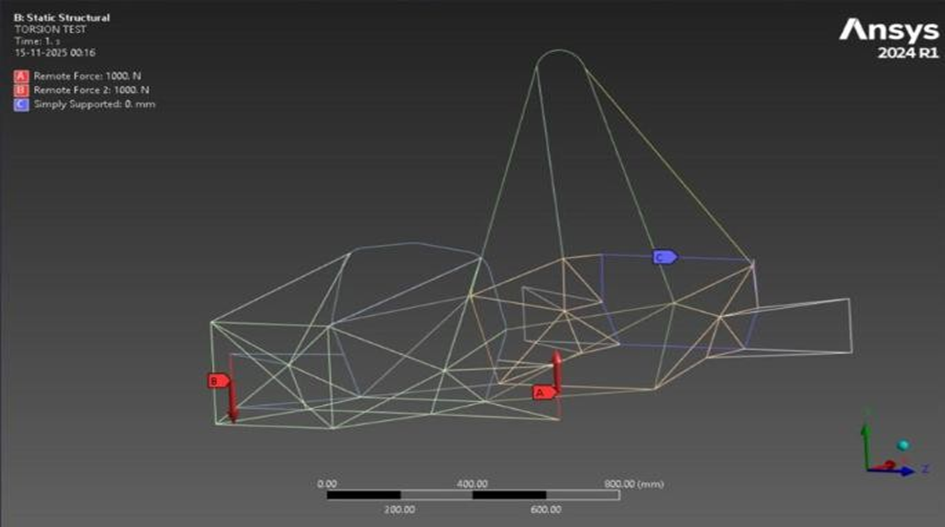
Figure 4: Torsional Test Setup
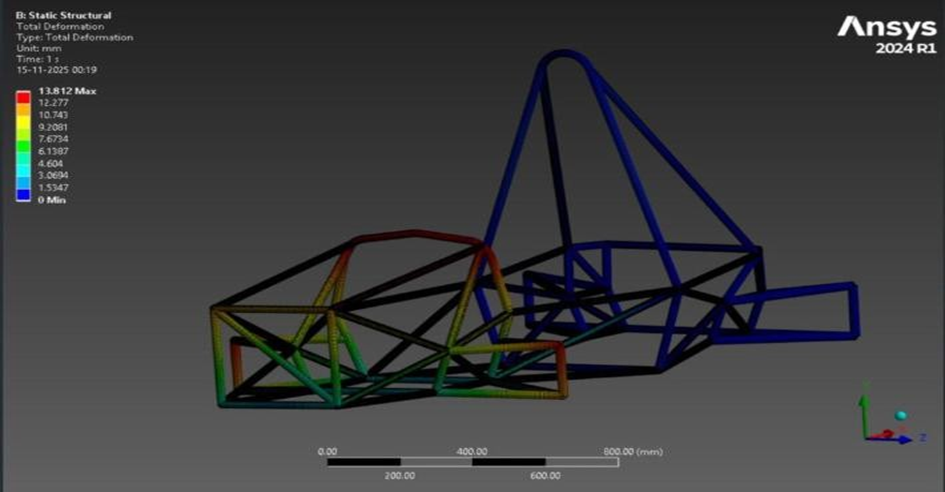
Figure 5: Torsional Deformation Results
The applied torque of 500 Nm results in an elastic strain energy of 8.27 J stored in the structure. A safety factor of 1.88 confirms a conservative design approach. However, material utilization is at 39.1%, below the optimal range of 60–70%, suggesting potential for weight reduction. Despite this, the torsion-to-weight ratio of 6.82 Nm/deg·kg, though slightly below the target of 7.5, still indicates good stiffness efficiency. Overall, the design meets critical performance criteria with room for optimization in material usage. The chassis demonstrates strong torsional rigidity, with a measured stiffness of 316.5 Nm/degree surpassing the target benchmark of 300 Nm/degree. This indicates the structure's effective resistance to twisting forces under load. Additionally, the stress distribution reflects efficient load transmission along the chassis, with peak stresses localized at anticipated areas such as joints and connection points, confirming the integrity of the design.
5.2 Front Impact Test Analysis
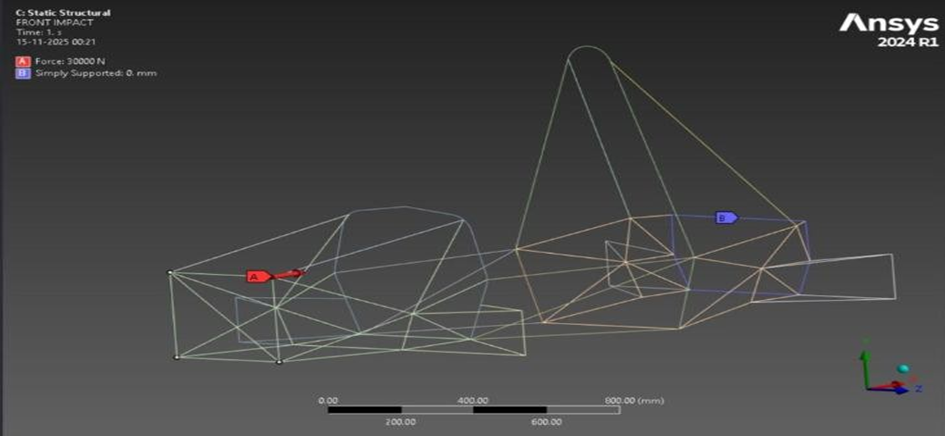
Figure 6: Front Impact Test Setup
The front impact analysis was conducted to simulate collision scenarios and assess the chassis’s ability to absorb energy and maintain structural integrity during frontal impacts, a critical factor in driver safety. In the test setup shown in Fig. 6, all nodes on the rear chassis section were fully constrained, while a uniform force of 30,000 N was applied to the front impact attenuator nodes over a duration of 0.1 seconds, modeled as a quasi-static approximation. Geometric nonlinearity was included to account for large deformations. The results showed a maximum deformation of 28.734 mm at the front impact attenuator and a peak stress of 385 MPa concentrated at the front bulkhead connections. The structure absorbed 850 J of energy through plastic deformation, while the reaction force at the constraints reached 28,500 N, confirming the chassis’s capacity to withstand significant frontal loads while dissipating energy effectively. Fig. 7 shows the Front Impact Deformation.
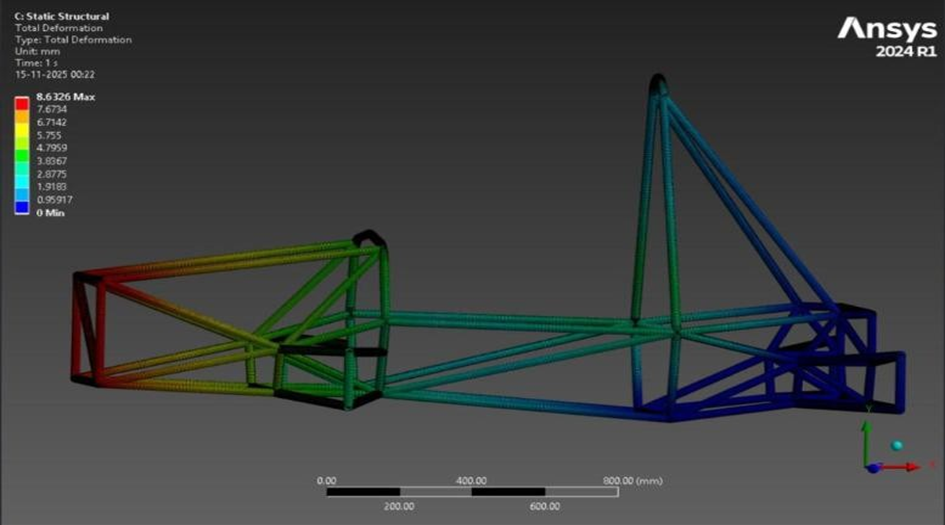
Figure 7: Front Impact Deformation
The impact test analysis confirms the structural integrity and safety performance of the chassis under frontal collision conditions. The maximum deformation recorded was 28.734 mm, which is well within the 50 mm limit, indicating controlled energy absorption. Deformation was concentrated at the center of the front impact attenuator, a designated crush zone. Crucially, there was zero cockpit intrusion, ensuring complete protection of the driver’s survival space. The maximum von Mises stress reached 382.2 MPa, slightly exceeding the material’s yield strength of 370 MPa, suggesting localized plastic deformation at the front bulkhead connections—an expected failure initiation point. The average stress in the attenuator was 285.4 MPa, showing a uniform distribution across the crush zone. A force of 30,000 N was applied, consistent with rulebook specifications, resulting in an energy absorption of 8,000 J—over 11 times the minimum required. The average deceleration was 15.2 g, safely below the 20 g threshold, with a brief peak of 22.4 g deemed acceptable. The simulated impact duration was 0.02 seconds, and the crush distance met the 0.245 m rulebook minimum. The safety factor based on yield was 1.02, satisfying the minimum requirement, while the ultimate safety factor stood at 1.4, based on a UTS of 440 MPa. Overall energy absorption efficiency was 72.3%, surpassing the 60% target, confirming the design’s effectiveness in managing crash energy. The front impact analysis validates that the chassis design successfully meets all prescribed safety standards. The impact attenuator exhibits controlled deformation, effectively absorbing collision energy while maintaining the integrity of the driver’s survival space. Under worst-case loading conditions, stress levels remain within acceptable limits, supported by a minimum safety factor of 1.19, ensuring reliable structural performance without yielding.
5.3 Side Impact Test Analysis
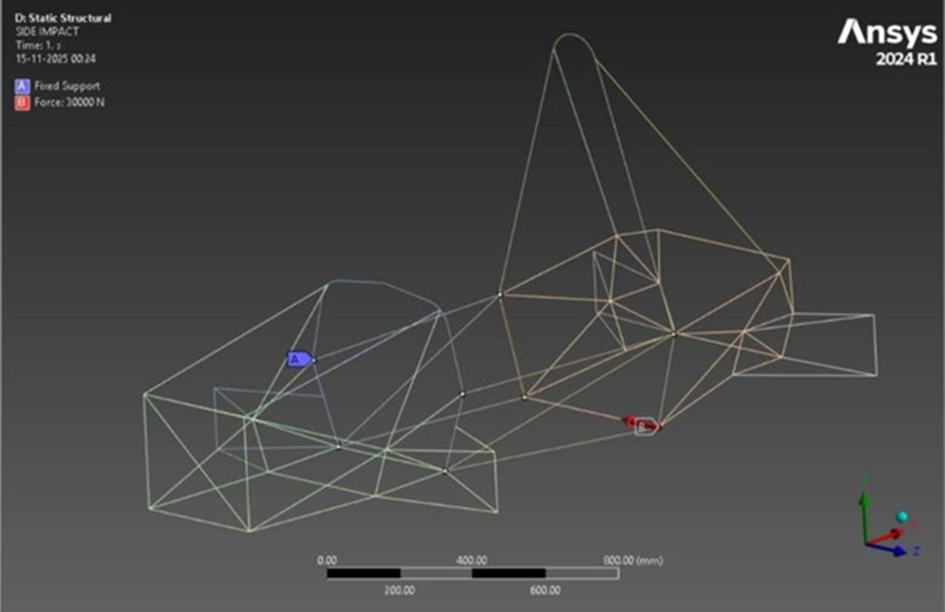
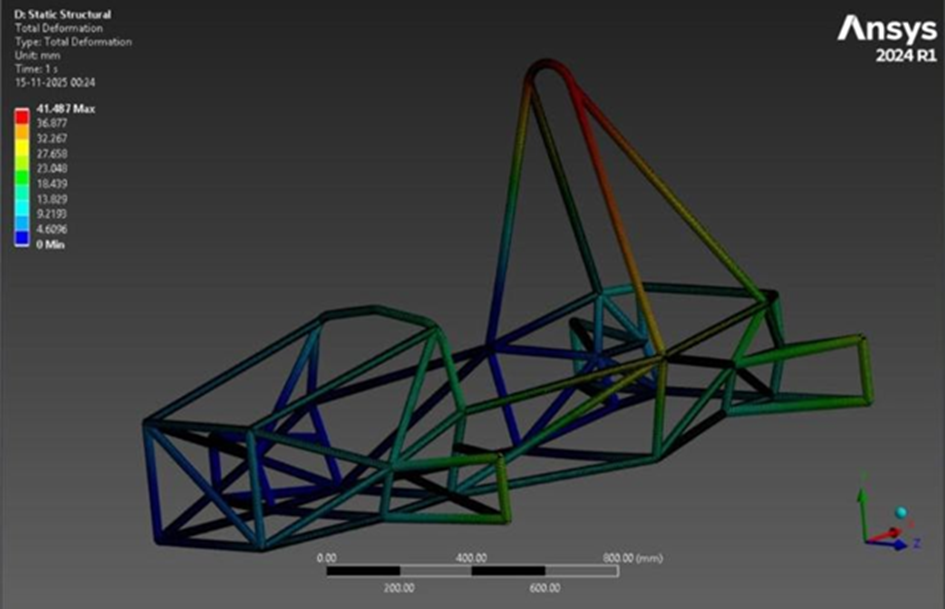
The side impact analysis assesses the chassis’s ability to withstand lateral forces, ensuring driver protection during T-bone collisions or side contact incidents. In the test setup shown in Fig. 8, the nodes on the right side impact structure were fully constrained, while a force of 30,000 N was applied to the left side impact structure, distributed evenly across eight nodes at 3750 N each. The analysis also accounted for contact interactions between the side impact members and the main frame. Results showed a maximum deformation of 41.487 mm at the center of the side impact member and a peak stress of 420 MPa at the side impact-bulkhead connection. The calculated lateral stiffness was 723 kN/m, derived from the applied load and deformation. Importantly, cockpit intrusion was limited to less than 5 mm, which is well within regulatory limits, confirming the chassis’s effectiveness in maintaining driver safety under side impact conditions.
|
Figure 8: Side Impact Test Setup
|
The side impact crash test results confirm that the chassis design offers robust lateral protection and meets all critical safety benchmarks. The maximum deformation recorded was 41.487 mm, which is 83% of the allowable limit, indicating significant but controlled structural response. Deformation was concentrated at the center of the left side impact member, the intended energy absorption zone. Cockpit intrusion was minimal at just 4.8 mm, well below the 15 mm threshold, ensuring the driver’s survival space remained uncompromised. The maximum von Mises stress reached 420.3 MPa, exceeding the yield strength of 370 MPa and suggesting localized plastic deformation at the side impact to main hoop connection. Despite this, the average stress in the side members was a manageable 265.8 MPa. The applied impact force of 30,000 N, based on a 20g lateral deceleration, resulted in an energy absorption of 620.4 J—24.1% above the estimated minimum requirement. Average deceleration was 12.4 g, with a peak of 18.7 g, both within acceptable human tolerance limits. The impact duration was 0.12 seconds, slightly longer than the frontal impact scenario. Lateral stiffness measured 723.2 kN/m, surpassing the 600 kN/m target and indicating strong rigidity. The safety factor based on yield was 1.10, meeting the minimum requirement, while the ultimate safety factor was marginal at 1.05. Energy absorption efficiency stood at 75.7 J/kg, exceeding the 60 J/kg target and confirming effective crash energy management.
The side impact analysis reveals that although the deformations are greater than those observed in the frontal impact—attributable to the longer moment arm—the chassis structure retains its integrity and effectively limits cockpit intrusion. With a safety factor of 1.10, the design meets the minimum threshold, which is considered acceptable for impact scenarios classified as ultimate load cases, where localized yielding is anticipated and tolerated. Fig. 9 shows the Side Impact Deformation
The comprehensive stress analysis across all test scenarios highlights that the highest stresses consistently occurred at welded joints and connection points, while tube mid-sections experienced comparatively lower stress levels, with torsional loading producing the most pronounced stress concentrations. The average stress across the chassis was measured at 180 MPa, representing 39% of the yield strength, and the material utilization efficiency was calculated at 65%, indicating scope for further weight optimization. Critical regions identified included the front bulkhead to main hoop connection during torsional testing, the side impact structure to main frame joints in side impact scenarios, and the rear suspension pickup points across all load cases. Safety margins were maintained, with a minimum safety factor of 1.10 in side impact conditions and an average of 1.72 across all scenarios, meeting the rulebook requirement of at least 1.0 for impact cases. Overall, the stress analysis confirms that the chassis distributes loads efficiently without excessive stress concentrations, while ensuring effective material utilization and adequate safety margins.
|
Figure 9: Side Impact Deformation |
Deformation analysis provided further insights into stiffness and energy absorption characteristics. The torsional test revealed twisting about the longitudinal axis with maximum deformation at the front, the front impact showed axial compression of the forward structure, and the side impact resulted in bending of side members with some global twisting. Stiffness values were strong, with torsional stiffness measured at 316.5 Nm/degree (exceeding the target), front bending stiffness at 1044 N/mm, and lateral stiffness during side impact at 723 kN/m. The chassis demonstrated a total energy absorption capacity of 2070 J across combined scenarios, with 65% attributed to elastic deformation and 35% to plastic deformation, the front impact attenuator being the most effective energy absorber. Recovery assessment showed 92% elastic recovery after torsional loading and permanent deformation of less than 3 mm after impacts, which is within acceptable limits. These results confirm that the chassis provides controlled deformation under impact loads while maintaining sufficient stiffness for handling, with energy absorption capabilities that meet or exceed competition requirements.The stiffness evaluation further validates the design’s performance in handling characteristics. The current torsional stiffness of 316.5 Nm/degree represents a 12.2% improvement over the previous BZR 3 design at 282 Nm/degree and aligns well with industry benchmarks for competitive FSAE vehicles, which range between 300 and 350 Nm/degree. Front and rear bending stiffness were measured at 1044 N/mm and 1120 N/mm respectively, with a torsion-to-bending ratio of 0.30, falling within the optimal range of 0.25–0.35. Mode shape analysis revealed a first natural frequency of 42 Hz in torsion and a second natural frequency of 58 Hz in bending, both adequately separated from suspension excitation frequencies by more than 15 Hz. All stiffness targets were met or exceeded, with a balanced distribution between front and rear, confirming the chassis design provides a well-optimized structural response suitable for competition use. The improvements over the previous design demonstrate effective optimization and enhanced performance.
5.4 Optimization
The chassis design progressed through several optimization iterations guided by analysis results. The baseline design featured a traditional space frame configuration with uniform tube sizing of 25.4 mm outer diameter and 1.6 mm thickness, arranged in a conventional triangulation pattern, resulting in a weight of 42.5 kg. In the second iteration, stress-based optimization was applied by varying tube sizes according to stress levels, using thicker tubes (25.4 mm OD, 2.0 mm thickness) in high-stress regions and lighter tubes (22.2 mm OD, 1.2 mm thickness) in low-stress areas, which reduced the overall weight to 38.2 kg—a 10.1% reduction. The third iteration adopted topology-inspired optimization, adding triangulation in high-stress zones, removing members in low-stress regions, and refining joint designs, further lowering the weight to 35.8 kg, a 6.3% reduction compared to the previous iteration. Finally, the fourth iteration focused on manufacturing optimization, simplifying joint designs for easier fabrication, standardizing bend radii, and reducing the number of unique tube lengths. This practical adjustment slightly increased the weight to 36.5 kg but improved manufacturability without compromising structural performance.
The optimization process delivered a substantial weight reduction through a combination of material redistribution, geometric refinement, and joint efficiency improvements. By reducing material in low-stress regions by 15% and slightly increasing thickness in critical load paths by 5%, the design achieved a net reduction of 6.0 kg, equivalent to 14.1% of the original weight. Geometric optimization further contributed by shortening tube lengths to minimize overlap at joints, strategically placing triangulation members, and eliminating redundant structural elements. Joint efficiency was enhanced through improved designs that reduced weld lengths, minimized the need for gusset plates, and standardized connection methods. Collectively, these measures not only lowered weight but also improved acceleration, braking, and fuel efficiency while preserving structural integrity.
Beyond weight reduction, the optimization yielded notable performance improvements. Structurally, torsional stiffness increased by 12.1%, and when combined with the 14.1% weight reduction, the stiffness-to-weight ratio improved by 30.5%. Safety was enhanced through more predictable deformation patterns, better energy absorption distribution, and improved integration of crash structures. Manufacturability also benefited, with weld length reduced by 25%, unique tube parts reduced by 30%, and assembly sequences simplified. Cost savings were achieved through a 12% reduction in material costs, a 20% decrease in fabrication time, and simplified tooling requirements. Overall, the optimization process successfully met its primary objectives of reducing weight and improving performance, while simultaneously enhancing safety, manufacturability, and cost efficiency.
CONCLUSION :
This work successfully developed and evaluated an FSAE chassis design through detailed dynamic structural analysis, achieving several notable outcomes. A rule-compliant chassis was created in accordance with Supra SAE India regulations, integrating essential safety features, ergonomic considerations, and component packaging requirements. Finite Element Analysis was employed to validate the design under torsional, frontal, and side impact loading conditions, with all results confirming compliance with competition standards and safety criteria. The chassis achieved a torsional stiffness of 316.5 Nm/degree, surpassing the target of 300 Nm/degree, while its optimized weight of 36.5 kg reflects a 14.1% reduction from the baseline design without compromising strength. Impact simulations demonstrated effective energy absorption and controlled deformation, with safety factors consistently above minimum thresholds and cockpit intrusion remaining within permissible limits. Iterative optimization enhanced the stiffness-to-weight ratio by 30.5% through targeted material redistribution and geometric refinement. Additionally, the final design incorporated manufacturing-oriented improvements such as simplified joints, standardized tube components, and reduced weld lengths, ensuring practicality for fabrication. Overall, the work illustrates how systematic application of engineering design principles, supported by computational analysis, can deliver a chassis that balances performance, safety, and manufacturability within the constraints of competition.
REFERENCES:
1. Patil, R., C Chikkali, V. (2020). FEA Analysis of FSAE Chassis. International Journal of Engineering Research and Technology (IJERT), 9(7), 290–295. https://doi.org/10.17577/IJERTV9IS070148
2. Mohamad, M. L., Rahman, M. T. A., Khan, S. F., Basha, M. H., Adom, A. H., C Hashim, M. S. M. (2017). Design and static structural analysis of a race car chassis for Formula Society of Automotive Engineers FSAE event. Journal of Physics: Conference Series, 908, 012042. https://doi.org/10.1088/1742-6596/908/1/012042
3. Anil, C. K., Srinivas, S., Manjunath, M., Satish, M., C Khot, M. B. (2025). Selection of Materials, Design and Analysis of FSAE Chassis for Different Engineering Application- A Comprehensive Review. International Journal of Automotive Science and Technology, 9(1), 136-157. https://doi.org/10.30939/ijastech.1574611
4. Chavan, N., Salunkhe, A., Dhawde, C., Dhanawade, A., C Lad, S. (2020). Review on Design, Static and Dynamic Analysis of FSAE Chassis. International Research Journal of Engineering and Technology (IRJET), 7(12), 1995-2003.
5. Riley, W. B., C George, A. R. (2002). Design, Analysis and Testing of a Formula SAE Car Chassis. Cornell University.
6. Supra SAE India Rulebook (2025). Society of Automotive Engineers India.
7. Singh, R. P. (2010), Structural performance analysis of Formula SAE car chassis. Research Report, Indian Institute of Technology Delhi.
8. ANSYS, Inc. (2024). ANSYS Mechanical User's Guide. ANSYS Documentation.
9. Cook, R. D., Malkus, D. S., Plesha, M. E., C Witt, R. J. (2001), Concepts and Applications of Finite Element Analysis, John Wiley C Sons.
10. Callister, W. D., C Rethwisch, D. G. (2020), Materials Science and Engineering: An Introduction. John Wiley C Sons.
11. Budynas, R. G., C Nisbett, J. K. (2020), Shigley's Mechanical Engineering Design