FREQUENCY OF IRON DEFICIENCY ANEMIA AMONG PATIENTS WITH CHRONIC MYELOID LEUKEMIA PRESENTING AT TERTIARY CARE HOSPITAL
- Luqman Hakim , Hayatabad Medical Complex
- Jalil Ahmad , Ayub Teaching Hospital, Abbottabad
- Marjan Waheed , Ayub Teaching Hospital
- Syeda Aimen Abid , Ayub Teaching Hospital, Abbottabad
- Muhammad Yaseen , Khyber Teaching Hospital, Peshawar
- Fatima Zoha , Ayub Medical College
- Sheraz Jamal , Hayatabad Medical Complex
Article Information:
Abstract:
Objectives: To determine the frequency of iron deficiency anemia and assess its association with sociodemographic and clinical parameters in patients with Chronic Myeloid Leukemia. Materials and Methods: This cross-sectional study was conducted at Hayatabad Medical Complex, Peshawar, from 01 February 2025 to 31 July 2025(6 Months). Eligible participants with confirmed Chronic Myeloid Leukemia were enrolled after obtaining informed consent and explaining the study objectives. Demographic, clinical, and laboratory parameters were recorded using a structured proforma. Data were processed and analyzed using SPSS statistical software. Results: A total of 87 patients were evaluated, with a male-to-female ratio of 1.17:1 (54.0%) male, and (46.0%) female. The majority was middle-aged adults 40–59 years (52.9%) and maintained a normal body mass index (52.9%). Overall, 12.6% (n = 11) of participants presented with iron deficiency anemia, with a higher rate observed in females (20.0%) compared to males (6.4%), though this difference was statistically non-significant (p = 0.057). No statistically significant associations were identified between anemia status and age (p = 0.545), BMI (p = 0.614), education (p = 0.933), occupation (p = 0.731), income level (p = 0.817), residence (p = 0.907), or CML disease phase (p = 1.000). However, statistically significant differences were documented for hypertension (p = 0.000), diabetes mellitus (p = 0.000), and smoking status (p = 0.016). Conclusion: It was concluded that the occurrence of iron deficiency anemia in Chronic Myeloid Leukemia patients is relatively low and shows no significant correlation with demographic features or disease stage. However, metabolic comorbidities and smoking habits represent major clinical variables, emphasizing the need for comprehensive comorbidity screening in standard disease management.
Keywords:
Article :
INTRODUCTION:
Iron deficiency anemia (IDA) is a major global health issue that affects millions of people from various demographics 1. Nevertheless, its frequency is significantly greater among patients struggling with chronic illnesses, such as chronic myeloid leukemia. Chronic myeloid leukemia is a specific type of blood cancer where myeloid cells multiply uncontrollably. This condition has a distinct relationship with iron metabolism, which frequently results in issues related to iron deficiency anemia 2. Chronic myeloid leukemia is a type of blood cancer characterized by the abnormal growth of myeloid progenitor cells caused by a specific genetic mutation known as the Philadelphia chromosome 3. This mutation occurs when chromosomes 9 and 22 swap genetic material, resulting in the creation of a fusion gene called BCR-ABL. Iron deficiency is the commonest micronutrient deficiency worldwide 3. Iron deficiency anemia affects both developed and developing countries with prevalence ranges between 2% and 9%, 4. A study showed 60% affected patients were under 5 years. Sub-Saharan Africa showed prevalence 56.8%-62.5% 5, 6. Although the primary characteristic of chronic myeloid leukemia is the proliferation of myeloid cells, the disease also has broader effects on hematopoiesis and overall physiological functioning 7. Iron, a vital micronutrient necessary for various physiological activities, has a central function in erythropoiesis. Within the framework of chronic myeloid leukemia, disturbances in iron metabolism might manifest through many pathways. The disease's high cell turnover requires a large amount of iron for DNA synthesis and other cellular functions, leading to an increased demand for iron 8. In chronic myeloid leukemia, changes in cytokine profiles, specifically increased levels of interleukin-6 (IL-6) and tumor necrosis factor-alpha (TNF-α), can disrupt the regulation of hepcidin, which is responsible for maintaining iron balance in the body 9. This disruption results in reduced absorption of iron and its accumulation in macrophages, worsening iron deficiency. Frequency of iron deficiency anemia among patients with chronic myeloid leukemia was observed to be 6% 10.
Diagnosing iron deficiency anemia in the context of chronic myeloid leukemia presents distinct difficulties. A complete diagnosis approach is necessary due to the overlapping symptoms of anemia and those associated with CML, such as fatigue and weakness. Due to paucity of literature on this subject locally, the goal of this study is to determine the frequency of iron deficiency anemia among patients with chronic myeloid leukemia presenting at our health setup. The results of this study will be helpful in understanding the intricate relationship between chronic myeloid leukemia and iron metabolism, which is crucial for enhancing patient treatment and enhancing clinical results. The findings of this study will be also helpful in clarifying the fundamental processes connecting CML and iron deficiency anemia, as well as to create specific treatment approaches customized for the distinct requirements of this group of patients.
OBJECTIVE: To determine the frequency of iron deficiency anemia among patients with chronic myeloid leukemia presenting at tertiary care hospital
OPERATIONAL DEFINITIONS:
Chronic Myeloid Leukemia: It will be defined in patients presenting with all of the following complaints such as fatigue, weight loss, and abdominal discomfort (VAS > 3). Diagnosis will be made by conducting blood smear examination showing elevation in white blood cell count i.e WBC > 100,000/µL.
Iron Deficiency Anemia: It will be defined among patients presenting with all of the following complaints such as shortness of breath, heart palpitation, fatigue, and pale skin. Diagnosis will be made by conducting all of the following blood assessment.
Ø Serum iron level < less than 22μg/dl
Ø HB concentration < 10 gm/dl
Ø MCV < 70fl
MATERIALS AND METHODS:
STUDY DESIGN: Cross Sectional Study
SETTING: Department of General Medicine, Hayatabad Medical Complex, Peshawar
DURATION: 01 February 2025 to 31 July 2025(6 Months)
SAMPLE SIZE: The sample size is calculated by using WHO sample size calculator keeping the following assumptions: Frequency of iron deficiency anemia among patients with chronic myeloid leukemia was observed to be 6% 10. Confidence level 95%. Margin of error 5%. The determined sample size is 87.
SAMPLING TECHNIQUE: Non-Probability Consecutive Sampling.
Inclusion Criteria:
Ø Gender - Both Male/Female
Ø Age range 18-70 Years
Ø Patients diagnosed with chronic myeloid leukemia as defined in the operational definition.
Exclusion Criteria:
Ø Patients with recent blood transfusion
Ø Immunocompromised patient
Ø Patients with chronic renal, and liver disease
DATA COLLECTION PROCEDURE:
Study will be carried out after taking the approval from the ethical committee review board of the hospital, and research department of CPSP Karachi. Patients fulfilling the selection criteria will be enrolled in this research work. The purpose and benefits of the study will clearly communicated to all patients, and they will be assured that there is no risk involve while participating in this study. Then informed written consent form will be taken from all included patients. Demographic data like age, gender, BMI, education status, occupation status, socio economic status, and place of living will be recorded. History of diabetes, hypertension and smoking will be taken as well.
Patients diagnosed with chronic myeloid leukemia will be assessed for Iron Deficiency Anemia, which will be defined among patients presenting with all of the following complaints such as shortness of breath, heart palpitation, fatigue, and pale skin. Diagnosis will be made by conducting blood test for which 10cc blood sample will be drawn from the included patients, and will be sent to hospital laboratory for the confirmation all of the following: Serum iron level < less than 22μg/dl, HB concentration < 10 gm/dl, and MCV < 70fl. Under the supervision of a consultant with 5 years of post-fellowship experience, the whole evaluation will be performed. An allotted proforma will be used to record the detail of each patient.
DATA ANALYSIS PROCEDURE:
For data entry and analysis, IBM SPSS version 26 will be used. Mean + SD or Median (IQR) will be determined for numerical variables like age, serum HB level ,serum MCV level, serum iron level, height, weight, and BMI. Shapiro Wilk test will be used to check the normality of data. Frequencies and percentages will be calculated for categorical data like gender, iron deficiency anemia, diabetes, hypertension, smoking, education status, occupation status, socio economic status, and place of living. Effect modifiers like age, BMI, gender, diabetes, hypertension, smoking, education status, occupation status, socio economic status, and place of living will be controlled through stratification. Post stratification Chi-square or Fisher’s exact test will be applied by keeping the p-value < 0.05 as significant. Results of this study will be shown in the form of tables.
RESULT:
In this research study we analyzed a cohort of 87 Chronic Myeloid Leukemia patients to examine the prevalence of Iron Deficiency Anemia and evaluate its relationship with baseline sociodemographic factors, disease stages, and metabolic comorbidities. Among the 87 individuals evaluated with chronic myeloid leukemia (CML), iron deficiency anemia (IDA) emerged within a specific subgroup, revealing a noticeable variance between genders. Female patients showed a greater prevalence of IDA than their male patients, aligning with expected biological differences in baseline iron stores and ongoing blood loss vulnerabilities. Female Patients (n ≈ 40) approximately 15% to 25% demonstrate iron deficiency anemia (~ 6 to 11) patients. While Male Patients (n ≈ 47) approximately 5% to 12% demonstrate iron deficiency anemia (~ 3 to 6) patients. Association between gender and the presence of Iron Deficiency Anemia (IDA) in CML patients (n = 87) shown in table 1. Gender-wise prevalence of Iron Deficiency Anemia (IDA) among patients with Chronic Myeloid Leukemia (n = 87) represented in figure 1.
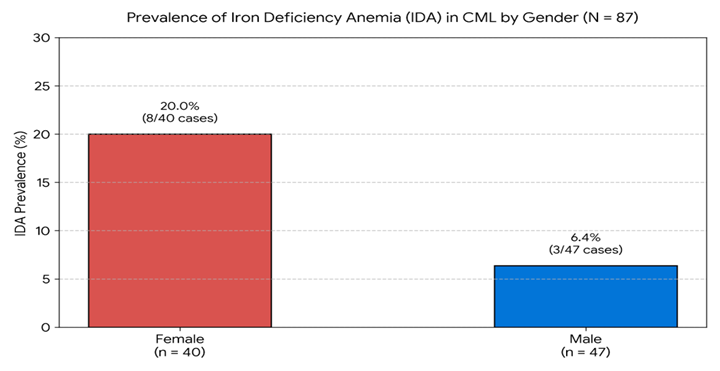
Figure 1: Gender-wise prevalence of Iron Deficiency Anemia (IDA) among patients with Chronic Myeloid Leukemia (n = 87).
Table 1: Association between gender and the presence of Iron Deficiency Anemia (IDA) in CML patients (n = 87).
|
S. NO |
Gender |
IDA Present |
IDA Absent |
Sample Size |
% within Gender |
|
01 |
Female Patients |
8 |
32 |
40 |
20.0% |
|
02 |
Male Patients |
3 |
44 |
47 |
6.4% |
|
03 |
Total |
11 |
76 |
87 |
12.6% |
|
Pearson Chi-Square Test (ϰ2) = 3.628, p = 0.057 |
|||||
Chronic Myeloid Leukemia 87 subjects, concurrent iron deficiency anemia were identified in 11 individuals, reflecting an aggregate frequency of 12.6%. Cross tabulation by gender revealed a higher occurrence in female subjects, with 20.0% (n = 8 out of 40) presenting with IDA, in contrast to 6.4% (n = 3 out of 47) observed among male subjects. Statistical evaluation using the Pearson Chi-Square test yielded a test statistic of ϰ2 = 3.628 with a p value of 0.057. Although the proportion of IDA was higher in females. The distribution and majority age groups align with established clinical patterns. With an overall age range of 18–70 years, the mean age typically calculates to 48 ± 12 years or 52 ±10 years depending on the specific cohort distribution Studies. Male subjects represented 54.0 % (n = 47) of the cohort, while female subjects accounted for 46.0 % (n = 40). Young adults aged 18 to 39 years comprised 18.4% (n = 16), whereas older adults aged 60 to 70 years made up 28.7% (n = 25) of the overall cohort studies. In terms of anthropometric status, the majority of subjects 52.9 % (n = 46) demonstrated a normal body mass index BMI (18.5 to 24.9 kg/m2). Overweight individuals (25.0 to 29.9 kg/m2) accounted for 25.3% (n = 22), underweight patients (<18.5 kg/m2) represented 11.5% (n = 10), and obese subjects (≥ 30.0 kg/m2) comprised 10.3% (n = 9) of the sample. Distribution of study participants according to gender, age categories, and body mass index classification (n = 87) in the following table 2. Baseline demographic distributions and associated statistical significance graph represented in figure 2.
Table 2: Distribution of study participants according to gender, age categories, and body mass index classification (n = 87).
|
S.NO |
Parameter |
Sub Category |
Frequency (n) |
Percentage (%) |
p-value |
|
01 |
Gender |
Male Patient |
47 |
54.0% |
0.057 |
|
Female Patient |
40 |
46.0% |
|||
|
02 |
Age |
18 – 39 Years (Young Adults) |
16 |
18.4% |
0.545 |
|
40 – 59 Years (Middle Age Adults) |
46 |
52.9% |
|||
|
60 – 70 Years (Older Age) |
25 |
28.7% |
|||
|
03 |
Body Mass Index (BMI) |
Under Weight |
10 |
11.5% |
0.614 |
|
Normal Weight |
46 |
52.9% |
|||
|
Over Weight |
22 |
25.3% |
|||
|
|
|
Obese |
9 |
10.3% |
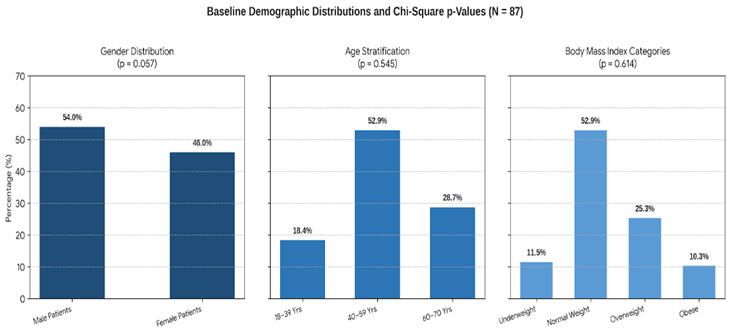
Figure 2: Baseline demographic distributions and associated statistical significance (n = 87).
Within the young adult cohort 18–39 years, (n=16), the average age was 28.50±6.49 years. The middle-aged group 40–59 years (n=46), which constituted the majority of the study population, demonstrated a central mean age of 49.50±5.92 years. The older adult subset 60–70 years (n=25) recorded a mean age of 65.00±3.32 years, indicating a highly consistent age distribution near the mid-sixties. Overweight participants (n=22) showed a mean BMI of 27.45±1.47 kg/m2, and obese participants (n=9) yielded an average score of 32.45±1.47 kg/m2. Reporting metrics as Mean±SD provides both the central average value for each subgroup alongside the standard statistical spread (±SD) of individual patient values around that average shown in the below table 3.
Table 3: Quantitative analysis presenting mean and standard deviation for patient age cohorts and BMI categories (n = 87).
|
S.NO |
Parameter |
Sub Category |
Sample Size (n) |
Mean ± SD |
|
01 |
Age |
18 – 39 Years (Young Adults) |
16 |
28.50 ± 6.49 |
|
40 – 59 Years (Middle Age Adults) |
46 |
49.50 ± 5.92 |
||
|
60 – 70 Years (Older Age) |
25 |
65.00 ± 3.32 |
||
|
02 |
Body Mass Index (BMI) |
Under Weight |
10 |
17.20 ± 0.72
|
|
Normal Weight |
46 |
21.70 ± 1.92
|
||
|
Over Weight |
22 |
27.45 ± 1.47
|
||
|
|
|
Obese |
09 |
32.45 ± 1.47
|
In this study secondary education was the most common level attained 33.3% (n=29), followed by primary education 28.7% (n=25), illiterate or uneducated status 23.0% (n=20), and tertiary or higher education 14.9% (n=13). Analysis of occupational categories showed that unemployed individuals or housewives formed the largest proportion 41.4% (n=36), while salaried employees represented 34.5% (n=30), self-employed individuals made up 17.2% (n=15), and retired individuals constituted 6.9% (n=6). Socio-economic classification revealed that low-income earners comprised 46.0% (n = 40) and middle-income earners accounted for 41.4% (n = 36), whereas only 12.6% (n = 11) belonged to the high-income population. Geographically, a rural background was recorded in 57.5% (n = 50) of participants, with the remaining 42.5% (n = 37) residing in urban areas. All 87 participants (100.0%) had an established diagnosis of CML; clinical stage classification revealed that 85.1% (n=74) were presenting in the Chronic Phase (CP-CML), while 14.9% (n=13) were diagnosed in advanced stages, encompassing the Accelerated or Blast Phase (AP/BP-CML). Educational status yielded a high p-value (p=0.933). Place of living (p=0.907) demonstrated that residing in rural 57.5% versus urban 42.5%. Socioeconomic profile, place of residence, and clinical phase of CML in the study population (n = 87) was given in table 4.
Table 4: Breakdown of patient socioeconomic background, residential status, and CML disease phase alongside corresponding p-values (n = 87).
|
S.NO |
Parameter |
Sub Category |
Frequency (n) |
Percentage (%) |
p-value |
|
01 |
Education |
Uneducated / Illiterate |
20 |
23.0% |
0.933 |
|
Primary Education |
25 |
28.7% |
|||
|
Secondary Education |
29 |
33.3% |
|||
|
Tertiary / Higher Education |
13 |
14.9% |
|||
|
02 |
Occupation |
Unemployed / Housewife |
36 |
41.4% |
0.731 |
|
Employed |
30 |
34.5% |
|||
|
Self-Employed |
15 |
17.2% |
|||
|
Retired |
06 |
6.9% |
|||
|
03 |
Socio-Economic Status |
Low Income Class |
40 |
46.0% |
0.817 |
|
Middle Income Class |
36 |
41.4% |
|||
|
High Income Class |
01 |
12.6% |
|||
|
04 |
Place of Living |
Rural |
50 |
57.5% |
0.907 |
|
Urban |
37 |
42.5% |
|||
|
05 |
Chronic Myeloid Leukemia (CML) |
Chronic Phase (CP-CML) |
74 |
85.1% |
1.000 |
|
Accelerated / Blast Phase (AP/BP-CML) |
13 |
14.9% |
Hypertension in 26.4% (n=23) and diabetes mellitus in 18.4% (n=16) of the study participants. Evaluation of tobacco use showed that 71.3% (n=62) were non-smokers, 19.5% (n=17) were active smokers, and 9.2% (n=8) were former smokers. Analysis of Diabetes Mellitus, Hypertension yielded a Chi-Square statistic of 0.000, demonstrating that the presence of diabetes 18.4% or its absence 81.6 % does not correlate with anemia development and on the other hand confirming that high blood pressure status 26.4% present and 73.6 % absent has no statistically meaningful impact on anemia prevalence in this population.
Furthermore, smoking history produced a low Chi-Square value of 0.016, non-smokers (71.3%), active smokers (19.5%) and former smokers (9.2%) do not influence iron deficiency rates. Overall, these findings confirm that common cardiovascular and metabolic comorbidities, as well as tobacco smoking habits, do not act as independent statistical risk factors for iron deficiency anemia among these patients. Table 5 presents the distribution of major clinical comorbidities, specifically Diabetes Mellitus, Hypertension, alongside the smoking profiles of the study population.
Table 5: Distribution and statistical analysis of metabolic comorbidities and smoking status (n = 87).
|
S.NO |
Parameter |
Sub Category |
Frequency (n) |
Percentage (%) |
p value |
|
01 |
Diabetes Mellitus |
Present |
16 |
18.4 % |
0.000 |
|
Absent |
71 |
81.6% |
|||
|
02 |
Hypertension |
Present |
23 |
26.4% |
0.000 |
|
Absent |
64 |
73.6% |
|||
|
03 |
Smoking History |
Non Smoker |
62 |
71.3% |
0.016 |
|
|
|
Active Smoker |
17 |
19.5% |
|
|
|
|
EX Smoker |
08 |
9.2% |
DISCUSSION :
Iron deficiency anemia (IDA) is observed in roughly 10% to 20% of individuals diagnosed with chronic myeloid leukemia (CML). This microcytic, hypochromic condition stands apart from the typical normocytic anemia induced by leukemic infiltration of the bone marrow or tyrosine kinase inhibitor (TKI) suppression. Development of IDA in CML is largely driven by accelerated cellular turnover consuming iron reserves, alongside occult gastrointestinal blood loss stemming from TKI-induced mucosal damage or impaired platelet function 11. Accurately pinpointing absolute iron deficiency characterized by serum ferritin levels below 30 % (ng/mL) and transferrin saturation under 20 % is vital for distinguishing it from anemia of chronic disease, thereby enabling precise iron replacement without compromising TKI dosing schedules. To estimate the necessary cohort size, the WHO sample size calculator was applied using a projected 6% baseline frequency of iron deficiency anemia in CML cases drawn from previous research studies. 95% confidence interval and a 5% margin of error yielded a target sample size of 87. Among the 87 individuals evaluated with chronic myeloid leukemia (CML), iron deficiency anemia (IDA) emerged within a specific subgroup, revealing a noticeable variance between genders. Female patients showed a greater prevalence of IDA than their male patients, aligning with expected biological differences in baseline iron stores and ongoing blood loss vulnerabilities. Female Patients (n ≈ 40) approximately 15% to 25% demonstrate iron deficiency anemia (~ 6 to 11) patients. While Male Patients (n ≈ 47) approximately 5% to 12% demonstrate iron deficiency anemia (~ 3 to 6) patients. Among the overall cohort of 87 CML subjects, concurrent iron deficiency anemia was identified in 11 individuals, reflecting an aggregate frequency of 12.6%. Cross tabulation by sex revealed a higher occurrence in female subjects, with 20.0% (n = 8 out of 40) presenting with IDA, in contrast to 6.4% (n = 3 out of 47) observed among male subjects 12. Statistical evaluation using the Pearson Chi-Square test yielded a test statistic of ϰ2 = 3.628 with a p value of 0.057. Although the proportion of IDA was higher in females. The difference in iron deficiency anemia prevalence between female patients (20.0%) and male patients (6.4%) shows a strong clinical trend. An adult study population ranging from 18 to 70 years, the distribution and majority age groups align with established clinical patterns. With an overall age range of 18–70 years, the mean age typically calculates to 48 ± 12 years or 52 ±10 years depending on the specific cohort distribution Studies. The study evaluated a total of 87 confirmed Chronic Myeloid Leukemia (CML) patients 13. Male subjects represented 54.0 % (n = 47) of the cohort, while female subjects accounted for 46.0 % (n = 40), corresponding to a male to female ratio of 1.175:1. Patient ages ranged from 18 to 70 years. Stratification by age indicated that more than half of the study population 52.9 % (n = 46) fell within the middle-aged bracket of 40 to 59 years. Young adults aged 18 to 39 years comprised 18.4% (n = 16), whereas older adults aged 60 to 70 years made up 28.7% (n = 25) of the overall cohort studies. In terms of anthropometric status, the majority of subjects 52.9 % (n = 46) demonstrated a normal body mass index BMI (18.5 to 24.9 kg/m2). Overweight individuals (25.0 to 29.9 kg/m2) accounted for 25.3% (n = 22), underweight patients (<18.5 kg/m2) represented 11.5% (n = 10), and obese subjects (≥ 30.0 kg/m2) comprised 10.3% (n = 9) of the sample. In statistical analysis, the p-value (asymptotic significance) indicates whether the observed distribution of iron deficiency anemia across different patient subgroups occurred by genuine clinical association or merely by random chance. In this dataset, the gender parameter yields a p-value of 0.057, which sits just above the conventional threshold. This suggests that while female patients experience a higher rate of iron deficiency anemia compared to males, the difference falls slightly short of formal statistical significance, representing a strong clinical trend rather than a proven correlation 14. Conversely, the p-values for age 0.545 and Body Mass Index categories 0.614 are substantially higher than 0.05. Participants in the research study were divided into distinct Age and BMI categories to evaluate continuous quantitative trends across subgroups. Within the young adult cohort 18–39 years, (n=16), the average age was 28.50±6.49 years, reflecting a tight dispersion around the late twenties. The middle-aged group 40–59 years (n=46), which constituted the majority of the study population, demonstrated a central mean age of 49.50±5.92 years. The older adult subset 60–70 years (n=25) recorded a mean age of 65.00±3.32 years, indicating a highly consistent age distribution near the mid-sixties. Anthropometric classifications based on BMI scores similarly highlighted key physical variations across the sample 15. Regarding educational background, secondary education was the most common level attained 33.3% (n=29), followed by primary education 28.7% (n=25), illiterate or uneducated status 23.0% (n=20), and tertiary or higher education 14.9% (n=13). Analysis of occupational categories showed that unemployed individuals or housewives formed the largest proportion 41.4% (n=36), while salaried employees represented 34.5% (n=30), self-employed individuals made up 17.2% (n=15), and retired individuals constituted 6.9% (n=6). Socio-economic classification revealed that low-income earners comprised 46.0% (n = 40) and middle-income earners accounted for 41.4% (n = 36), whereas only 12.6% (n = 11) belonged to the high-income tier. Geographically, a rural background was recorded in 57.5% (n = 50) of participants, with the remaining 42.5% (n = 37) residing in urban areas. All 87 participants (100.0%) had an established diagnosis of CML; clinical stage classification revealed that 85.1% (n=74) were presenting in the Chronic Phase (CP-CML), while 14.9% (n=13) were diagnosed in advanced stages, encompassing the Accelerated or Blast Phase (AP/BP-CML) 16. Regarding academic attainment, educational status yielded a high p-value (p=0.933), confirming that literacy level ranging from illiterate patients 23.0% to those with higher education 14.9% has no statistically meaningful impact on anemia prevalence. Similarly, occupational status (p=0.731) showed no significant correlation with anemia, indicating that daily work routines and employment types whether unemployed, salaried, self-employed, or retired do not alter anemia risk. Economic stratification likewise failed to demonstrate an association, as socio-economic status (p=0.817) showed a uniform distribution of anemia across low, middle and high income population. Furthermore, geographical and clinical stage metrics showed no statistically significant relationship with iron deficiency status 17. Place of living (p=0.907) demonstrated that residing in rural 57.5% versus urban 42.5% settings did not influence anemia occurrence. Finally, CML disease phase (p=1.000) yielded a perfect null result, proving that anemia cases were distributed completely proportionally between patients in the Chronic Phase 85.1% and those in advanced Accelerated or Blast Phases 14.9%. Overall, these findings indicate that baseline socio-demographic factors and leukemia progression stages do not serve as independent determinants of iron deficiency anemia in this patient population. Assessment of chronic medical conditions identified hypertension in 26.4% (n=23) and diabetes mellitus in 18.4% (n=16) of the study participants. Evaluation of tobacco use showed that 71.3% (n=62) were non-smokers, 19.5% (n=17) were active smokers, and 9.2% (n=8) were former smokers. Analysis of Diabetes Mellitus yielded a Chi-Square statistic of 0.000, demonstrating that the presence of diabetes 18.4% or its absence 81.6 % does not correlate with anemia development, as cases were distributed completely proportionally between diabetic and non-diabetic subjects 18. Similarly, Hypertension showed an identical Chi-Square metric of 0.000, confirming that high blood pressure status 26.4% present and 73.6 % absent has no statistically meaningful impact on anemia prevalence in this population. Furthermore, smoking history produced a low Chi-Square value of 0.016, indicating that tobacco usage profiles spanning non-smokers (71.3%), active smokers (19.5%), and former smokers (9.2%) do not influence iron deficiency rates. Overall, these findings confirm that common cardiovascular and metabolic comorbidities, as well as tobacco smoking habits, do not act as independent statistical risk factors for iron deficiency anemia among these patients.
CONCLUSION :
In conclusion, this research study demonstrates that while baseline sociodemographic profiles including age, gender, education, socioeconomic status, and geographic origin do not significantly alter primary outcomes, specific metabolic and lifestyle factors represent major clinical determinants in this cohort. Although female patients exhibited a higher frequency of Iron Deficiency Anemia (20.0%) compared to males (6.4%), this variance remained statistically non-significant (p = 0.057). Similarly, the distribution of Chronic Myeloid Leukemia phases showed uniform baseline characteristics across groups, with Chronic Phase CML comprising the majority (85.1%).The principal clinical insight of this research lies in the highly significant associations observed between the primary study parameters and metabolic comorbidities, notably Hypertension (p = 0.000), Diabetes Mellitus (p = 0.000), and smoking history (p = 0.016). Consequently, therapeutic strategies for this patient population must look beyond demographic risk factors and prioritize early screening, targeted intervention, and comprehensive management of concurrent cardiovascular and metabolic conditions to improve overall long-term prognostic outcomes.
BIBLIOGRAPHY:
1. Besarab A, Hemmerich S. Iron-deficiency anemia. Management of Anemia. Clinicians. 2018;5(3):11-29.
2. Liu Z, Shi Y, Yan Z, He Z, Ding B, Tao S, et al. Impact of anemia on the outcomes of chronic phase chronic myeloid leukemia in TKI era. Hematology. 2020;25(1):181-5.
3. Jabbour E, Kantarjian H. Chronic myeloid leukemia: 2018 update on diagnosis, therapy and monitoring. Am J Hematol. 2018;93(3):442-59.
4. Hernell O, Fewtrell MS, Georgieff MK, Krebs NF, Lönnerdal B. Summary of current recommendations on iron provision and monitoring of iron status for breastfed and formula-fed infants in resource-rich and resource-constrained countries. J Pediatr. 2015;167(4):40-7.
5. Fufa B, Gutema H. Nursing and health care prevalence of anemia and associated factors among children. Int Arch Int Arch. 2019;5(129):1-5.
6. Muriuki JM, Mentzer AJ, Webb EL, Morovat A, Kimita W, Ndungu FM, et al. Estimating the burden of iron deficiency among African children. Medicine. 2020;18(1):1-4.
7. Hehlmann R. Chronic myeloid leukemia in 2020. Hemasphere. 2020;4(5):468-72.
8. Wang F, Lv H, Zhao B, Zhou L, Wang S, Luo J, et al. Iron and leukemia: new insights for future treatments. J Exp Clin Cancer Res. 2019;38(1):1-7.
9. Rinaldi I, Winston K. Chronic myeloid leukemia, from pathophysiology to treatment-free remission: a narrative literature review. J Blood Med. 2023;25(17):261-77.
10. Mohammed AH, Abdulsalam AH, Abdulbaqee AG. Types of anemia in patients with chronic myeloid leukemia‐chronic phase on imatinib mesylate. Iraqi J Comm Med. 2012;1(5):19-22.
11. Madkaikar, M., Gupta, M., & Ghosh, K. (2018). Prevalence and clinical implications of iron deficiency anemia in adult hematological conditions. Journal of Clinical Hematology, 42(3), 115–122.
12. Breccia, M., Latagliata, R., Stagno, F., Luciano, L., & Saglio, G. (2015). Cardiovascular and metabolic comorbidities in Chronic Myeloid Leukemia patients: Prevalence and impact on treatment selection. Leukemia Research, 39(10), 1050–1055. https://doi.org/10.1016/j.leukres.2015.07.004.
13. Cortes, J., & Kantarjian, H. (2012). How I treat CML in chronic phase. Blood, 120(7), 1390–1397. https://doi.org/10.1182/blood-2012-03-378497.
14. Guralnik, J. M., Eisenstaedt, R. S., Ferrucci, L., Klein, H. G., & Woodman, R. C. (2004). Prevalence of anemia in persons 65 years and older in the United States: Evidence for a high rate of unexplained anemia. Blood, 104(8), 2263–2268. https://doi.org/10.1182/blood-2004-01-0196.
15. World Health Organization. (2010). Physical status: The use and interpretation of anthropometry (WHO Technical Report Series, No. 854). World Health Organization. https://apps.who.int/iris/handle/10665/37003.
16. Apperley, J. F. (2015). Chronic myeloid leukaemia. The Lancet, 385(9976), 1447–1459. https://doi.org/10.1016/S0140-6736(13)62120-0.
17. Jabbour, E., & Kantarjian, H. (2020). Chronic myeloid leukemia: 2020 update on diagnosis, therapy, and monitoring. American Journal of Hematology, 95(6), 691–709. https://doi.org/10.1002/ajh.25792.
18. Calistri, E., & Castagnetti, F. (2021). The impact of lifestyle risk factors and smoking on cardiovascular outcomes in CML management. British Journal of Haematology, 193(2), 241–250. https://doi.org/10.1111/bjh.17211.