Perinatal outcomes in growth restricted fetuses
- Sadaf Shahzad. Indus , Obstetrics and gynecology department, Indus hospital and health network, Karachi
- sameera Ehtisham , Obstetrics and gynecology department, Indus hospital and health network, Karachi
- Tooba Abdul wahab , Obstetrics and gynecology department, Indus hospital and health network, Karachi
Article Information:
Abstract:
Objective: To determine perinatal outcomes in fetuses with intrauterine growth restriction (IUGR) Study Design: Longitudinal study. Place and Duration of Study: Department of Obstetrics and Gynecology, over six months after ethical approval. Methodology: A total of 367 pregnant women aged 18–45 years with singleton pregnancies beyond 26 weeks’ gestation diagnosed with IUGR on ultrasound biometry and umbilical artery Doppler were included using non-probability consecutive sampling. Maternal demographic characteristics, comorbidities, and perinatal outcomes were recorded. Primary outcomes included prematurity, neonatal intensive care unit (NICU) admission, and neonatal mortality. Data were analyzed using SPSS version 26, and chi-square or Fisher’s exact test was applied. A p-value ≤0.05 was considered statistically significant. Results: The majority of women were aged 25–35 years (54.0%). Prematurity occurred in 43.3% of cases, NICU admission in 50.1%, and neonatal mortality in 5.4%. The mean Apgar scores at 1 and 5 minutes were 8.13 ± 0.46 and 8.89 ± 0.39, respectively. Respiratory distress was observed in 21.0% of neonates. Prematurity showed significant association with chronic hypertension, diabetes mellitus, renal disease, pre-eclampsia, and autoimmune disorders. NICU admission was significantly associated with BMI, chronic hypertension, renal disease, PIH, pre-eclampsia, and early pregnancy bleeding. Neonatal mortality was significantly associated with diabetes mellitus and other complications. Conclusion: IUGR is associated with significant adverse perinatal outcomes, particularly prematurity and NICU admission. Maternal comorbidities play a key role in poor neonatal outcomes. Early antenatal identification and timely intervention are essential to improve perinatal survival.
Keywords:
Article :
INTRODUCTION :
Intrauterine growth restriction (IUGR) refers to the failure of a fetus to achieve its genetically determined growth potential due to pathological conditions. It complicates approximately 3–9% of pregnancies in developed countries, with a substantially higher burden reported in developing countries.1 IUGR should be distinguished from small for gestational age (SGA), which describes a fetus with an estimated fetal weight below the 10th percentile or below −2 standard deviations for gestational age without necessarily indicating an underlying pathological process.2,3 Antenatal identification of fetal growth restriction relies on clinical assessment, serial ultrasonography, and Doppler velocimetry. The Doppler parameters include PI(pulsatility index), RI(resistive index) and systolic-to-diastolic (S/D) ratio. Among Doppler parameters, the umbilical artery systolic-to-diastolic (S/D) ratio is an important indicator of placental vascular resistance; an increased S/D ratio reflects impaired placental perfusion and is associated with adverse perinatal outcomes.2
Adequate placental perfusion is essential for normal fetal growth. Abnormal placentation and impaired development of the placental villous tree can increase vascular resistance and compromise maternal–fetal exchange, resulting in fetal growth restriction.3 Several maternal factors are associated with IUGR, including hypertensive disorders of pregnancy, diabetes mellitus, advanced maternal age, low maternal body mass index, inadequate maternal nutrition, and a previous history of an IUGR.4–7 Maternal nutritional deficiency is particularly important in low-resource settings because it is potentially modifiable and may coexist with other socioeconomic and obstetric risk factors.
Fetuses with IUGR are at increased risk of adverse perinatal outcomes, including stillbirth, preterm birth, neonatal hypoglycaemia, hypothermia, jaundice, respiratory distress syndrome, intraventricular haemorrhage, necrotising enterocolitis, and neonatal death.5Perinatal asphyxia is a frequent complication among growth-restricted fetuses.6 there has been reported an approximately two-fold increase in mortality among fetuses with growth restriction.7 Abnormal umbilical artery Doppler indices, particularly an S/D ratio >3, have also been associated with increased respiratory morbidity, low Apgar scores, and neonatal mortality.8,9 Similarly, previous studies have demonstrated higher rates of neonatal intensive care unit (NICU) admission, metabolic acidosis, and perinatal mortality among SGA/IUGR fetuses compared with appropriately grown fetuses.10,11
Despite advances in antenatal surveillance, the identification of fetuses at greatest risk of adverse neonatal outcomes remains challenging, particularly in resource-constrained settings where maternal malnutrition and other risk factors for placental insufficiency are prevalent. Assessment of umbilical artery Doppler may provide an important tool for risk stratification and timely obstetric intervention. However, data regarding the relationship between antenatal Doppler abnormalities and specific perinatal outcomes remain limited in our setting.
Therefore, this study was conducted to determine the perinatal outcomes of fetuses diagnosed antenatally with IUGR using ultrasonography and Doppler studies and to evaluate the prognostic value of the umbilical artery Doppler S/D ratio in predicting adverse neonatal outcomes.
Methodology::
This longitudinal observational study was conducted in the Department of Obstetrics and Gynecology at Indus Hospital and health Network (IHHN), over a period of six months following approval from the Institutional Review Board (IRB) of IHHN.
A total of 367 pregnant women with antenatally diagnosed intrauterine growth restriction (IUGR) were enrolled through non-probability consecutive sampling. The sample size was calculated using OpenEpi software, based on an anticipated frequency of low birth weight among growth-restricted fetuses of 39.22%,11 with a 95% confidence level and a 5% margin of error.
Women aged 18–45 years with singleton pregnancies beyond 26 weeks of gestation were eligible for inclusion. IUGR was diagnosed on clinical assessment of symphsio-fundal height and the ultrasound fetal biometry showing an estimated fetal weight (EFW) below the 10th percentile for gestational age along with abnormal umbilical artery Doppler findings suggestive of placental insufficiency or less than 3 centile without Doppler change. Women with appropriately grown fetuses, multiple pregnancies, or fetuses with congenital anomalies were excluded.
Following enrolment, demographic and obstetric characteristics, including maternal age, body mass index (BMI), parity, socioeconomic status, and relevant maternal comorbidities, were recorded on a structured data collection proforma. All participants underwent detailed obstetric ultrasonography for fetal biometry and assessment of amniotic fluid, along with umbilical artery Doppler velocimetry. The Doppler findings were recorded according to the study protocol. Participants were followed prospectively until delivery and through the immediate neonatal period.
The primary outcome measures were prematurity, neonatal intensive care unit (NICU) admission, and neonatal mortality. Prematurity was defined as delivery before 37 completed weeks of gestation which is further classified as very preterm (28 to less than 32 weeks) moderate preterm (28 to less than 34 weeks) and late preterm (34 to less than 37 weeks) while neonatal mortality was defined as death occurring during first 28days of life (neonatal period) before hospital discharge. Secondary outcomes included mode of delivery, birth weight, respiratory distress syndrome, and Apgar scores at 1 and 5 minutes after birth.
Statistical analysis
Data were entered and analysed using the Statistical Package for Social Sciences (SPSS), version 26. Quantitative variables, including maternal age, monthly household income, birth weight, gestational age at delivery, and Apgar scores, were expressed as mean ± standard deviation, while categorical variables were presented as frequencies and percentages. The 95% confidence intervals (CIs) were calculated for the major perinatal outcomes.
Univariate analysis was performed to assess the association of maternal, obstetric, and Doppler characteristics with the primary outcomes, including prematurity, NICU admission, and neonatal mortality. Associations between categorical variables were assessed using the chi-square test or Fisher's exact test, as appropriate. A p-value ≤0.05 was considered statistically significant.
Results :
A total of 367 participants were included in the study. The majority of mothers were aged 26–35 years (198, 54.0%), followed by 18–25 years (140, 38.1%), while 23 (6.3%) were aged 36–40 years and 6 (1.6%) were older than 40 years. Regarding BMI, 155 (42.2%) participants had normal BMI, 118 (32.2%) were overweight, 86 (23.4%) were obese, and 8 (2.2%) were underweight. A previous history of low birth weight was present in 37 (10.2%) participants. Among maternal comorbidities, diabetes mellitus was the most frequent (130, 35.6%), followed by pregnancy-induced hypertension (51, 13.9%), pre-eclampsia (44, 12.1%), chronic hypertension (33, 9.1%), thyroid disease (10, 2.7%), renal disease (6, 1.6%), autoimmune disorders (6, 1.6%), bleeding in early pregnancy (5, 1.4%) and other less frequent conditions. Caesarean section was the predominant mode of delivery (259, 71.5%), followed by spontaneous vaginal delivery (101, 27.9%). (Table 1)
Among the neonatal outcomes, 146 (40.6%) neonates were premature, while 214 (59.4%) were at term. A low APGAR score was documented in 14 (3.8%) neonates, whereas 350 (96.2%) had normal APGAR score. Respiratory distress was observed in 92 (25.3%) neonates, and 162 (44.5%) required NICU admission. Low birth weight was observed in 341 (92.9%) neonates, while 26 (7.1%) had a birth weight of ≥2500 g. The mean APGAR score was 8.02 ± 0.91 at one minute and 8.88 ± 0.59 at five minutes. The median birth weight was 2200 g (IQR 1900–2300), The median estimated fetal weight was 1979.5 g (IQR 1700–2262.25), while the median liquor/AFI was 11 cm (IQR 10–13.3). (Table 2; Figure 1)
Comparison of maternal characteristics across perinatal outcomes showed that maternal age was not significantly associated with prematurity, low APGAR score, respiratory distress, NICU admission or birth weight category (all p>0.05). BMI was significantly associated with respiratory distress (p=0.005) and NICU admission (p=0.004), although no significant association was observed with prematurity, low APGAR score or birth weight. A previous history of low birth weight was significantly associated with prematurity (p=0.035), but not with the other assessed outcomes. Diabetes mellitus was significantly associated with prematurity (p=0.003), whereas its associations with low APGAR score, respiratory distress, NICU admission and birth weight were not statistically significant. (Table 3)
Renal disease was significantly associated with prematurity (p=0.043) and NICU admission (p=0.007), while autoimmune disorders were significantly associated with prematurity (p=0.043). Pregnancy-induced hypertension was significantly associated with respiratory distress (p=0.002) and NICU admission (p<0.001), whereas pre-eclampsia was significantly associated with prematurity (p=0.002), respiratory distress (p=0.003), and NICU admission (p<0.001). There was significant association between mode of delivery, prematurity (p<0.001), respiratory distress (p=0.009), and NICU admission (p=0.003). (Table 3)
Parity was significantly associated with poor perinatal outcomes including respiratory distress (p=0.014) and NICU admission (p=0.026), and the number of previous births was significantly associated with respiratory distress (p=0.018) and NICU admission (p=0.031). femur length and head circumference were significantly lower among premature neonates, those with respiratory distress, those requiring NICU admission, and neonates with lower birth weight (all relevant p<0.001). Abdominal circumference and estimated fetal weight also showed significant differences across several adverse perinatal outcomes. The liquor/AFI differed significantly according to prematurity (p=0.033), respiratory distress (p=0.024), and birth weight category (p<0.001). The umbilical artery S/D ratio was significantly associated with prematurity, respiratory distress, and NICU admission (all p<0.001). (Table 3)
Overall, the analysis demonstrated that several maternal and fetal factors, particularly BMI, previous low birth weight, diabetes mellitus, renal disease, autoimmune disorders, pregnancy-induced hypertension, pre-eclampsia, mode of delivery, and IUGR, were associated with one or more adverse perinatal outcomes. Among the neonatal and fetal measurements, anthropometric parameters, estimated fetal weight, liquor/AFI, and umbilical artery Doppler indices also demonstrated significant associations with selected outcomes. (Table 3)
Table 1. Clinical Characteristics of the Participants (N=367)
|
Variable / category |
n |
% |
|
Maternal age group (years) |
|
|
|
18 to 25 |
140 |
38.1 |
|
26 to35 |
198 |
54.0 |
|
36 to 40 |
23 |
6.3 |
|
> 40 |
6 |
1.6 |
|
BMI category (kg/m²) |
|
|
|
< 18.5 (underweight) |
8 |
2.2 |
|
18.5-24.9 (Normal) |
155 |
42.2 |
|
25-29.9 (Overweight) |
118 |
32.2 |
|
=/>30 (Obesity) |
86 |
23.4 |
|
Previous history of low birthweight |
|
|
|
No |
327 |
89.8 |
|
Yes |
37 |
10.2 |
|
Any Comorbidities |
|
|
|
Chronic hypertension |
33 |
9.1 |
|
Diabetes mellitus |
130 |
35.6 |
|
Renal disease |
6 |
1.6 |
|
Autoimmune disorders (APS/SLE) |
6 |
1.6 |
|
Bleeding in early pregnancy |
5 |
1.4 |
|
Thyroid disease |
10 |
2.7 |
|
Pregnancy-induced hypertension |
51 |
13.9 |
|
Pre-eclampsia |
44 |
12.1 |
|
Antepartum hemorrhage |
4 |
1.1 |
|
Mode of delivery |
|
|
|
LSCS |
259 |
71.5 |
|
SVD |
101 |
27.9 |
|
IVD |
2 |
0.6 |
|
Status at birth |
|
|
|
Alive |
365 |
99.7 |
|
Stillbirth |
1 |
0.3 |
|
Fetal gender |
|
|
|
Male |
168 |
46.0 |
|
Female |
197 |
54.0 |
|
Neonatal outcome |
|
|
|
Discharged |
349 |
95.9 |
|
Expired |
7 |
1.9 |
|
Referred |
8 |
2.2 |
|
Birth weight category |
|
|
|
less than 2500 g |
341 |
92.9 |
|
greater than 2500 g |
26 |
7.1 |
|
Monthly income category (PKR) |
|
|
|
Low (≤ 35,000) |
110 |
30.4 |
|
Middle (35,001–75,000) |
228 |
63.0 |
|
High (> 75,000) |
24 |
6.6 |
|
Prematurity |
|
|
|
No |
214 |
59.4 |
|
Yes |
146 |
40.6 |
|
Low APGAR |
|
|
|
Yes |
14 |
3.8 |
|
No |
350 |
96.2 |
|
Respiratory distress |
|
|
|
No |
271 |
74.7 |
|
Yes |
92 |
25.3 |
|
NICU admission |
|
|
|
No |
202 |
55.5 |
|
Yes |
162 |
44.5 |
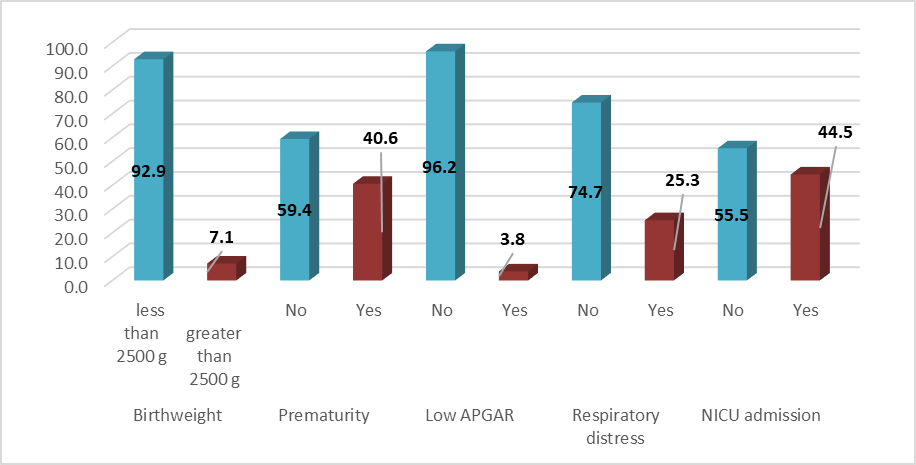
Figure 1. Perinatal outcomes
Table#2: Perinatal, Anthropometric and Doppler Characteristics of the Study Participants
|
Variable |
Mean ± SD |
Median (IQR) |
|
APGAR score at 1 min |
8.02 ± 0.91 |
8 (8–8) |
|
APGAR score at 5 min |
8.88 ± 0.59 |
9 (9–9) |
|
Birth length (cm) |
51.42 ± 113.61 |
46 (44–48) |
|
Head circumference (cm) |
32.18 ± 2.34 |
32 (31–33) |
|
Birth weight (g) |
2105.4 ± 383.61 |
2200 (1900–2300) |
|
Abdominal circumference (cm) |
27.63 ± 2.4 |
27.9 (26.1–29.2) |
|
Estimated fetal weight (g) |
1978.37 ± 448.69 |
1979.5 (1700–2262.25) |
|
Liquor / AFI (cm) |
11.65 ± 3.01 |
11 (10–13.3) |
|
Gestational age at Doppler (weeks) |
33.09 ± 2.08 |
33 (31.54–34.57) |
|
Umbilical artery S/D ratio |
3.26 ± 0.32 |
3.2 (3.1–3.3) |
|
Number of family members |
4.31 ± 2.1 |
4 (3–5) |
|
Number of earning members |
1.16 ± 0.58 |
1 (1–1) |
|
Number of births (parity) |
1.1 ± 1.27 |
1 (0–2) |
|
Number of miscarriages |
0.4 ± 0.81 |
0 (0–1) |
Table#3: Association of Maternal and Fetal Factors with Perinatal Outcomes
|
Factors |
Category |
Perinatal Outcomes
|
|||||||||||||||
|
Prematurity |
Low APGAR Score |
Respiratory Distress |
NICU Admission |
Birth Weight |
|||||||||||||
|
No |
Yes |
p-value |
Yes |
No |
p-value |
No |
Yes |
p-value |
No |
Yes |
p-value |
< 2500 g |
>2500 g |
p-value |
|
||
|
Maternal age group (years) |
|
|
|
0.261 ‡ |
|
|
0.333 ‡ |
|
|
0.506 ‡ |
|
|
0.549 ‡ |
|
|
0.225 ‡ |
|
|
18 to 25 |
87 (40.7) |
46 (31.5) |
|
6 (42.9) |
133 (38.0) |
|
106 (39.1) |
33 (35.9) |
|
81 (40.1) |
57 (35.2) |
|
127 (37.2) |
13 (50.0) |
|
|
|
|
26 to35 |
113 (52.8) |
85 (58.2) |
|
7 (50.0) |
190 (54.3) |
|
146 (53.9) |
50 (54.3) |
|
108 (53.5) |
89 (54.9) |
|
188 (55.1) |
10 (38.5) |
|
|
|
|
36 to 40 |
11 (5.1) |
12 (8.2) |
|
0 (0.0) |
22 (6.3) |
|
16 (5.9) |
6 (6.5) |
|
10 (5.0) |
13 (8.0) |
|
20 (5.9) |
3 (11.5) |
|
|
|
|
> 40 |
3 (1.4) |
3 (2.1) |
|
1 (7.1) |
5 (1.4) |
|
3 (1.1) |
3 (3.3) |
|
3 (1.5) |
3 (1.9) |
|
6 (1.8) |
0 (0.0) |
|
|
|
|
BMI category (kg/m²) |
|
|
|
0.296 ‡ |
|
|
0.376 ‡ |
|
|
0.005** † |
|
|
0.004** ‡ |
|
|
0.057 † |
|
|
< 18.5 (underweight) |
3 (1.4) |
5 (3.4) |
|
1 (7.1) |
7 (2.0) |
|
2 (0.7) |
6 (6.5) |
|
0 (0.0) |
8 (4.9) |
|
8 (2.3) |
0 (0.0) |
|
|
|
|
18.5-24.9 (Normal) |
97 (45.3) |
54 (37.0) |
|
7 (50.0) |
146 (41.7) |
|
119 (43.9) |
34 (37.0) |
|
90 (44.6) |
63 (38.9) |
|
150 (44.0) |
5 (19.2) |
|
|
|
|
25-29.9 (Overweight) |
65 (30.4) |
50 (34.2) |
|
3 (21.4) |
114 (32.6) |
|
91 (33.6) |
26 (28.3) |
|
69 (34.2) |
48 (29.6) |
|
105 (30.8) |
13 (50.0) |
|
|
|
|
|
49 (22.9) |
37 (25.3) |
|
3 (21.4) |
83 (23.7) |
|
59 (21.8) |
26 (28.3) |
|
43 (21.3) |
43 (26.5) |
|
78 (22.9) |
8 (30.8) |
|
|
|
|
Monthly income category |
|
|
|
0.503 † |
|
|
0.390 ‡ |
|
|
0.561 † |
|
|
0.394 † |
|
|
0.534 † |
|
|
Low (≤35k) |
64 (30.2) |
43 (30.1) |
|
2 (15.4) |
106 (30.6) |
|
78 (29.0) |
29 (32.6) |
|
56 (28.0) |
52 (32.7) |
|
103 (30.6) |
7 (28.0) |
|
|
|
|
Middle (35–75k) |
131 (61.8) |
93 (65.0) |
|
11 (84.6) |
216 (62.4) |
|
171 (63.6) |
56 (62.9) |
|
128 (64.0) |
99 (62.3) |
|
213 (63.2) |
15 (60.0) |
|
|
|
|
High (>75k) |
17 (8.0) |
7 (4.9) |
|
0 (0.0) |
24 (6.9) |
|
20 (7.4) |
4 (4.5) |
|
16 (8.0) |
8 (5.0) |
|
21 (6.2) |
3 (12.0) |
|
|
|
|
Previous history of low birthweight |
|
|
|
0.035* † |
|
|
0.639 ‡ |
|
|
0.716 † |
|
|
0.163 † |
|
|
0.320 ‡ |
|
|
No |
196 (92.5) |
124 (85.5) |
|
12 (85.7) |
313 (90.2) |
|
243 (90.3) |
81 (89.0) |
|
184 (92.0) |
141 (87.6) |
|
305 (90.2) |
22 (84.6) |
|
|
|
|
Yes |
16 (7.5) |
21 (14.5) |
|
2 (14.3) |
34 (9.8) |
|
26 (9.7) |
10 (11.0) |
|
16 (8.0) |
20 (12.4) |
|
33 (9.8) |
4 (15.4) |
|
|
|
|
Chronic hypertension |
|
|
|
0.055 † |
|
|
0.628 ‡ |
|
|
0.093 † |
|
|
0.158 † |
|
|
0.005** ‡ |
|
|
Yes |
14 (6.6) |
18 (12.6) |
|
0 (0.0) |
33 (9.6) |
|
20 (7.5) |
12 (13.3) |
|
14 (7.0) |
18 (11.3) |
|
26 (7.8) |
7 (26.9) |
|
|
|
|
No |
197 (93.4) |
125 (87.4) |
|
14 (100.0) |
311 (90.4) |
|
247 (92.5) |
78 (86.7) |
|
185 (93.0) |
141 (88.7) |
|
309 (92.2) |
19 (73.1) |
|
|
|
|
Diabetes mellitus |
|
|
|
0.003** † |
|
|
0.559 † |
|
|
0.776 † |
|
|
0.969 † |
|
|
0.753 † |
|
|
Yes |
63 (29.7) |
66 (45.2) |
|
4 (28.6) |
126 (36.2) |
|
98 (36.4) |
32 (34.8) |
|
72 (36.0) |
58 (35.8) |
|
120 (35.4) |
10 (38.5) |
|
|
|
|
No |
149 (70.3) |
80 (54.8) |
|
10 (71.4) |
222 (63.8) |
|
171 (63.6) |
60 (65.2) |
|
128 (64.0) |
104 (64.2) |
|
219 (64.6) |
16 (61.5) |
|
|
|
|
Renal disease |
|
|
|
0.043* ‡ |
|
|
0.213 ‡ |
|
|
0.645 ‡ |
|
|
0.007** ‡ |
|
|
1.000 ‡ |
|
|
Yes |
1 (0.5) |
5 (3.4) |
|
1 (7.1) |
5 (1.4) |
|
4 (1.5) |
2 (2.2) |
|
0 (0.0) |
6 (3.7) |
|
6 (1.8) |
0 (0.0) |
|
|
|
|
No |
211 (99.5) |
141 (96.6) |
|
13 (92.9) |
342 (98.6) |
|
265 (98.5) |
89 (97.8) |
|
200 (100.0) |
155 (96.3) |
|
332 (98.2) |
26 (100.0) |
|
|
|
|
Autoimmune disorders (APS/SLE) |
|
|
|
0.043* ‡ |
|
|
0.212 ‡ |
|
|
0.646 ‡ |
|
|
1.000 ‡ |
|
|
1.000 ‡ |
|
|
Yes |
1 (0.5) |
5 (3.4) |
|
1 (7.1) |
5 (1.4) |
|
4 (1.5) |
2 (2.2) |
|
3 (1.5) |
3 (1.9) |
|
6 (1.8) |
0 (0.0) |
|
|
|
|
No |
212 (99.5) |
141 (96.6) |
|
13 (92.9) |
344 (98.6) |
|
266 (98.5) |
90 (97.8) |
|
198 (98.5) |
159 (98.1) |
|
334 (98.2) |
26 (100.0) |
|
|
|
|
Bleeding in early pregnancy |
|
|
|
0.162 ‡ |
|
|
0.179 ‡ |
|
|
0.603 ‡ |
|
|
1.000 ‡ |
|
|
1.000 ‡ |
|
|
Yes |
1 (0.5) |
4 (2.8) |
|
1 (7.1) |
4 (1.1) |
|
3 (1.1) |
2 (2.2) |
|
3 (1.5) |
2 (1.2) |
|
5 (1.5) |
0 (0.0) |
|
|
|
|
No |
213 (99.5) |
141 (97.2) |
|
13 (92.9) |
345 (98.9) |
|
268 (98.9) |
89 (97.8) |
|
199 (98.5) |
159 (98.8) |
|
335 (98.5) |
26 (100.0) |
|
|
|
|
Thyroid disease |
|
|
|
0.534 ‡ |
|
|
1.000 ‡ |
|
|
0.719 ‡ |
|
|
0.757 ‡ |
|
|
1.000 ‡ |
|
|
Yes |
5 (2.3) |
5 (3.4) |
|
0 (0.0) |
10 (2.9) |
|
7 (2.6) |
3 (3.3) |
|
5 (2.5) |
5 (3.1) |
|
10 (2.9) |
0 (0.0) |
|
|
|
|
No |
208 (97.7) |
140 (96.6) |
|
14 (100.0) |
338 (97.1) |
|
262 (97.4) |
89 (96.7) |
|
195 (97.5) |
157 (96.9) |
|
331 (97.1) |
24 (100.0) |
|
|
|
|
Pregnancy-induced hypertension |
|
|
|
0.057 † |
|
|
0.118 ‡ |
|
|
0.002** † |
|
|
<0.001*** † |
|
|
1.000 ‡ |
|
|
Yes |
23 (10.8) |
26 (17.8) |
|
4 (28.6) |
47 (13.5) |
|
29 (10.7) |
22 (23.9) |
|
17 (8.5) |
34 (21.0) |
|
48 (14.1) |
3 (11.5) |
|
|
|
|
No |
190 (89.2) |
120 (82.2) |
|
10 (71.4) |
302 (86.5) |
|
241 (89.3) |
70 (76.1) |
|
184 (91.5) |
128 (79.0) |
|
292 (85.9) |
23 (88.5) |
|
|
|
|
Pre-eclampsia |
|
|
|
0.002** † |
|
|
0.392 ‡ |
|
|
0.003** † |
|
|
<0.001*** † |
|
|
0.536 ‡ |
|
|
Yes |
16 (7.5) |
26 (18.1) |
|
3 (21.4) |
41 (11.8) |
|
25 (9.2) |
19 (21.1) |
|
14 (6.9) |
30 (18.8) |
|
40 (11.8) |
4 (15.4) |
|
|
|
|
No |
198 (92.5) |
118 (81.9) |
|
11 (78.6) |
307 (88.2) |
|
246 (90.8) |
71 (78.9) |
|
188 (93.1) |
130 (81.2) |
|
299 (88.2) |
22 (84.6) |
|
|
|
|
Antepartum hemorrhage |
|
|
|
0.309 ‡ |
|
|
1.000 ‡ |
|
|
1.000 ‡ |
|
|
1.000 ‡ |
|
|
0.249 ‡ |
|
|
Yes |
1 (0.5) |
3 (2.1) |
|
0 (0.0) |
4 (1.2) |
|
3 (1.1) |
1 (1.1) |
|
2 (1.0) |
2 (1.2) |
|
3 (0.9) |
1 (4.0) |
|
|
|
|
No |
211 (99.5) |
143 (97.9) |
|
14 (100.0) |
343 (98.8) |
|
265 (98.9) |
91 (98.9) |
|
197 (99.0) |
160 (98.8) |
|
336 (99.1) |
24 (96.0) |
|
|
|
|
Mode of delivery |
|
|
|
<0.001*** ‡ |
|
|
0.763 ‡ |
|
|
0.009** ‡ |
|
|
0.003** ‡ |
|
|
0.703 ‡ |
|
|
LSCS |
133 (62.7) |
123 (86.0) |
|
8 (66.7) |
248 (71.5) |
|
183 (68.3) |
74 (82.2) |
|
130 (65.3) |
128 (80.0) |
|
239 (71.1) |
20 (76.9) |
|
|
|
|
SVD |
77 (36.3) |
20 (14.0) |
|
4 (33.3) |
97 (28.0) |
|
84 (31.3) |
15 (16.7) |
|
68 (34.2) |
31 (19.4) |
|
95 (28.3) |
6 (23.1) |
|
|
|
|
IVD |
2 (0.9) |
0 (0.0) |
|
0 (0.0) |
2 (0.6) |
|
1 (0.4) |
1 (1.1) |
|
1 (0.5) |
1 (0.6) |
|
2 (0.6) |
0 (0.0) |
|
|
|
|
Status at birth |
|
|
|
0.407 ‡ |
|
|
0.039* ‡ |
|
|
1.000 ‡ |
|
|
1.000 ‡ |
|
|
1.000 ‡ |
|
|
Alive |
213 (100.0) |
145 (99.3) |
|
13 (92.9) |
349 (100.0) |
|
269 (99.6) |
92 (100.0) |
|
200 (99.5) |
162 (100.0) |
|
339 (99.7) |
26 (100.0) |
|
|
|
|
Stillbirth |
0 (0.0) |
1 (0.7) |
|
1 (7.1) |
0 (0.0) |
|
1 (0.4) |
0 (0.0) |
|
1 (0.5) |
0 (0.0) |
|
1 (0.3) |
0 (0.0) |
|
|
|
|
Fetal gender |
|
|
|
0.024* † |
|
|
0.983 † |
|
|
0.004** † |
|
|
0.003** † |
|
|
0.673 † |
|
|
Male |
88 (41.3) |
78 (53.4) |
|
6 (46.2) |
160 (45.8) |
|
111 (41.3) |
54 (58.7) |
|
78 (38.8) |
88 (54.7) |
|
155 (45.7) |
13 (50.0) |
|
|
|
|
Female |
125 (58.7) |
68 (46.6) |
|
7 (53.8) |
189 (54.2) |
|
158 (58.7) |
38 (41.3) |
|
123 (61.2) |
73 (45.3) |
|
184 (54.3) |
13 (50.0) |
|
|
|
|
SGA classification |
|
|
|
0.433 † |
|
|
1.000 ‡ |
|
|
0.165 † |
|
|
0.671 † |
|
|
0.492 ‡ |
|
|
Not SGA (>=10th) |
197 (92.1) |
130 (89.7) |
|
13 (92.9) |
316 (90.5) |
|
248 (91.9) |
80 (87.0) |
|
181 (90.0) |
148 (91.4) |
|
307 (90.3) |
25 (96.2) |
|
|
|
|
SGA (<10th) |
17 (7.9) |
15 (10.3) |
|
1 (7.1) |
33 (9.5) |
|
22 (8.1) |
12 (13.0) |
|
20 (10.0) |
14 (8.6) |
|
33 (9.7) |
1 (3.8) |
|
|
|
|
IUGR classification |
|
|
|
0.364 ‡ |
|
|
0.430 ‡ |
|
|
0.044* ‡ |
|
|
0.764 ‡ |
|
|
0.639 ‡ |
|
|
IUGR (<10th) |
0 (0.0) |
1 (0.7) |
|
0 (0.0) |
1 (0.3) |
|
0 (0.0) |
1 (1.1) |
|
0 (0.0) |
1 (0.6) |
|
1 (0.3) |
0 (0.0) |
|
|
|
|
No IUGR (>=10th) |
208 (97.2) |
137 (95.1) |
|
13 (92.9) |
335 (96.3) |
|
262 (97.4) |
85 (92.4) |
|
194 (96.5) |
154 (95.7) |
|
325 (95.9) |
26 (100.0) |
|
|
|
|
Severe IUGR (<3rd) |
6 (2.8) |
6 (4.2) |
|
1 (7.1) |
12 (3.4) |
|
7 (2.6) |
6 (6.5) |
|
7 (3.5) |
6 (3.7) |
|
13 (3.8) |
0 (0.0) |
|
|
|
|
Variable |
Prematurity |
Low APGAR |
Respiratory distress |
NICU admission |
Birth weight |
|||||||||||
|
No (n=203) |
Yes (n=100) |
p-value |
Yes (n=10) |
No (n=296) |
p-value |
No (n=242) |
Yes (n=62) |
p-value |
No (n=185) |
Yes (n=120) |
p-value |
<2500 g (n=285) |
≥2500 g (n=23) |
p-value |
||
|
Number of family members |
4 (3–5) |
4 (3–5) |
0.738 |
3 (3–4.5) |
4 (3–5) |
0.293 |
4 (3–5) |
4 (3–5) |
0.073 |
4 (3–5) |
4 (3–5) |
0.083 |
4 (3–5) |
5 (3–7.25) |
0.045* |
|
|
Number of earning members |
1 (1–1) |
1 (1–1) |
0.877 |
1 (1–1) |
1 (1–1) |
0.299 |
1 (1–1) |
1 (1–1) |
0.383 |
1 (1–1) |
1 (1–1) |
0.848 |
1 (1–1) |
1 (1–2) |
0.004** |
|
|
Parity |
1 (0–2) |
1 (0–2) |
0.065 |
1 (0–1.5) |
1 (0–2) |
0.336 |
1 (0–2) |
0 (0–1.25) |
0.014* |
1 (0–2) |
1 (0–2) |
0.026* |
1 (0–2) |
0.5 (0–3) |
0.813 |
|
|
Number of previous births |
1 (0–2) |
1 (0–2) |
0.084 |
1 (0–1.5) |
1 (0–2) |
0.356 |
1 (0–2) |
0 (0–1.25) |
0.018* |
1 (0–2) |
1 (0–2) |
0.031* |
1 (0–2) |
0.5 (0–3) |
0.779 |
|
|
Number of miscarriages |
0 (0–1) |
0 (0–1) |
0.136 |
0 (0–0.5) |
0 (0–1) |
0.514 |
0 (0–1) |
0 (0–1) |
0.320 |
0 (0–1) |
0 (0–1) |
0.836 |
0 (0–1) |
0 (0–1) |
0.692 |
|
|
Birth length (cm) |
47 (45–48) |
45 (43–47) |
<0.001*** |
46 (44.5–47) |
46 (45–48) |
0.135 |
47 (45–48) |
45 (42–47) |
<0.001*** |
47 (45–48) |
46 (43–47.5) |
<0.001*** |
46 (44–48) |
48 (46–50) |
<0.001*** |
|
|
Head circumference (cm) |
33 (32–34) |
32 (31–33) |
<0.001*** |
32.5 (31–33.25) |
32 (31–33) |
0.399 |
33 (32–33) |
31 (30.38–32.62) |
<0.001*** |
33 (32–33) |
32 (31–33) |
<0.001*** |
32 (31–33) |
34 (33–35) |
<0.001*** |
|
|
Abdominal circumference (cm) |
28 (27–29.43) |
27.4 (26.07–28.25) |
0.002** |
27 (26.45–30.4) |
28 (26.8–29.2) |
0.917 |
28 (26.9–29.32) |
27.05 (26.07–28.62) |
0.033* |
28 (26.9–29.3) |
27.6 (26.15–29.1) |
0.040* |
28 (26.8–29.02) |
29.15 (27.23–30.82) |
0.013* |
|
|
Estimated fetal weight (g) |
2100 (1765–2360.5) |
1897.5 (1699.25–2157.25) |
0.002** |
1731 (1332–2415.5) |
2000 (1754–2297) |
0.338 |
2029.5 (1758.25–2325.25) |
1874 (1654.5–2211) |
0.029* |
2086 (1766–2335) |
1900 (1666.5–2250.5) |
0.006** |
2000 (1737.75–2262.25) |
2235 (1794–2519.5) |
0.024* |
|
|
Liquor/AFI (cm) |
11.15 (10.3–13.82) |
11 (10–13) |
0.033* |
10 (10–12.5) |
11 (10–13.6) |
0.260 |
11 (10.28–13.82) |
11 (10–12.78) |
0.024* |
11 (10–13.8) |
11 (10–13.35) |
0.778 |
11 (10–13.3) |
13.45 (11.47–15.07) |
<0.001*** |
|
|
Umbilical S/D ratio |
3.2 (3.1–3.23) |
3.2 (3.2–3.4) |
<0.001*** |
3.2 (3.15–3.3) |
3.2 (3.1–3.3) |
0.905 |
3.2 (3.1–3.3) |
3.3 (3.2–3.4) |
<0.001*** |
3.2 (3.1–3.3) |
3.2 (3.2–3.4) |
<0.001*** |
3.2 (3.1–3.3) |
3.2 (3.2–3.4) |
0.213 |
|
Table 3. Comparison of maternal and fetal factors across perinatal outcomes
|
Variable |
Prematurity |
Low APGAR |
Respiratory distress |
NICU admission |
Birth weight |
||||||||||
|
No (n=203) |
Yes (n=100) |
p-value |
Yes (n=10) |
No (n=296) |
p-value |
No (n=242) |
Yes (n=62) |
p-value |
No (n=185) |
Yes (n=120) |
p-value |
<2500 g (n=285) |
≥2500 g (n=23) |
p-value |
|
|
Number of family members |
4 (3–5) |
4 (3–5) |
0.738 |
3 (3–4.5) |
4 (3–5) |
0.293 |
4 (3–5) |
4 (3–5) |
0.073 |
4 (3–5) |
4 (3–5) |
0.083 |
4 (3–5) |
5 (3–7.25) |
0.045* |
|
Number of earning members |
1 (1–1) |
1 (1–1) |
0.877 |
1 (1–1) |
1 (1–1) |
0.299 |
1 (1–1) |
1 (1–1) |
0.383 |
1 (1–1) |
1 (1–1) |
0.848 |
1 (1–1) |
1 (1–2) |
0.004** |
|
Parity |
1 (0–2) |
1 (0–2) |
0.065 |
1 (0–1.5) |
1 (0–2) |
0.336 |
1 (0–2) |
0 (0–1.25) |
0.014* |
1 (0–2) |
1 (0–2) |
0.026* |
1 (0–2) |
0.5 (0–3) |
0.813 |
|
Number of previous births |
1 (0–2) |
1 (0–2) |
0.084 |
1 (0–1.5) |
1 (0–2) |
0.356 |
1 (0–2) |
0 (0–1.25) |
0.018* |
1 (0–2) |
1 (0–2) |
0.031* |
1 (0–2) |
0.5 (0–3) |
0.779 |
|
Number of miscarriages |
0 (0–1) |
0 (0–1) |
0.136 |
0 (0–0.5) |
0 (0–1) |
0.514 |
0 (0–1) |
0 (0–1) |
0.320 |
0 (0–1) |
0 (0–1) |
0.836 |
0 (0–1) |
0 (0–1) |
0.692 |
|
Birth length (cm) |
47 (45–48) |
45 (43–47) |
<0.001*** |
46 (44.5–47) |
46 (45–48) |
0.135 |
47 (45–48) |
45 (42–47) |
<0.001*** |
47 (45–48) |
46 (43–47.5) |
<0.001*** |
46 (44–48) |
48 (46–50) |
<0.001*** |
|
Head circumference (cm) |
33 (32–34) |
32 (31–33) |
<0.001*** |
32.5 (31–33.25) |
32 (31–33) |
0.399 |
33 (32–33) |
31 (30.38–32.62) |
<0.001*** |
33 (32–33) |
32 (31–33) |
<0.001*** |
32 (31–33) |
34 (33–35) |
<0.001*** |
|
Abdominal circumference (cm) |
28 (27–29.43) |
27.4 (26.07–28.25) |
0.002** |
27 (26.45–30.4) |
28 (26.8–29.2) |
0.917 |
28 (26.9–29.32) |
27.05 (26.07–28.62) |
0.033* |
28 (26.9–29.3) |
27.6 (26.15–29.1) |
0.040* |
28 (26.8–29.02) |
29.15 (27.23–30.82) |
0.013* |
|
Estimated fetal weight (g) |
2100 (1765–2360.5) |
1897.5 (1699.25–2157.25) |
0.002** |
1731 (1332–2415.5) |
2000 (1754–2297) |
0.338 |
2029.5 (1758.25–2325.25) |
1874 (1654.5–2211) |
0.029* |
2086 (1766–2335) |
1900 (1666.5–2250.5) |
0.006** |
2000 (1737.75–2262.25) |
2235 (1794–2519.5) |
0.024* |
|
Liquor/AFI (cm) |
11.15 (10.3–13.82) |
11 (10–13) |
0.033* |
10 (10–12.5) |
11 (10–13.6) |
0.260 |
11 (10.28–13.82) |
11 (10–12.78) |
0.024* |
11 (10–13.8) |
11 (10–13.35) |
0.778 |
11 (10–13.3) |
13.45 (11.47–15.07) |
<0.001*** |
|
Umbilical S/D ratio |
3.2 (3.1–3.23) |
3.2 (3.2–3.4) |
<0.001*** |
3.2 (3.15–3.3) |
3.2 (3.1–3.3) |
0.905 |
3.2 (3.1–3.3) |
3.3 (3.2–3.4) |
<0.001*** |
3.2 (3.1–3.3) |
3.2 (3.2–3.4) |
<0.001*** |
3.2 (3.1–3.3) |
3.2 (3.2–3.4) |
0.213 |
Values are median (Q1–Q3). p from Mann–Whitney U test (asymptotic, 2-tailed). * p<0.05, ** p<0.01, *** p<0.001.
DISCUSSION :
This study evaluated maternal, fetal, anthropometric and Doppler factors associated with adverse perinatal outcomes among 367 pregnancies. Prematurity was observed in 40.6% of neonates, respiratory distress in 25.3%, and NICU admission in 44.5%, while 92.9% had a birth weight below 2500 g. The high frequency of low birth weight and prematurity in the present study indicates a substantial burden of adverse neonatal outcomes in this population. Maternal diabetes mellitus, hypertensive disorders of pregnancy, previous low birth weight, BMI, renal disease, autoimmune disorders, mode of delivery, fetal anthropometric measurements and umbilical artery Doppler findings were among the factors associated with one or more adverse outcomes. Our study's high NICU admission rate highlights the need for improved neonatal intensive care services in locations with limited resources and indicates the substantial infant morbidity linked to placental insufficiency.
Maternal BMI was significantly associated with poor perinatal outcomes including respiratory distress and NICU admission. This finding is consistent with previous evidence indicating that increased maternal BMI may adversely influence neonatal outcomes. It has been reported in a study that maternal obesity was significantly associated with NICU admission among near-term and term infants, with the association becoming stronger with increasing severity of obesity.12 More recent population-based evidence has also demonstrated that maternal BMI ≥30 kg/m² is associated with an increased risk of neonatal respiratory morbidity, including respiratory distress syndrome.13 The significant association with respiratory distress and NICU admission supports the importance of appropriate maternal weight assessment and management during pregnancy.
A previous history of low birth weight was significantly associated with prematurity in the present study. This observation agrees with evidence that adverse outcomes may recur across successive pregnancies. A systematic review identified previous adverse pregnancy outcomes and obstetric factors among important predictors of recurrent low birth weight, intrauterine growth restriction and prematurity.14 Similarly, a cohort study from Brazil found that recurrence of low birth weight was particularly associated with a previous preterm birth and higher parity.15 another study also demonstrated that a previous low-birth-weight infant was associated with lower birth weight and smaller anthropometric measurements in a subsequent pregnancy.16 These findings suggest that previous poor obstetric outcomes may identify women requiring closer antenatal surveillance in subsequent pregnancies.
Diabetes mellitus was significantly associated with fetal growth restriction and prematurity in the current study, with diabetes present in 45.2% of mothers of premature neonates compared with 29.7% of mothers of term neonates. This finding is consistent with extensive evidence linking maternal diabetes with adverse pregnancy outcomes. A large meta-analysis reported significantly increased risks of preterm delivery and NICU admission among pregnancies complicated by pregestational diabetes.17 Similarly, a recent systematic review and meta-analysis involving more than 137 million pregnancies found that pregestational diabetes was associated with increased risks of preterm delivery, low APGAR score, NICU admission, stillbirth and perinatal mortality.18
Hypertensive disorders showed particularly important associations with fetal growth restriction and adverse neonatal outcomes. Pregnancy-induced hypertension was significantly associated with respiratory distress and NICU admission, while pre-eclampsia was associated with prematurity, respiratory distress and NICU admission. These findings are strongly supported by previous research. In a large prospective cohort of 185,687 singleton births, maternal hypertension and pre-eclampsia were associated with increased risks of neonatal respiratory disorders, while pre-eclampsia was specifically associated with respiratory distress syndrome.19 Furthermore, pre-eclampsia has been shown to remain associated with NICU admission and respiratory distress even after accounting for the effect of preterm delivery, suggesting that its influence may extend beyond prematurity itself.20 The higher frequency of prematurity and neonatal respiratory morbidity among pregnancies complicated by pre-eclampsia in the present study may therefore reflect both placental dysfunction and the need for earlier delivery because of maternal or fetal compromise.
Mode of delivery was significantly associated with respiratory distress and NICU admission. Caesarean delivery was much more frequent among premature neonates than among term neonates (86.0% vs 62.7%) consistent with iatrogenic preterm birth due to fetal growth restriction. Similar associations between caesarean delivery and neonatal respiratory morbidity have been reported previously. A study of term neonates identified caesarean delivery as a strong risk factor for respiratory distress syndrome, while multiparity was also independently associated with respiratory morbidity.21 Another study demonstrated associations between caesarean delivery, neonatal respiratory distress and NICU admission.22 However, the relationship between mode of delivery and neonatal outcomes should be interpreted cautiously because caesarean delivery may be performed because of pre-existing fetal or maternal complications, including, previous cesarean delivery, non-progress of labour ,antepartum hemorrhage , chorioamnionitis etc. Thus, the observed association may partly reflect indication for caesarean delivery rather than the procedure itself.
The present study also demonstrated significant associations between fetal anthropometric measurements and adverse outcomes. Birth length and head circumference were significantly lower among premature neonates, those with respiratory distress, those requiring NICU admission and those with lower birth weight. Estimated fetal weight and abdominal circumference also differed significantly across several adverse outcomes. These findings are clinically plausible because reduced fetal growth and smaller anthropometric measurements often accompany prematurity and placental insufficiency.
The umbilical artery S/D ratio demonstrated significant associations with prematurity, respiratory distress and NICU admission. This is consistent with evidence that increased umbilical artery resistance reflects impaired placental vascular function and is associated with adverse perinatal outcomes. A study reported that persistently elevated umbilical artery S/D ratios were associated with increased preterm delivery, NICU admission and lower birth weight.24 The present findings therefore support the clinical value of umbilical artery Doppler assessment for identifying pregnancies at increased risk of adverse neonatal outcomes. In this study after establishing the diagnosis of IUGR the monitoring was done with serial growth scans and repeated ultrasound dopplers. The decision of delivery was made on the basis of worsening Doppler parameters, abnormal CTG (cardiotocography) and abnormal ductus venosus in those with absent diastolic flow.
Overall, the findings indicate that adverse perinatal outcomes in this study were multifactorial, involving maternal hypertensive disorder, previous obstetric history, fetal characteristics, anthropometric parameters and placental blood-flow indices. The strongest and most consistent associations were observed for maternal hypertension/pre-eclampsia, BMI, previous low birth weight, diabetes, mode of delivery and umbilical artery Doppler findings. These results emphasize the importance of early identification of high-risk pregnancies, optimization of maternal metabolic and hypertensive conditions, serial fetal growth assessment and appropriate Doppler surveillance. Because the present analysis primarily examined unadjusted associations, the observed relationships should not be interpreted as independent causal effects. Future studies using multivariable regression models would be useful to determine which maternal and fetal factors independently predict prematurity, respiratory distress, NICU admission and low birth weight.
CONCLUSION :
This study demonstrated that adverse perinatal outcomes were associated with a range of maternal, fetal and placental factors. Maternal diabetes mellitus was significantly associated with prematurity, while pregnancy-induced hypertension and pre-eclampsia were associated with respiratory distress, NICU admission and prematurity. Maternal BMI, previous history of low birth weight, renal disease, autoimmune disorders and mode of delivery were also associated with selected adverse outcomes. anthropometric measurements, estimated fetal weight and abnormal umbilical artery Doppler indices were associated with adverse neonatal outcomes. These findings highlight the importance of early identification and close antenatal surveillance of high-risk pregnancies, particularly those complicated by fetal growth abnormalities, diabetes and hypertensive disorders. Appropriate maternal disease control, serial fetal growth assessment and umbilical artery Doppler monitoring may facilitate timely intervention and potentially improve perinatal outcomes.
Conflict of Interest: Nil
Funding: Nil
BIBLIOGRAPHY:
1. Bendix I, Miller SL, Winterhager E. Editorial: Causes and Consequences of Intrauterine Growth Restriction. Front Endocrinol (Lausanne). 2020;11:205.
2. Sacchi C, Marino C, Nosarti C, Vieno A, Visentin S, Simonelli A, et al. Association of intrauterine growth restriction and small for gestational age status with childhood cognitive outcomes: a systematic review and meta-analysis. JAMA Pediatr. 2020;174(8):772-81
3. Zeng YJ, Zhang J, Li YF, Chen YY. A sustained decrease in the systolic/diastolic ratio may be a sign of severe adverse events in the umbilical cord: a report of eight cases. J Int Med Res. 2024 Apr;52(4):3000605241244763.
4. Dapkekar P, Bhalerao A, Kawathalkar A, Vijay N. Risk Factors Associated With Intrauterine Growth Restriction: A Case-Control Study. Cureus. 2023 Jun 9;15(6):e40178.
5. Kamphof HD, Schaaf JM, Houtzager B, Oosterbaan HP, Mol BWJ, Pajkrt E. Associations of severe adverse perinatal outcomes among continuous birth weight percentiles on different birth weight charts: a secondary analysis of a cluster randomized trial. BMC Pregnancy Childbirth. 2022;22(1):375.
6. Alda MG, Martínez-Portilla RJ, Figueras F, Savirón-Cornudella R, Olivas T, Hernández-Andrade E. Small for gestational age at preterm birth identifies adverse neonatal outcomes more reliably than antenatal suspicion of fetal growth restriction. J Matern Fetal Neonatal Med. 2023;36(2):2279017.
7. Sharma M, Sharma A, Agrawal D, Dubey J. Umbilical Artery Systolic/Diastolic Ratio and Amniotic Fluid Index in Prediction of Adverse Perinatal Outcome in Term Pregnancies. Int J Appl Basic Med Res. 2022;12(2):76-81.
8. Mahajan KS, Pawar BA, Patil RS, Parikh JR. Umbilical Artery Doppler Indices in Hypertensive Disorders of Pregnancy: Impact on Fetal Outcomes. Cureus. 2023;15(12):e50876.
9. Mendez-figueroa, Hector et al. Small for Gestational age infants among uncomplicated pregnancies at term. American Journal of Obstetrics & Gynecology, volume 215, Issue 5, 628.e1-628.e7
10. Meler E, Martinez-Portilla RJ, Caradeux J, Mazarico E, Gil-Armas C, Boada D, et al. Severe smallness as predictor of adverse perinatal outcome in suspected late small-for-gestational-age fetuses: systematic review and meta-analysis. Ultrasound Obstet Gynecol. 2022;60(3):328-37.
11. Channa R, Nadeem F, Nasir S, Ullah M. Comparison of Perinatal Outcomes in Growth Restricted Fetuses with Abnormal and Normal Umbilical Artery Doppler at a Tertiary Care Hospital. Journal of Islamic International Medical College (JIIMC). 2023;18(4):262-6
12. Suk D, Kwak T, Khawar N, Vanhorn S, Salafia CM, Gudavalli MB, et al. Increasing maternal body mass index during pregnancy increases neonatal intensive care unit admission in near and full-term infants. J Matern Fetal Neonatal Med. 2016;29(20):3249-53.
13. Association of maternal pre-pregnancy body mass index with neonatal respiratory outcomes: a nationwide population-based cohort study. Sci Rep. 2025.
14. Risk factors for repetition of low birth weight, intrauterine growth retardation, and prematurity in subsequent pregnancies: a systematic review. PubMed.
15. Prognostic factors for low birthweight repetition in successive pregnancies: a cohort study. BMC Pregnancy Childbirth. 2013;13:20.
16. Goldenberg RL, Hoffman HJ, Cliver SP, Cutter GR, Nelson KG, Copper RL. The influence of previous low birth weight on birth weight, gestational age, and anthropometric measurements in the current pregnancy. Obstet Gynecol. 1992;79(2):276-80.
17. Quantitative assessment of the effect of pre-gestational diabetes and risk of adverse maternal, perinatal and neonatal outcomes. Diabetes Res Clin Pract. 2017.
18. Pregestational Diabetes Mellitus and Adverse Perinatal Outcomes: A Systematic Review and Meta-Analysis. 2025.
19. Tian T, Wang L, Ye R, Liu J, Ren A. Maternal hypertension, preeclampsia, and risk of neonatal respiratory disorders in a large-prospective cohort study. Pregnancy Hypertens. 2020;19:131-7.
20. Controlled direct effects of preeclampsia on neonatal health after accounting for mediation by preterm birth. Am J Epidemiol. 2015.
21. Risk factors for respiratory distress syndrome in full-term neonates. Yeungnam Univ J Med. 2019;36(2):187-94.
22. Elective cesarean delivery, neonatal intensive care unit admission, and neonatal respiratory distress. J Matern Fetal Neonatal Med. 2008.
23. Fang K, Yue S, Wang S, Wang M, Yu X, Ding Y, et al. The association between sex and neonatal respiratory distress syndrome. BMC Pediatr. 2024;24:129.
24. Filmar G, Panagopoulos G, Minior V, Barnhard Y, Divon MY. Elevated umbilical artery systolic/diastolic ratio in the absence of fetal growth restriction. Arch Gynecol Obstet. 2013;288(2):279-85.