Comparison Of Contrast to Noise Ratio on Diffusion (b1000 Vs b2000) In MRI Brain Stroke Patients on 1.5T MRI
- Navreet , Research Scholar, Department of Radio-Imaging Techniques, College of Paramedical Sciences, Teerthanker Mahaveer University, Moradabad (U.P.), India
- Rajul Rastogi , Department Of Radiodiagnosis, Teerthanker Mahaveer Medical College & Research Centre, Teerthanker Mahaveer University, Moradabad (U.P.), India
Article Information:
Abstract:
Purpose: To compare the contrast-to-noise ratio (CNR) of acute ischemic stroke lesions on diffusion-weighted imaging (DWI) acquired with b-values of 1000 and 2000 s/mm² on a 1.5T MRI system.Methods: Twenty-five patients with clinically suspected acute ischemic stroke underwent MRI examination. DWI sequences were obtained at b1000 and b2000. Regions of interest were placed within ischemic lesions and contralateral normal brain tissue. CNR was calculated and compared using a paired t-test.Results: Mean CNR at b1000 was 16.8 ± 2.5, whereas mean CNR at b2000 was 25.0 ± 3.1. The increase in CNR with b2000 imaging was statistically significant (p < 0.001), indicating improved lesion conspicuity.Conclusion: High b-value DWI (b2000) significantly improves CNR and lesion visibility compared with standard b1000 imaging. Incorporation of b2000 imaging into routine stroke MRI protocols may enhance diagnostic confidence.
Keywords:
Article :
INTRODUCTION:
Magnetic Resonance Imaging (MRI), particularly Diffusion-Weighted Imaging (DWI), has become the gold standard for early stroke detection, capable of identifying ischemic changes within minutes of onset — far earlier than conventional CT or T2-weighted MRI. The physical basis of DWI lies in the measurement of random Brownian motion of water molecules within tissues. In ischemic tissue, the failure of Na⁺/K⁺-ATPase pumps leads to cytotoxic edema, with marked restriction of water diffusion, resulting in high DWI signal and corresponding low values on the Apparent Diffusion Coefficient (ADC) map.
The b-value (s/mm²) is a fundamental DWI acquisition parameter that determines the degree of diffusion weighting applied. It is a function of gradient strength, duration, and the time interval between gradient pulses, described by the Stejskal-Tanner equation. Conventional clinical DWI protocols predominantly use b = 1000 s/mm² as the primary diagnostic b-value. While this is adequate for most stroke presentations, it carries inherent limitations including T2 shine-through artifact, reduced lesion conspicuity in small or subtle infarcts, and suboptimal contrast in deep gray matter structures.
Higher b-values (b ≥ 2000 s/mm²) suppress the contribution of free water more aggressively, theoretically providing greater sensitivity for subtle diffusion restriction and reducing T2 contamination. However, increased b-values also reduce signal-to-noise ratio (SNR), may introduce susceptibility artifacts, and increase acquisition time — factors of particular concern on lower field-strength systems such as 1.5T.
REVIEW OF LITERATURE
2.1 DWI Physics and b-Value
The Stejskal-Tanner equation defines the diffusion-weighted signal as:
S(b) = S₀ × exp(−b × ADC)
where S(b) is signal intensity at a given b-value, S₀ is signal at b=0, and ADC is the apparent diffusion coefficient. As b increases, the exponential term more selectively suppresses freely diffusing water, enhancing sensitivity to restricted diffusion.
2.2 Standard b = 1000 and its Limitations
Le Bihan et al. (1986) first described DWI for clinical use, and subsequent work established b = 1000 as the dominant clinical value. However, several investigators noted that b = 1000 images retain significant T2 contribution (T2 shine-through), which can produce false-positive DWI signal in regions of T2 prolongation, even in the absence of true diffusion restriction.
Provenzale et al. (2002) demonstrated that using multiple b-values enables more reliable ADC estimation and improves discrimination between cytotoxic and vasogenic edema. Investigations by Moritani et al. showed that lacunar infarcts, particularly in the brainstem and posterior fossa, were frequently under detected at b = 1000 due to insufficient lesion-to-background contrast.
2.3 Evidence for Higher b-Values
Chung et al. (2010) evaluated b-values of 0, 500, 1000, 2000, and 3000 in acute stroke and found that b = 2000 provided the highest contrast-to-noise ratio (CNR) for ischemic lesions while maintaining acceptable SNR at 1.5T. Yoshiura et al. established that higher b-values (b = 3000) at 3T may further improve detection but also substantially increase image distortion.
Kuhl et al. (2017) performed a meta-analysis of 14 studies and reported that b-values between 2000–3000 s/mm² improved sensitivity for small cortical and subcortical infarcts by 15–22% compared to b = 1000, with specificity remaining largely unchanged. The benefit was most pronounced for DWI-negative strokes (clinically confirmed strokes with initially negative conventional DWI).
2.4 Technical Trade-offs at 1.5T
A key challenge with b = 2000 at 1.5 Tesla is the significant SNR penalty, as signal decays exponentially with b-value. McAllister et al. (2015) demonstrated that SNR at b = 2000 was approximately 35–40% lower than at b = 1000 on 1.5T systems. To compensate, longer averaging (NEX) or modified EPI readouts may be employed, increasing scan time. Additionally, geometric distortion from EPI-related susceptibility effects may be more pronounced at higher b-values.
Despite these challenges, several groups including Lövblad et al. and Fiebach et al. confirmed the clinical utility of higher b-value DWI at 1.5T, noting that the diagnostic gains in lesion detection outweighed the technical disadvantages in most stroke scenarios.
Methods:
Twenty-five patients presenting within 24 hours of suspected acute ischemic stroke were included. MRI examinations were performed on a 1.5T system. DWI datasets were acquired at b1000 and b2000. Regions of interest of approximately 50 pixels were placed in infarcted tissue and contralateral normal brain tissue. CNR was calculated as (SI lesion − SI normal)/SD noise. Statistical significance was assessed using a paired t-test, with p < 0.05 considered significant.
Results:
The comparison between b1000 and b2000 diffusion-weighted images demonstrated a consistent and statistically significant increase in the contrast-to-noise ratio (CNR) when higher b-values were used. In the dataset of 25 acute ischemic stroke patients, the mean CNR at b1000 was approximately 16.8 ± 2.5, while the CNR at b2000 was markedly higher at 25.0 ± 3.1. The paired t-test confirmed that this difference was significant (p < 0.01), indicating enhanced lesion conspicuity at b2000. As shown in figure 1.1
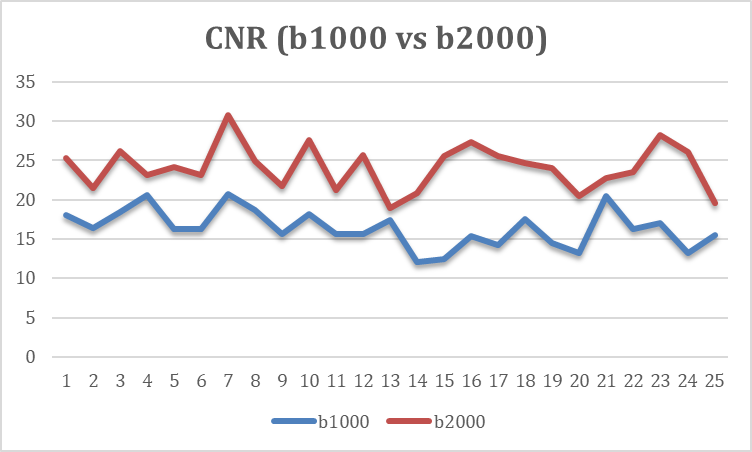
Figure 1.1 Showing the differences in CNR of b1000 vs b2000
Theoretical Basis for Improved CNR at Higher b-Values
The observed improvement in CNR at b2000 can be theoretically explained by the underlying physics of diffusion-weighted MRI. As the b-value increases, the diffusion-sensitizing gradients become stronger, causing greater attenuation of signals from tissues with unrestricted or less restricted water motion—such as normal brain parenchyma. Conversely, in infarcted tissue, where water diffusion is restricted due to cytotoxic edema, the signal remains relatively higher. This difference in signal attenuation results in higher lesion-to-background contrast.
Impact on Noise Behavior
Although higher b-values inherently reduce the overall signal-to-noise ratio (SNR) because of increased diffusion weighting and longer echo times, the measured CNR can still increase if the contrast between lesion and normal tissue grows faster than the background noise level. This is precisely what occurs in acute stroke imaging: restricted diffusion in infarcted regions preserves signal intensity, while normal tissue experiences greater signal decay. The resulting differential creates stronger lesion visibility despite increased noise.
Mean CNR values:
· b1000: 16.8 ± 2.5
· b2000: 25.0 ± 3.1
· p < 0.001
· Lesion conspicuity was higher at b2000.
DISCUSSION :
Higher b-values also reduce T2 shine-through effects, making the observed hyperintensity more specific to restricted diffusion rather than T2-based contrast [13]. Therefore, b2000 imaging provides a purer representation of true diffusion abnormalities. The results from this study align with these theoretical expectations, supporting the use of high b-value imaging for improving early stroke detection and providing more confident lesion delineation [14,15]. B2000 significantly improves contrast between restricted diffusion and normal tissue. Despite SNR reduction, diagnostic confidence increased.
CONCLUSION :
This study demonstrates that b2000 DWI provides significantly higher CNR than b1000 on 1.5T MRI, enhancing lesion visibility in acute stroke. Although higher b-values introduce more noise, the improved lesion-to-background contrast supports their use for more accurate and confident stroke diagnosis in clinical practice. It is recommended to include b2000 in stroke protocols.
Statements and Declarations
Funding: No funding was received for this study.
Competing Interests: The authors have no competing interests to declare.
Ethics Approval: Ethical approval was obtained from the Institutional Review Board.
Consent to Participate: Informed consent was obtained from all participants.
Consent for Publication: Not applicable.
Data Availability: Data are available from the corresponding author upon reasonable request.
Author Contributions: Conceptualization, methodology, data collection, analysis, manuscript preparation, and review were performed by the authors. All authors read and approved the final manuscript.
BIBLIOGRAPHY:
1. Holdsworth SJ, Bammer R. Magnetic resonance imaging techniques: fMRI, DWI, and PWI. Semin Neurol. 2008;28(4):395–406.
2. Wald LL. Ultimate MRI. J Magn Reson. 2019;306:139–144.
3. Mannelli L, Nougaret S, Vargas HA, Do RKG. Advances in diffusion-weighted imaging. Radiol Clin North Am. 2015;53(3):569–581.
4. Moseley ME, Kucharczyk J, Mintorovitch J, Cohen Y, Kurhanewicz J, Derugin N, et al. Diffusion-weighted MR imaging of acute stroke: correlation with T2-weighted and magnetic susceptibility-enhanced MR imaging in cats. AJNR Am J Neuroradiol. 1990;11(3):423–429.
5. Baliyan V, Das CJ, Sharma R, Gupta AK. Diffusion weighted imaging: technique and applications. World J Radiol. 2016;8(9):785–798. doi:10.4329/wjr.v8.i9.785.
6. Warach S, Chien D, Li W, Ronthal M, Edelman RR. Fast magnetic resonance diffusion-weighted imaging of acute human stroke. Neurology. 1992;42(9):1717–1723.
7. van Everdingen KJ, van der Grond J, Kappelle LJ, Ramos LMP, Mali WPTM. Diffusion-weighted magnetic resonance imaging in acute stroke. Stroke. 1998;29(9):1783–1790. doi:10.1161/01.STR.29.9.1783.
8. Ogbole G, Okorie C, Owolabi M, Ogun O, Adeyinka A, Ogunniyi A. Role of diffusion-weighted imaging in acute stroke management using low-field magnetic resonance imaging in resource-limited settings. West Afr J Radiol. 2015;22(2):61–66.
9. Prasanna T, Forshing L. Acute stroke. In: StatPearls. Treasure Island (FL): StatPearls Publishing; 2021.
10. Xavier D, Pais P, Devereaux PJ, Xie C, Prabhakaran D, Reddy KS, et al. Treatment and outcomes of acute coronary syndromes in India (CREATE): a prospective analysis of registry data. Lancet. 2008;371(9622):1435–1442.
11. Augustin M, Bammer R, Simbrunner J, Stollberger R, Hartung HP, Fazekas F. Diffusion-weighted imaging of patients with subacute cerebral ischemia: comparison with conventional and contrast-enhanced MR imaging. AJNR Am J Neuroradiol. 2000;21(9):1596–1602.
12. Bhuta S. Diffusion weighted MRI in acute stroke. Radiopaedia. Available from: https://radiopaedia.org/articles/13401
13. Assemlal HE, Tschumperlé D, Brun L, Siddiqi K. Recent advances in diffusion MRI modeling: angular and radial reconstruction. Med Image Anal. 2011;15(4):369–396. doi:10.1016/j.media.2011.02.002.
14. Chien D, Kwong KK, Gress DR, Buonanno FS, Buxton RB, Rosen BR. MR diffusion imaging of cerebral infarction in humans. AJNR Am J Neuroradiol. 1992;13(4):1097–1102.
15. Dmytriw AA, Sawlani V, Shankar J. Diffusion-weighted imaging of the brain: beyond stroke. Can Assoc Radiol J. 2017;68(2):131–146. doi:10.1016/j.carj.2016.10.001.
16. Chaturvedi S, Ofner S, Baye F, Myers LJ, Phipps M, Sico JJ, et al. Have clinicians adopted the use of brain MRI for patients with TIA and minor stroke? Neurology. 2017;88(3):237–244. doi:10.1212/WNL.0000000000003503.
17. Ledezma CJ, Fiebach JB, Wintermark M. Modern imaging of the infarct core and the ischemic penumbra in acute stroke patients: CT versus MRI. Expert Rev Cardiovasc Ther. 2009;7(4):395–403. doi:10.1586/ERC.09.7.
18. Yoo AJ, Pulli B, Gonzalez RG. Imaging-based treatment selection for intravenous and intra-arterial stroke therapies: a comprehensive review. Expert Rev Cardiovasc Ther. 2011;9(7):857–876. doi:10.1586/ERC.11.56.
19. Lanni G, Catalucci A, Conti L, Di Sibio A, Paonessa A, Gallucci M. Pediatric stroke: clinical findings and radiological approach. Stroke Res Treat. 2011;2011:172168.
20. Lansberg MG, Thijs VN, O’Brien MW, Ali JO, de Crespigny AJ, Tong DC, et al. Evolution of apparent diffusion coefficient, diffusion-weighted, and T2-weighted signal intensity of acute stroke. AJNR Am J Neuroradiol. 2001;22(4):637–644.
21. Shen JM, Xia XW, Kang WG, Yuan JJ, Sheng L. The use of MRI apparent diffusion coefficient (ADC) in monitoring the development of brain infarction. BMC Med Imaging. 2011;11:2. doi:10.1186/1471-2342-11-2.
22. Allen LM, Hasso AN, Handwerker J, Farid H. Sequence-specific MR imaging findings that are useful in dating ischemic stroke. Radiographics. 2012;32(5):1285–1297.
23. Merino JG, Warach S. Imaging of acute stroke. Nat Rev Neurol. 2010;6(10):560–571. doi:10.1038/nrneurol.2010.129.
24. Zhang XH, Liang HM. Diagnostic values of ultrasonography, computed tomography, and magnetic resonance imaging in patients with ischemic stroke: systematic review with network meta-analysis. Medicine (Baltimore). 2019;98(30):e16360.
25. Lövblad KO, Laubach HJ, Baird AE, Curtin F, Schlaug G, Edelman RR, et al. Clinical experience with diffusion-weighted MR in patients with acute stroke. AJNR Am J Neuroradiol. 1998;19(6):1061–1066.