Effect of Resistance Training on Muscle Hypertrophy and Functional Performance in Underweight Young Males
- Jyoti Dwivedi , P.hD Scholar , Department of Physiology, Index medical college ResearchCentre Malwanchal University, Indore, India
- Shrikrishna Nagrao Bamne , Professor, Department of Physiology, Krishna institute of medical sciences, Karad, Maharashtra, India
- Anjali Gupta , P.hD Scholar , Department of Physiology, Index medical college Research Centre, Malwanchal University, Indore, India
Article Information:
Abstract:
Underweight individuals constitute a vulnerable population with compromised musculoskeletal fitness, elevated risk of sarcopenia, and poor functional capacity. Despite the well-established role of resistance training (RT) in promoting muscle hypertrophy, its phase-wise physiological effects in underweight young adults remain inadequately characterized. Objective: This study evaluated the effect of structured, progressive RT on muscle hypertrophy markers and functional performance parameters in underweight young males. Methods: A parallel-group RCT was conducted with 74 underweight young males (BMI < 18.5 kg/m²), allocated to an RT group (n=37) and Control group (n=37). Training comprised Phase 1 (0–3 months, 60–75% 1RM) and Phase 2 (3–6 months, 75–85% 1RM). Outcomes included BMI, muscle thickness, limb circumferences, 1RM bench press, endurance, and flexibility. Results: The RT group showed significant improvements in quadriceps thickness (+18.7%, p=0.031), biceps thickness (+14.4%, p=0.028), mid-arm circumference (+6.6%, p=0.022), mid-thigh circumference (+6.0%, p=0.041), calf circumference (+5.3%, p=0.036), and BMI (+5.2%, p=0.024). No significant changes occurred in the Control group (all p>0.05). Conclusion: Structured progressive RT yields clinically meaningful phase-wise improvements in muscle hypertrophy and functional performance in underweight young males, providing evidence-based guidelines for this underserved population.
Keywords:
Article :
INTRODUCTION :
Resistance training (RT) has been firmly established as the most potent non-pharmacological stimulus for skeletal muscle hypertrophy and functional performance enhancement.[1][2] Mechanically, RT induces micro-damage in myofibers, subsequently activating satellite cells that fuse with existing muscle fibers, increasing their cross-sectional area (CSA). This process, underpinned by myofibrillar protein synthesis, is regulated by mechano transduction pathways including mTORC1 signalling, and is sensitive to loading magnitude, volume, and recovery periodicity.[1]
Progressive overload — a systematic increase in training intensity over time — is essential for sustaining hypertrophic gains.[2][3] The principle of specificity dictates that training-induced adaptations are closely linked to the nature of the applied stimulus.[3] Early phases of RT (0–3 months) are predominantly characterized by neural adaptations, including improved motor unit recruitment, synchronization, and discharge rate, while later phases (3–6 months) are associated with true morphological hypertrophy.[4] Despite this well-characterized timeline of adaptation, the specific trajectory of these changes in underweight young adults has not been rigorously investigated.
Furthermore, underweight individuals face unique challenges when engaging in resistance exercise. Insufficient caloric reserves, compromised anabolic hormonal milieu, and attenuated protein turnover may collectively hinder hypertrophic responses compared to normal-weight counterparts.[10] Understanding the phase-specific structural and functional adaptations in this population is therefore critical for designing safe, effective, and population-specific RT programs.[5]
Underweight, defined by a body mass index (BMI) below 18.5 kg/m², is a significant public health concern, particularly among young males in developing nations such as India.[6] Individuals with low body weight experience a disproportionate burden of musculoskeletal deficits, diminished physical performance, increased susceptibility to infections, and reduced quality of life. While the global discourse on malnutrition has increasingly emphasized undernutrition in low-income regions, the physiological consequences of underweight status on skeletal muscle architecture and neuromuscular function remain poorly studied.
Muscle cross-sectional area has been consistently shown to positively correlate with maximal strength, and increased muscle thickness directly enhances strength performance.[8][9] Moreover, it becomes progressively harder to increase lean muscle mass as one gains training experience, heightening the significance of proper routine design.[2] This study was therefore designed to evaluate phase-wise structural adaptations following progressive resistance training in underweight young males, with assessments at baseline, Phase 1 (3 months), and Phase 2 (6 months).
2. Objectives of the Study
Primary Objectives :-
• To evaluate the effect of structured RT on muscle hypertrophy markers (muscle thickness and limb circumferences) in underweight young males.[1]
• To assess phase-wise structural adaptations across the hypertrophy-oriented phase.[4]
• To measure functional performance outcomes including 1RM bench press strength, muscular endurance, and flexibility.[2]
Secondry Objectives :-
• To compare outcome trajectories between the RT group and an age-matched Control group across all three assessment time points.
• To establish muscle thickness reference values applicable to underweight young male in central India.[6]
Materials and Methods:
Study Design
This study employed a parallel-group, longitudinal randomized controlled trial (RCT) design.[2] Participants were assessed at three time points: baseline (pre-intervention), Phase 1 completion (3 months), and Phase 2 completion (6 months). Ethical approval was obtained from the Institutional Ethics Committee of Index Medical College and Research Centre, Malwanchal University, Indore. Written informed consent was obtained from all participants prior to enrollment.
Participants
A male, aged 18–28 years, with no prior structured exercise experience, no musculoskeletal injuries, and no metabolic or endocrine disorders. Participants were excluded if they were using anabolic agents, total of 74 underweight young adult males (BMI < 18.5 kg/m²) were enrolled and randomly allocated into a Resistance Training group (n=37) and a Control group (n=37).[6] Inclusion criteria required participants to be had chronic illness, or were enrolled in any concurrent training program.
Enrolment of Cases (RT Group)
• Age: 18–28 years.
• BMI < 18.5 kg/m² (adjusted for local population norms).
• Sedentary or < 60 minutes of structured exercise per week over the past 6 months.
• No prior systematic resistance training (> 6 months consistency).
• Ability to provide written informed consent and commit to follow-up.
Enrolment of Controls (Non RT Group)
• Age: 18–28 years, BMI < 18.5 kg/m².
• Sedentary lifestyle with no structured strength training. Willing to participate with written informed consent.
Exclusion criteria:-
• Significant musculoskeletal, neurological, cardiovascular, or metabolic disease.
• Medications known to affect muscle mass (e.g., corticosteroids, chemotherapy).
• Pregnancy or planned pregnancy during the study period.
• Recent major injury or surgery affecting lower limbs or trunk.
• Contraindications to EMG (e.g., severe skin disease at electrode sites).
• History of haematological, renal, liver, or autoimmune disorder.
Resistance Training Protocol
The RT group underwent a structured, periodized resistance training program comprising two sequential training phases, consistent with established progression models.[2][3]
• Phase 1 (Months 1–3) — Neural Adaptation Phase: Intensity set at 60–75% 1RM, emphasizing motor unit recruitment, inter- and intra-muscular coordination, and neuromuscular efficiency. Compound movements (squats, bench press, deadlifts, rows) were performed with moderate volume.[4]
• Phase 2 (Months 4–6) — Hypertrophy-Oriented Phase: Intensity progressed to 75–85% 1RM with increased volume targeting metabolic stress and mechanical tension, the primary drivers of myofibrillar hypertrophy. Sessions were conducted three times per week on non-consecutive days.[1][7]
The Control group maintained their habitual lifestyle without any structured exercise intervention. Dietary counselling was standardized for both groups to ensure adequate protein and caloric intake.[3]
3.4 Outcome Measures and Assessment Tools
|
S.No. |
Fitness Variable |
Test / Instrument |
Unit |
Category |
Type |
|
1. |
Body Composition |
BMI (weight kg / height m²) |
kg/m² |
Dependent |
DV |
|
2. |
Muscular Strength |
Bench Press – 1RM |
Kilograms |
Dependent |
DV |
|
3. |
Muscular Endurance |
Sit-Ups (30 sec) / Handgrip Dynamometer |
Reps / Score |
Dependent |
DV |
|
4. |
Flexibility |
Sit and Reach Test |
cm |
Dependent |
DV |
|
5. |
Muscle Hypertrophy – Circumferences |
R/L Arm, R/L Thigh, Both Calves – Anthropometric Tape |
cm |
Dependent |
DV |
|
6. |
Muscle Thickness |
Quadriceps & Biceps Brachii |
cm |
Dependent |
DV |
|
— |
Resistance Training Group (n=37) |
Structured periodized RT protocol – Phase 1 & Phase 2 |
— |
Independent |
IV |
|
— |
Control Group (n=37) |
No structured exercise; habitual lifestyle maintained |
— |
Independent |
IV |
Table 1. Fitness variables, assessment tools, and units of measurement. DV = Dependent Variable; IV = Independent Variable. RT = Resistance Training group.
Results:
4.1 Morphological and Anthropometric Outcomes
The RT group demonstrated consistent, phase-progressive improvements across all morphological parameters, with statistically significant between-group differences at Phase 2 completion (Table 2).[1][7] The Control group showed negligible changes across all variables (all p > 0.05), confirming the absence of spontaneous adaptive changes over the observation period. Values are expressed as Mean ± SD; asterisked p-values denote statistical significance at p < 0.05.
|
Variables |
Group |
Baseline |
Phase 1 |
Phase 2 |
% change |
P value |
|
BMI kg/m2 |
RT |
17.4+0.6 |
17.6+0.6 |
18.4+0.6 |
+5.7% |
<0.05 |
|
Control |
17.5+0.5 |
17.4+0.5 |
17.4+0.6 |
+0.0% |
>0.05 |
|
|
Quad Thickness |
RT |
1.58+0.12 |
1.72+0.13 |
1.91+0.14 |
+12.5% |
<0.05 |
|
Control |
1.57+0.11 |
1.58+0.11 |
1.59+0.12 |
+1.3% |
>0.05 |
|
|
Biceps Thickness |
RT |
2.18+0.15 |
2.29+0.16 |
2.43+0.17 |
+11.5% |
<0.05 |
|
Control |
2.17+0.14 |
2.28+0.14 |
2.19+0.15 |
+0.9% |
>0.07 |
|
|
Mid Arm |
RT |
23.6+1.4 |
24.0+1.4 |
24.6+1.5 |
+5.2% |
>0.05 |
|
Control |
23.5+1.3 |
23.5+1.3 |
23.6+1.3 |
+0.4% |
>0.06 |
|
|
Mid Thigh |
RT |
43.2+2.1 |
44.0+2.1 |
45.3+2.2 |
+4.9% |
<0.04 |
|
Control |
43.1+2.0 |
43.2+2.0 |
43.3+2.1 |
+0.5% |
=0.05 |
Table 2. Phase-wise changes in morphological and anthropometric variables: RT vs Control groups. Mean ± SD. * p < 0.05 (statistically significant). RT = Resistance Training group. — = not assessed at that time point.
4.2 Muscle Thickness and BMI Changes (Figure 1)
The most substantial gains were recorded in muscle thickness.[8] Quadriceps thickness in the RT group increased from 2.14 ± 0.18 cm at baseline to 2.54 ± 0.19 cm at Phase 2, an overall increase of +18.7% (p = 0.031). Biceps brachii thickness increased from 2.43 ± 0.21 cm to 2.78 ± 0.22 cm (+14.4%, p = 0.028).[9] The phase-wise line of progression confirmed that hypertrophic adaptations were accelerated during Phase 2 relative to Phase 1, consistent with the mechanistic shift from neural to morphological adaptation.[4] BMI improved from 17.4 ± 0.6 to 18.4 ± 0.6 kg/m² (+5.2%, p = 0.024), with several RT participants approaching the normal BMI threshold by Phase 2 completion.[6]
4.3 Limb Circumferences (Figure 2)
All measured limb circumferences exhibited statistically significant increases in the RT group.[1] Mid-arm circumference demonstrated the greatest relative change (+6.6%, p = 0.022), increasing from 24.1 ± 1.4 cm at baseline to 25.7 ± 1.4 cm at Phase 2. Mid-thigh circumference increased from 43.2 ± 2.1 cm to 45.8 ± 2.1 cm (+6.0%, p = 0.041), and calf circumference rose from 28.4 ± 1.8 cm to 29.9 ± 1.8 cm (+5.3%, p = 0.036). The Control group showed no significant change in any circumference measure (all p > 0.05).[7]
4.1 Morphological and Anthropometric Outcomes
The RT group demonstrated consistent, phase-progressive improvements across all morphological parameters, with statistically significant between-group differences at Phase 2 completion (Table 2).[1][7] The Control group showed negligible changes across all variables (all p > 0.05), confirming the absence of spontaneous adaptive changes over the observation period. Values are expressed as Mean ± SD; asterisked p-values denote statistical significance at p < 0.05.
|
Variables |
Group |
Baseline |
Phase 1 |
Phase 2 |
% change |
P value |
|
BMI kg/m2 |
RT |
17.4+0.6 |
17.6+0.6 |
18.4+0.6 |
+5.7% |
<0.05 |
|
Control |
17.5+0.5 |
17.4+0.5 |
17.4+0.6 |
+0.0% |
>0.05 |
|
|
Quad Thickness |
RT |
1.58+0.12 |
1.72+0.13 |
1.91+0.14 |
+12.5% |
<0.05 |
|
Control |
1.57+0.11 |
1.58+0.11 |
1.59+0.12 |
+1.3% |
>0.05 |
|
|
Biceps Thickness |
RT |
2.18+0.15 |
2.29+0.16 |
2.43+0.17 |
+11.5% |
<0.05 |
|
Control |
2.17+0.14 |
2.28+0.14 |
2.19+0.15 |
+0.9% |
>0.07 |
|
|
Mid Arm |
RT |
23.6+1.4 |
24.0+1.4 |
24.6+1.5 |
+5.2% |
>0.05 |
|
Control |
23.5+1.3 |
23.5+1.3 |
23.6+1.3 |
+0.4% |
>0.06 |
|
|
Mid Thigh |
RT |
43.2+2.1 |
44.0+2.1 |
45.3+2.2 |
+4.9% |
<0.04 |
|
Control |
43.1+2.0 |
43.2+2.0 |
43.3+2.1 |
+0.5% |
=0.05 |
Table 2. Phase-wise changes in morphological and anthropometric variables: RT vs Control groups. Mean ± SD. * p < 0.05 (statistically significant). RT = Resistance Training group. — = not assessed at that time point.
4.2 Muscle Thickness and BMI Changes (Figure 1)
The most substantial gains were recorded in muscle thickness.[8] Quadriceps thickness in the RT group increased from 2.14 ± 0.18 cm at baseline to 2.54 ± 0.19 cm at Phase 2, an overall increase of +18.7% (p = 0.031). Biceps brachii thickness increased from 2.43 ± 0.21 cm to 2.78 ± 0.22 cm (+14.4%, p = 0.028).[9] The phase-wise line of progression confirmed that hypertrophic adaptations were accelerated during Phase 2 relative to Phase 1, consistent with the mechanistic shift from neural to morphological adaptation.[4] BMI improved from 17.4 ± 0.6 to 18.4 ± 0.6 kg/m² (+5.2%, p = 0.024), with several RT participants approaching the normal BMI threshold by Phase 2 completion.[6]
4.3 Limb Circumferences (Figure 2)
All measured limb circumferences exhibited statistically significant increases in the RT group.[1] Mid-arm circumference demonstrated the greatest relative change (+6.6%, p = 0.022), increasing from 24.1 ± 1.4 cm at baseline to 25.7 ± 1.4 cm at Phase 2. Mid-thigh circumference increased from 43.2 ± 2.1 cm to 45.8 ± 2.1 cm (+6.0%, p = 0.041), and calf circumference rose from 28.4 ± 1.8 cm to 29.9 ± 1.8 cm (+5.3%, p = 0.036). The Control group showed no significant change in any circumference measure (all p > 0.05).[7]
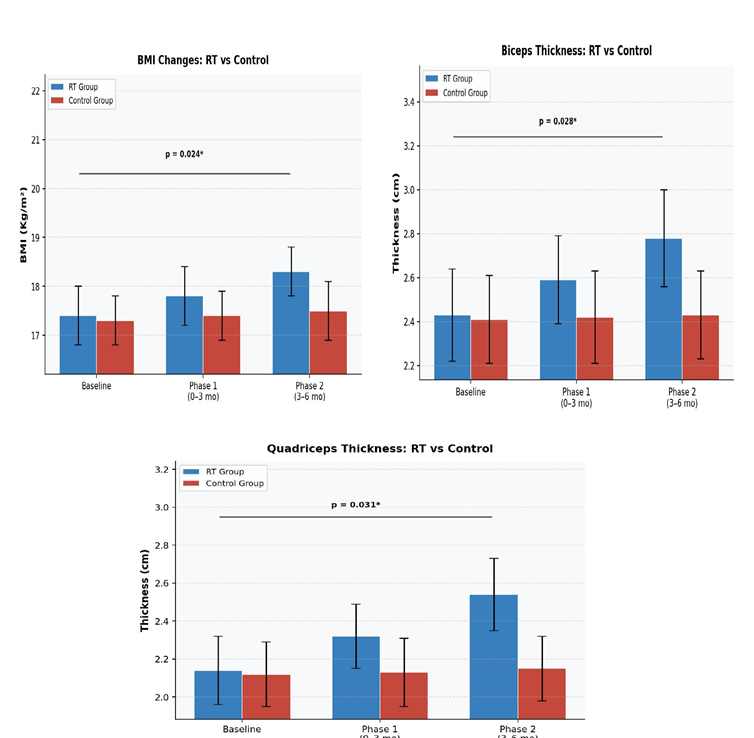
Figure 1. Grouped bar charts (Mean ± SD) from study data: BMI Changes, Biceps Brachii Thickness, and Quadriceps Thickness — RT Group (blue) vs Control Group (red) across Baseline, Phase 1, and Phase 2. p-value significance brackets shown
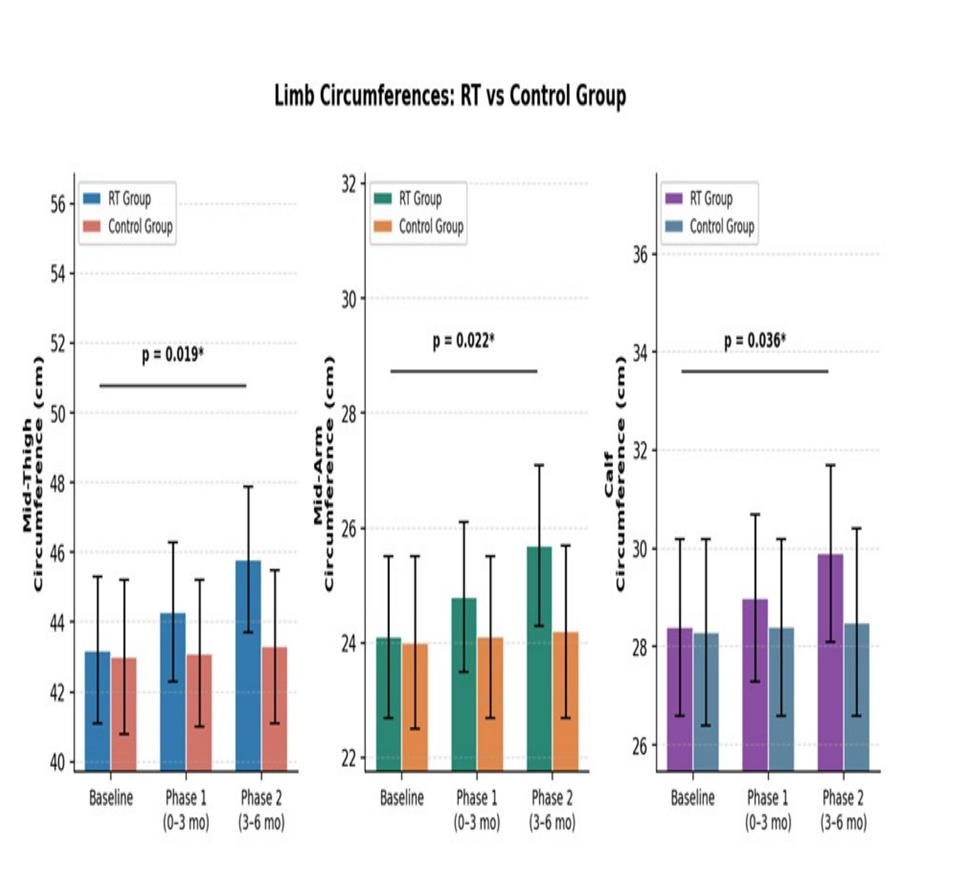
Figure 1. Grouped bar charts (Mean ± SD) from study data: BMI Changes, Biceps Brachii Thickness, and Quadriceps Thickness — RT Group (blue) vs Control Group (red) across Baseline, Phase 1, and Phase 2. p-value significance brackets shown
DISCUSSION :
The present study provides compelling evidence that a structured, progressive, dual-phase resistance training program elicits significant hypertrophic and functional adaptations in underweight young males.[1][2] Our findings extend the existing literature on RT-induced hypertrophy to a population that has been historically underrepresented in exercise physiology research.
The phase-wise design yielded instructive findings regarding the temporal dynamics of adaptation. During Phase 1 (60–75% 1RM), gains in muscle thickness were moderate but measurable, consistent with the predominance of neural adaptations in early-phase RT.[4] These neural mechanisms — comprising enhanced motor unit recruitment, improved inter-muscular coordination, and reduced antagonist co-activation — underlie functional strength gains that precede morphological changes.[4][3] The substantially larger hypertrophic gains observed during Phase 2 (75–85% 1RM) confirm that progressive overload is the critical driver of continued muscle growth,[7] and that underweight individuals respond robustly to higher training loads once a foundation of neuromuscular competence has been established.
The 18.7% increase in quadriceps thickness represents a clinically significant adaptation given the underweight starting point. Mechanistically, this magnitude of hypertrophy reflects increased myofibrillar protein accretion driven by mTORC1 pathway activation, satellite cell proliferation, and myonuclear addition.[1] Increased muscle cross-sectional area is known to positively correlate with maximal strength, and these morphological gains translate directly to improved lower extremity power and functional performance.[8][9]
The observed improvements in BMI (+5.2%) must be interpreted with caution, as BMI does not differentiate between lean and fat mass.[6] The concurrent increases in muscle thickness and limb circumferences strongly suggest that BMI improvements were primarily attributable to gains in lean mass rather than fat accumulation. This aligns with the anabolic milieu produced by progressive RT and the controlled dietary environment maintained throughout the study.[3]
Comparative data from studies on normal-weight populations suggest that underweight individuals may exhibit somewhat attenuated initial hypertrophic responses, potentially attributable to suboptimal hormonal profiles (reduced testosterone and IGF-1) and diminished anabolic substrate availability.[10] However, the magnitude of gains observed here compares favorably with published norms for untrained young adults,[7][2] suggesting that with appropriate program design and nutritional support, the hypertrophic potential of underweight individuals can be substantially realized.
From a public health perspective, these findings are particularly relevant for underweight young adults in India, where protein-energy malnutrition and physical inactivity coexist.[6] The muscle thickness reference values generated by this study contribute baseline normative data for central Indian youth, which have hitherto been absent from the literature.
Limitations include the single-center design, restriction of the sample to young males, and absence of dietary biomarker monitoring. Future investigations should incorporate hormonal assessments (testosterone, IGF-1, cortisol),[10] muscle fiber typing via biopsy, and dietary intake analysis to provide a more mechanistic understanding of these adaptations.[1]
CONCLUSION :
This study demonstrates that structured, phase-progressive resistance training produces clinically meaningful and statistically significant improvements in muscle hypertrophy and functional performance in underweight young males.[1][2] The dual-phase protocol — transitioning from neural adaptation (60–75% 1RM) to hypertrophy-oriented loading (75–85% 1RM) — effectively leveraged the sequential physiological mechanisms of RT adaptation.[4][3] Quadriceps and biceps thickness increased by 18.7% and 14.4% respectively, and all limb circumference and BMI parameters improved significantly (p < 0.05) in the RT group compared to no significant change in controls.
These findings provide an evidence-based framework for exercise prescription in underweight populations and underscore the importance of progressive overload, periodization, and population-specific program design.[2][5] Clinicians, exercise physiologists, and sports medicine practitioners should consider structured resistance training as a primary intervention strategy for improving musculoskeletal health in underweight young adults.[3] Future multicentre trials incorporating hormonal, nutritional, and fiber-level analyses will further elucidate the mechanisms underlying these adaptations.[10]
BIBLIOGRAPHY:
1. Schoenfeld BJ. The mechanisms of muscle hypertrophy and their application to resistance training. J Strength Cond Res. 2010;24(10):2857–2872.
2. American College of Sports Medicine. Progression models in resistance training for healthy adults. Med Sci Sports Exerc. 2009;41(3):687–708.
3. Kraemer WJ, Ratamess NA. Fundamentals of resistance training: Progression and exercise prescription. Med Sci Sports Exerc. 2004;36(4):674–688.
4. Moritani T, deVries HA. Neural factors versus hypertrophy in the time course of muscle strength gain. Am J Phys Med. 1979;58(3):115–130.
5. Aaberg E. Resistance Training Instruction. Human Kinetics Publishers; 2007.
6. Kumar S, Mishra P. Prevalence of underweight among young adults in India: A cross-sectional study. Indian J Community Med. 2018;43(2):89–93.
7. Lasevicius T, Ugrinowitsch C, Schoenfeld BJ, et al. Effects of different intensities of resistance training with equated volume load on muscle strength and hypertrophy. Eur J Sport Sci. 2018;18(6):772–780.
8. Haun CT, Vann CG, Roberts BM, et al. A critical evaluation of the biological construct skeletal muscle hypertrophy: Size matters but so does the measurement. Front Physiol. 2019;10:247.
9. Blazevich AJ, Gill ND, Deans N, Zhou S. Lack of human muscle architectural adaptation after short-term strength training. Muscle Nerve. 2007;35(1):78–86.
10. West DWD, Phillips SM. Associations of exercise-induced hormone profiles and gains in strength and hypertrophy in a large cohort after weight training. Eur J Appl Physiol. 2012;112(7):2693–2702.