Quantitative Assessment of cutC and cntA Genes in Gut Microbiota of Atherosclerosis Patients Using qPCR Technique
- Raqaa Abd Almuhsin Muhammed , Department of Biology/Collage of Science/University of Mosul
- Amera Mahmood Muhammed , amesbio@uomosul.edu.iq
Article Information:
Abstract:
Gut microbiota-derived trimethylamine (TMA) production is mediated by key microbial genes including cutC and cntA, which are involved in TMAO formation, a metabolite linked to atherosclerosis progression.Objective: This study aimed to evaluate the prevalence and copy number of cutC and cntA genes in gut microbiota of atherosclerosis patients and their association with serum TMAO levels.Methods: Stool samples from 22 participants (11 atherosclerosis patients and 11 healthy controls) were analyzed using quantitative PCR (qPCR) targeting cutC, cntA, and 16S rRNA genes. Gene copy numbers were calculated and correlated with serum TMAO levels.Results: cutC and/or cntA genes were detected in 8/22 samples (36.3%), predominantly in atherosclerosis patients (72%). Gene copy numbers ranged from 6.25×10^8 to 1.85×10^9 copies/sample. Higher TMAO levels were observed in gene-positive samples (152.2 µM and 29 µM). Some samples showed gene presence without elevated TMAO levels, indicating environmental and functional regulation beyond gene presence alone. A significant association was observed between gene presence and elevated TMAO levels.Conclusion: The presence of cutC and cntA genes in gut microbiota is strongly associated with increased TMAO levels in atherosclerosis patients, suggesting a functional role of these genes in disease-associated metabolic pathways.
Keywords:
Article :
INTRODUCTION:
Atherosclerosis is the main underlying cause of cardiovascular diseases. Atherosclerosis is an inflammatory disease of the large arteries that is the major cause of cardiovascular disease (CVD) and stroke( Björkegren et al., 2022).
TMA is produced from the activity of the cntA and cutC reach the liver, where it is converted by FMO3 to TMAO, recent human and clinical studies confirm that elevated TMAO levels are associated with an increased incidence of ischemic heart disease and increased severity of atherosclerosis, because elevated TMAO has been shown to contribute to a range of mechanisms leading to atherosclerosis, such as increased endothelial inflammation, enhanced foam cell formation, impaired cholesterol reverse transport, and increased intravascular oxidative stress. (Oktaviano et al., 2023 ; Liu et al., 2025 ; Alsulami et al., 2025 and Budoff et al ., 2025) .
Materials and Methods:
Study Design and Samples
A total of 22 stool samples were selected from a larger cohort (11 atherosclerosis patients and 11 healthy individuals).
DNA Extraction
Genomic DNA was extracted from stool samples using a commercial extraction kit following manufacturer instructions.
qPCR Analysis
Quantitative PCR was performed targeting cutC, cntA, and bacterial 16S rRNA genes. Specific primers were used, and amplification was carried out under optimized cycling conditions. Standard curves were constructed for absolute quantification of gene copy numbers.
TMAO Measurement
Serum TMAO levels were previously determined using ELISA-based methods.
Statistical Analysis
Gene copy numbers and TMAO levels were analyzed descriptively and comparatively between groups.
Results:
The genes cutC (480bp) cntA (460bp), and 16S ( bp) were amplified via PCR and the corresponding bands were separated on agarose gel and excised for the gel. DNA concentration was measured and three concentrations (1ng, 2ng, and 5ng) were chosen to draw a standard curve graph depending on the quantity of each sample verses the CT value as shown in table (1) below.
Table (1) DNA concentration and CT values
|
Gene interest cut C |
CT |
Gene interest cnt A |
CT |
Gene interest 16s |
CT |
|
St3 5ng/Ml |
9.27 |
St3 5ng/Ml |
9.5 |
St3 5ng/Ml |
7.14 |
|
St4 2ng/Ml |
17.36 |
St4 2ng/Ml |
18.52 |
St4 2ng/Ml |
16.24 |
|
St5 1ng/Ml |
36.84 |
St5 1ng/Ml |
37.25 |
St5 1ng/Ml |
32.86 |
Standard curves using the date in table (1) were plotted and results are shown below in figure (1),(2),(3)
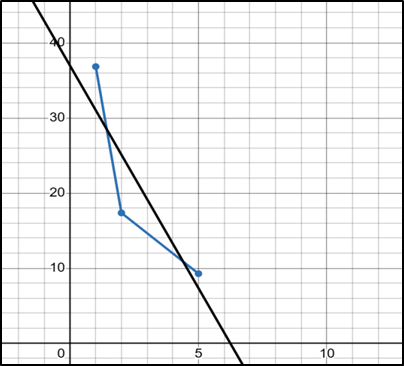
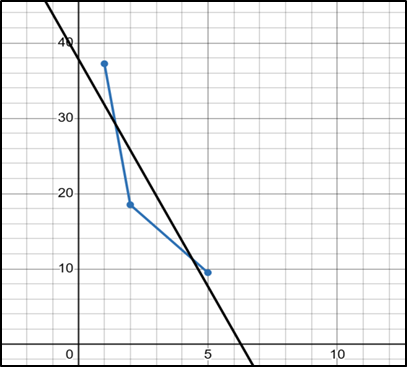
Figure (1) : cutC standard curve Figure (2) : cntA standard curve
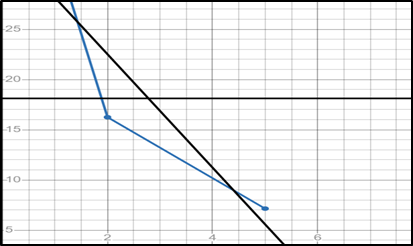
Figure (3) : 16SrRNA standard curve
Then, DNA was isolated from the 22 samples under study, and qPCR was performed using specific primers for each gene under study. The CT values were plotted against the trend line, and DNA quantities were identified as shown in tables (2), (3), and (4) .
Table (2): CT values and DNA quantity for cutC (480bp)
|
Sample no. |
CT value |
Quantity ng |
|
7 |
34.67 |
0.39 |
|
9 |
32.15 |
0.811 |
|
13 |
35.01 |
0.328 |
|
15 |
34.68 |
0.384 |
|
16 |
32.53 |
0.747 |
Table (3): CT values and DNA quantity for cntA (460bp)
|
CT value |
Quantity ng |
|
|
2 |
32.64 |
0.861 |
|
6 |
33.38 |
0.739 |
|
8 |
33.04 |
0.795 |
|
15 |
33.53 |
0.714 |
|
16 |
32.24 |
0.928 |
Table (4): CT values and DNA quantity for 16S rRNA gene (380bp)
|
Sample no. |
CT value |
Quantity ng |
|
1 |
16.24 |
3.110 |
|
2 |
17.94 |
2.810 |
|
3 |
17.25 |
2.931 |
|
4 |
18.24 |
2.756 |
|
5 |
18.34 |
2.738 |
|
6 |
18.84 |
2.650 |
|
7 |
18.84 |
2.650 |
|
8 |
16.59 |
3.048 |
|
9 |
17.64 |
2.862 |
|
10 |
17.53 |
2.919 |
|
11 |
17.64 |
2.862 |
|
12 |
18.22 |
2.759 |
|
13 |
16.49 |
3.066 |
|
14 |
16.25 |
3.108 |
|
15 |
19.50 |
2.533 |
|
16 |
14.77 |
3.370 |
|
17 |
19.25 |
2.577 |
|
18 |
19.35 |
2.559 |
|
19 |
18.22 |
2.759 |
|
20 |
18.34 |
2.738 |
|
21 |
17.86 |
2.823 |
|
22 |
18.12 |
2.777 |
Calculations:
To calculate the number of copies of each gene in the samples, the following equation was followed:
|
Amount (ng) X 6.022 X 10²³ |
Number of DNA copies = ______________________
|
Length (bp) X 1X109 X 660 |
6.022 X 1023 = Avocado number
1X109= conversion factor to ng
660= average mass of 1bp dsDNA g/mol
The number of copies of each gene shown in the tables(5),(6),(7) below.
Table (5): Number of cutC gene copies (480bp)
|
Sample no. |
Number of gene copies |
DNA Quantity ng |
|
7 |
7.43×10⁸ |
0.39 |
|
9 |
1.54×10⁹ |
0.811 |
|
13 |
6.25×10⁸ |
0.328 |
|
15 |
7.32×10⁸ |
0.384 |
|
16 |
1.42×10⁹ |
0.747 |
Table (6): Number of cntA gene copies (460bp)
|
Sample no. |
Number of gene copies |
DNA Quantity ng |
|
2 |
1.72×10⁹ |
0.861 |
|
6 |
1.47×10⁹ |
0.739 |
|
8 |
1.58×10⁹ |
0.795 |
|
15 |
1.42×10⁹ |
0.714 |
|
16 |
1.85×10⁹ |
0.928 |
Table (7): Number of 16S rRNA gene copies (380bp)
|
Sample no. |
Number of gene copies |
Quantity ng |
|
7.49×10⁹ |
3.110 |
|
|
2 |
6.76×10⁹ |
2.810 |
|
3 |
7.05×10⁹ |
2.931 |
|
4 |
6.63×10⁹ |
2.756 |
|
5 |
6.59×10⁹ |
2.738 |
|
6 |
6.38×10⁹ |
2.650 |
|
7 |
6.38×10⁹ |
2.650 |
|
8 |
7.34×10⁹ |
3.048 |
|
9 |
6.89×10⁹ |
2.862 |
|
10 |
7.03×10⁹ |
2.919 |
|
11 |
6.89×10⁹ |
2.862 |
|
12 |
6.64×10⁹ |
2.759 |
|
13 |
7.38×10⁹ |
3.066 |
|
14 |
7.48×10⁹ |
3.108 |
|
15 |
6.10×10⁹ |
2.533 |
|
16 |
8.12×10⁹ |
3.370 |
|
17 |
6.21×10⁹ |
2.577 |
|
18 |
6.16×10⁹ |
2.559 |
|
19 |
6.64×10⁹ |
2.759 |
|
20 |
6.59×10⁹ |
2.738 |
|
21 |
6.80×10⁹ |
2.823 |
|
22 |
6.69×10⁹ |
2.777 |
Detection of cutC and cntA Genes
Out of 22 samples, 8 samples (36.3%) were positive for either cutC or cntA genes. The majority of positive samples belonged to atherosclerosis patients (72%).
Gene Copy Number
copy numbers ranged from:
cutC: up to 10^9 × 1.85 copies/sample
cntA: up to 10^9 range in positive samples
Association with TMAO Levels
Samples with both genes detected showed elevated TMAO levels (152.2 µM and 29 µM). However, some gene-positive samples did not show elevated TMAO, indicating additional regulatory factors.
16S rRNA Normalization
16S rRNA gene amplification confirmed bacterial DNA integrity and allowed normalization of gene abundance.
DISCUSSION :
The presence of cutC and cntA genes reflects the functional potential of gut microbiota to produce TMA, a precursor of TMAO. The higher prevalence of these genes in atherosclerosis patients suggests microbial contribution to disease-associated metabolic alterations. However, the absence of elevated TMAO in some gene-positive samples indicates that gene presence alone is insufficient, and environmental, dietary, and host enzymatic factors also regulate TMAO production. These findings align with the concept that cardiovascular risk is influenced by functional microbial pathways rather than microbial composition alone.
Analysis of qPCR showed that cutC and cntA gene transcripts were present in only 8 out of 22 samples. Notably, samples 15 and 16 showed both genes.In some participants with elevated TMAO levels, the gene transcripts were absent, while they were present in some samples with low TMAO, consistent with (Hass., et al., 2025) who proposed that the presence of microbial genes associated with TMAO production does not necessarily guarantee elevated TMAO levels in the blood. TMAO production depends on actual gene expression and the activity of TMA producing enzymes, not solely on the presence of the gene (Zhai et al., 2024; Simo and Garcia, 2020).
In samples from patients with atherosclerosis, the majority of gene copies were present in participants with elevated TMAO levels, supporting the hypothesis that increased abundance of the cutC and cntA genes is associated with elevated TMAO and increased risk of cardiovascular disease, genes in these samples ranged from 0.7 to 0.9 ng according to qPCR, reflecting high biological activity for TMA production (Zhang and Yang, 2022; Niu et al., 2023). In contrast, samples from healthy individuals showed a lower gene distribution and relatively low TMAO levels, consistent with previous observations that a healthy microbiome typically contains fewer TMA producing bacteria, and that the presence of these genes does not necessarily translate into high TMAO production due to a balance bwteeen pro and suppressive bacteria (Klingberg et al., 2021; Zang,2025).
Functional microbiome analysis and qPCR correlation with TMAO levels as shown in table (4-20)indicate that the presence of both the cutC and cntA genes in the same sample reflects a higher capacity for TMA production and, consequently, a potential elevation in TMAO (Pisano et al., 2023; Budoff, 2025). However, the absence of these genes in some bacteria may produce TMA via alternative pathways such as cntB/cntC, or that gene activity is influenced by regulatory and environmental factors, including oxygen availability, PH, and nutrient substrate availability(Heianza et al., 2024; Xie et al., 2025).
These findings support the modern view that TMAO is not simply an indicator of specific gene presence, but rather a result of the interplay between gene abundance, bacterial function activity, diet, and the intestinal environment(Chen and Guo, 2025; Tang and Hazen, 2015). Furthermore, the relationship between gene expression and elevated TMAO supports studies demonstrating an association between TMAO an increased risk of cardiovascular events in patients compared to healthy individuals, with individual variations among participants. This reflects the combined influence of microbiome, gene activity, and diet on atherosclerosis risk(Zhang and Yang, 2022; Chen and Guo, 2025).
Moreover, the expression of multiple gene copies in the same sample, as in sample 15 and 16, often leads to higher TMAO accumulation, which can be cosiderd a molecular marker of increased atherosclerotic risk in these patients(Pisano et al., 2023; Budoff, 2025; Pauland Baker, 2018).
Hence, it is clear that measuring the transcription of the cutC and cntA genes via qPCR with the assessment of TMAO levels in the blood provides a comprehensive understanding of the role of gut microbes in atherosclerosis, as it shows that the elevation of TMAO in patients is partly related to the presence of microbial genes but is also affected by the functional activity of bacteria, environmental conditions, and nutrition, making the integration of qPCR analysis with the assessment of metabolites essential for the accurate interpretation of biological risk(Romano et al., 2015; Liu et al., 2025; Heianza et al., 2024).
CONCLUSION:
The study demonstrates a significant association between gut microbial cutC and cntA genes and elevated TMAO levels in atherosclerosis patients. These genes may serve as functional biomarkers for cardiovascular risk linked to gut microbiota metabolism.
BIBLIOGRAPHY:
1. Alsulami, M., Alzahrani, A., & Alharbi, A. (2025). The effect of TMAO on aging-associated cardiovascular and metabolic pathways and emerging therapies. Molecular and Cellular Biochemistry, 480, 5659–5669. https://doi.org/10.1007/s11010-025-05356-2
2. Björkegren, J.L.M.; Lusis, A.J. Atherosclerosis: Recent Developments. Cell 2022, 185, 1630–1645.
3. Budoff, M. J. (2025). Gut microbiome-mediated TMAO and cardiovascular risk: clinical evidence and perspectives. Current Atherosclerosis Reports, 27, 109–120. https://doi.org/10.1007/s11883-025-01097-2
4. Chen, H., & Guo, X. (2025). Plasma TMAO and gut microbiota gene profiles in cardiovascular disease patients. Frontiers in Nutrition, 12, 11023. https://doi.org/10.3389/fnut.2025.11023
5. Haas, S., Müller, T., & Wagner, A. (2025). Gut microbiota-derived metabolites and cardiovascular risk: focus on TMAO and related pathways. Journal of Translational Medicine, 23, 489. https://doi.org/10.1186/s12967-025-04589-1
6. Heianza, Y., Ma, W., Bush, N. C., & Rexrode, K. M. (2024). Long-term changes in plasma trimethylamine N-oxide and coronary heart disease risk. Journal of the American College of Cardiology, 83(6), 512–523. https://doi.org/10.1016/j.jacc.2024.01.012
7. Klingberg, T. D., Fukuda, S., de Vadder, F., Licht, T. R., & Brix, S. (2021). Metagenomic analysis reveals associations between gut microbiota metabolism and trimethylamine N-oxide levels in heart failure patients. International Journal of Cardiology, 334, 131–139. https://doi.org/10.1016/j.ijcard.2021.04.048
8. Liu, S., Zhang, L., & Yang, F. (2025). Circulating trimethylamine-N-oxide is correlated with coronary artery atherosclerotic burden in newly diagnosed CHD. BMC Cardiovascular Disorders, 25, 385. https://doi.org/10.1186/s12872-025-03937-5
9. Niu, K., Liu, H., & Li, X. (2023). Functional metagenomics links cutC and cntA genes to TMAO concentrations in coronary artery disease. Scientific Reports, 13, 17821. https://doi.org/10.1038/s41598-023-17821
10. Oktaviono, Y. H., Isnaini, A., Avissa, F., et al. (2023). The roles of trimethylamine-N-oxide in atherosclerosis: Mechanisms and clinical implications. Frontiers in Cardiovascular Medicine, 10, 1189843. https://doi.org/10.3389/fcvm.2023.1189843
11. Paul, B. J., & Baker, D. L. (2018). Microbial transplantation with human gut commensals containing cutC is sufficient to transmit enhanced platelet reactivity and thrombosis potential. PLoS Biology, 16(11), e2006122. https://doi.org/10.1371/journal.pbio.2006122
12. Pisano, M., Liu, Y., & Chen, J. (2023). Dual presence of cutC and cntA genes amplifies TMAO synthesis in gut microbiota. mSystems, 8(1), e01123-22. https://doi.org/10.1128/mSystems.01123-22
13. Romano, K. A., Vivas, E. I., Amador‑Níñez, D., & Rey, F. E. (2015). Intestinal microbiota composition modulates choline bioavailability from diet and accumulation of TMAO. Journal of Lipid Research, 56(8), 1621–1631. https://doi.org/10.1194/jlr.M059981
14. Simó, C., & García-Cañas, V. (2020). Dietary modulation of gut microbiota and trimethylamine N-oxide: implications for cardiovascular health. Nutrients, 12(9), 2801. https://doi.org/10.3390/nu12092801
15. Tang, W. H. W., & Hazen, S. L. (2015). The gut microbiota: An emerging risk factor for cardiovascular and cerebrovascular disease. Circulation Research.
16. Xie, X., Wu, D., & Gao, Y. (2025). Alternative microbial pathways of TMA production and their impact on TMAO levels. Gut Microbes, 17(1), 218–232. https://doi.org/10.1080/19490976.2025.218231
17. Zhai, R., Wang, Y., & Li, Q. (2024). Metagenomic insights into TMAO-producing gut bacteria in atherosclerosis patients. Frontiers in Microbiology, 15, 10234. https://doi.org/10.3389/fmicb.2024.10234
18. Zhang, L., & Yang, F. (2022). Association of TMAO-producing genes with plasma TMAO levels in atherosclerosis patients. Frontiers in Cardiovascular Medicine, 9, 87234. https://doi.org/10.3389/fcvm.2022.87234
19. Zhang, Q. (2025). Microbial determinants of TMAO production and implications for atherosclerosis. Microbiome, 13, 45. https://doi.org/10.1186/s40168-025-01234-5