Echocardgraphic Assessment of Superior Vena Cava Venous Flow Doppler Velocities in Copd Patients
- NOOR ALI ASFOR , University of Babylon/ College of Medicine& Medical Research Center, Belagavi.
- Ahlam Kadhim Abbood , University of Babylon/ College of Medicine& Medical Research Center, Belagavi.
Article Information:
Abstract:
the Global Initiative for Chronic Obstructive Lung Disease (GOLD 2025), is a progressive respiratory disorder characterized by persistent symptoms including dyspnea, chronic cough, sputum production, and recurrent exacerbations.This study aimed to evaluate superior vena cava (SVC) Doppler flow parameters, including systolic and diastolic velocities, respiratory variation (expiratory/inspiratory s), s/d ratio and atrial reversal to systolic flow (AR/S) ratio, as non-invasive echocardiographic markers for early detection of pulmonary hemodynamic changes and right heart involvement in COPD patients.A case-control study was conducted including 50 COPD patients and 50 age- and sex-matched healthy controls. The study was performed at the Echocardiographic Unit of Merjan Medical City, Babylon Health Directorate, Babylon, Iraq, from 1st of December, 2025 to 20th of April, 2026. Comprehensive echocardiographic assessment was performed with emphasis on SVC Doppler flow measurements, right ventricular function, pulmonary artery pressures, and right atrial volume.The results showed no significant differences between groups regarding age, sex, or body mass index. However, COPD patients had significantly higher body surface area, tricuspid regurgitation velocity, pulmonary artery systolic pressure, and right atrial volume index, with reduced tricuspid annular systolic velocity (S’), while TAPSE and diastolic parameters remained unchanged. Regarding SVC Doppler parameters, inspiratory SVC systolic velocity and SVC diastolic velocity were significantly increased in COPD patients, while expiratory SVC systolic velocity and atrial reversal velocity showed no significant differences. Both the SVC expiratory/inspiratory ratio and SVC S/D ratio were significantly reduced in COPD patients. In conclusion, COPD is associated with significant changes in SVC Doppler flow patterns, reflecting altered venous return and impaired respiratory variation. These findings suggest that SVC Doppler parameters , inspiratory SVC systolic velocity, SVC diastolic velocity ,SVC expiratory/inspiratory ratio and SVCS/D ratio may serve as useful non-invasive markers for early detection of hemodynamic alterations in COPD patients.in the first case, confirming a low-flow vascular lesion.
Keywords:
Article :
INTRODUCTION:
Chronic obstructive pulmonary disease (COPD), as outlined in the Global Initiative for Chronic Obstructive Lung Disease (GOLD) 2025, is a progressive and multifactorial disorder marked by persistent respiratory symptoms such as breathlessness, chronic cough, sputum production, and frequent exacerbations (1). These symptoms are associated with largely irreversible airflow limitation resulting from structural alterations in the airways, including bronchitis and bronchiolitis, or from alveolar destruction characteristic of emphysema (1). Diagnosis of COPD is typically confirmed through spirometry, where a post-bronchodilator FEV1/FVC ratio of less than 0.7 is indicative of persistent airflow obstruction (2).
Pulmonary hypertension(PH) is a frequent complication in COPD patients and serves as a significant prognostic indicator (3), its prevalence across the full spectrum of COPD remains unclear, as most studies have focused on patients with severe disease (4) .
Tricuspid regurgitation is not always visible and present in every patient, and the possibility of confirmation by echocardiography is in 24–66% of the patients. Pulmonary artery pressure is slightly to moderately elevated in patients with more pronounced form of the disease (5)
. In COPD patients, SPAP values correlate with the severity of pulmonary progression, serving as a valuable indicator of disease advancement.(6)
1.2. Superior vena cava
The superior vena cava (SVC) is located in the right upper mediastinum, formed by the confluence of the right and left innominate (or brachiocephalic) veins at the level of the first intercostal space. It descends vertically to the right of the trachea and the ascending aorta (AA), ultimately draining into the superior and posterior aspect of the right atrium (Figure 1). Due to the orientation of its opening, blood entering the right atrium via the SVC is directed toward the tricuspid valve (TV). Unlike the inferior vena cava (IVC), the SVC lacks an ostial valve, and its lower segment is enveloped by the pericardium. Additionally, the SVC is surrounded by lymph nodes, which make it vulnerable to compression and/or invasion, particularly in the context of inflammatory conditions and malignancies(7)
Two-dimensional imaging, along with color and spectral Doppler interrogation, is feasible for visualizing the SVC from multiple echocardiographic windows. The supra-thoracic window provides access to the upper and mid-SVC, while the high left parasternal window offers views of the mid- and lower-SVC. Additional windows, including subcostal, apical, left parasternal right ventricular (RV) inflow, and right parasternal, allow for imaging of the lower SVC and the SVC-right atrial (RA) junction (8)(9)(10)
1.3. Effect of Respiratory variation on SVC flow
Respiratory cycles induce physiological fluctuations in intracardiac hemodynamics, influenced by changes in intrathoracic and intraabdominal pressure, systemic and pulmonary venous return, intrapericardial pressure, and interdependence between the four cardiac chambers. During inspiration, a decrease in intrathoracic and intrapericardial pressures promotes augmented right ventricular filling and stroke volume, while compensatory decreases in left ventricular stroke volume occur due to limited pericardial space. Expiration increases intrathoracic and intrapericardial pressures, leading to a mild reduction in right ventricular.(11)
Inspiration results in lower intrathoracic and intracavitary pressures, facilitating increased blood flow from the vena cava to the right heart, elevated peak velocity, and enhanced time-velocity integral of the S and D waves, while decreasing A-wave reversal.(12). Conversely, expiration, characterized by rising intrathoracic pressure, causes a reduction in systemic venous return, decreases in the velocities of the S and D waves, and an increase in the A-wave, with the most significant changes occurring during the first expiratory beat.(13)
COPD which is a major cause of morbidity and mortality, that leading to pulmonary hypertension (PH) and exacerbates right heart dysfunction. Early and accurate detection of pulmonary hypertension is crucial for improving patient outcomes. SVC systolic flow variation is a sensitive Doppler indicator for detecting PH in COPD patients, particularly its severity. In COPD patients with PH, the expiratory peak systolic flow in the SVC is higher than in those without PH, and a greater expiratory-to-inspiratory flow ratio is associated with more severe PH. This variation can be useful for assessment when conventional echocardiography is limited, as increased expiratory flow may compensate for impaired right ventricular filling caused by PH
SVC flow velocities assessment as poor echo windows in COPD make PH assessment is difficult
Aim of the study:
To evaluate SVC flow parameters variation in COPD and to assess the value of SVC FLOW ratios (S/D, expiratory/inspiratory S and SVC AR/S as non-invasive markers for the early detection and monitoring of increased pulmonary arterial pressure in patients with COPD
Patients and methods:
2.1. Patients
2.1.1 The study Design:
This study is a case-control study conducted among patients with chronic obstructive pulmonary disease (COPD) and healthy controls. A total of 100 participants were enrolled and divided into two groups: Group I included patients with COPD, while Group II included apparently healthy individuals as controls.
2.1.2 Setting and period of the study
This study was conducted at the Echocardiographic Unit of Merjan Medical City, Babil Health Directorate, Babylon, Iraq. Data were collected over a period of five months, from December 1st, 2025 to April 20th, 2026.
2.1.3 calculation of Sample size:
N=Z²*P (1- P)/d²
Where:
N: Sample size.
Z: Level of confidence interval which equals to 1.96.
P: The prevalence of chronic obstructive pulmonary disease in Iraq (15%)(14)d.: Estimated error which equals to 5%.
The number of participants included in the study was lower than initially calculated because of the limited duration available for recruitment.
2.2. The selection criteria
2.2.1 Inclusion criteria
Participants who aged >40 years (Based on age-sex matched±2 for both cases and controls)
Diagnosed with COPD (FEV1/FVC < 0.70) confirmed by spirometry.
2.2.2. Exclusion criteria
Individuals who reject the participating in the current study
Participants who suffering from Severe left heart disease or valvular abnormalities.
Acute exacerbations of COPD or other acute respiratory conditions.
Any condition that affect right side function rather than COPD like liver disease, ASD, lung fibrosis
2.3 Ethical approval
All individuals involved in this study were informed and the agreement was obtained verbally from each one before the collection of samples. This study is approved by the committee on publication ethics at college of medicine, University of Babylon, Iraq (number172 in 15/5/2015
2.4 Data collection methods:
2.4.1 Questionnaire
Information on the samples was gathered by the self-constructed questionnaire. This information comprises a short summary of "age-sex match, weight, height and medical history), Body mass index (BMI) and body surface area (BSA) are calculated using the following formulas:
A- BMI (Body Mass Index) measurement
The following equation was used to count the body mass index values (15)
The BMI ranges for normal category (18.5–24.9) and overweight category (25-29.9) kg/m². If a person's BMI is more than (30) kg/m², they are unquestionably obese (16).
B- Body surface area:
BSA, m² = √ℎ𝑒𝑖𝑔ℎ𝑡 𝑖𝑛 (𝑐𝑚)× 𝑤𝑒𝑖𝑔ℎ𝑡 𝑖𝑛 (𝐾𝑔)
3600 by Mosteller's formula ((17)).
2.4.2The apparatus
2.4.2 Echocardiography
Examination was done by one echo device "Vivid E9-GE, (XD clear GE vingmed-ultrasound Horten, Norway in 2012, LCD17" monitor for two-dimensional echocardiography imaging(2DE) (Figure 2.1). Phased array M5Sc type probe with a frequency of 1.4 – 4.6MHZ and harmonic imaging for the 2DE imaging. measurement and images acquisition followed the recommendations of the European Association of Cardiovascular Imaging (EACVI) and the American Society of Echocardiography(ASE)(18)
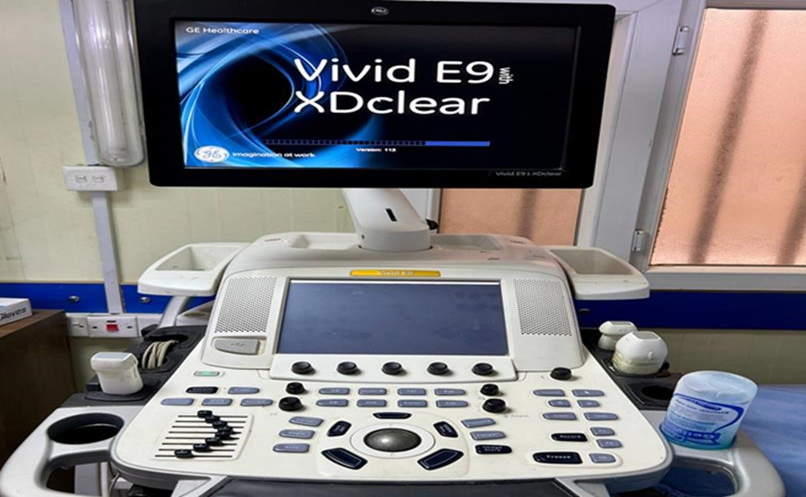
(Figure 2.1): Echocardiography Vivid E9 Xdclear GE device
Methods:
Transthoracic echocardiographic (TTE) examination with the patient first attached to ECG and then laying
on left lateral decubitus position with left hand extended below the head.
The superior vena cava (SVC) flow velocity waveform was recorded using pulsed-wave Doppler imaging from the subcostal long-axis view with the transducer angled towards the head and the patient positioned supine (9). 3- to 5-mm sample volume was placed approximately 10 mm proximal to the junction of the
Right atrium and SVC. The peak systolic forward velocity of SVC flow (SVC-S), peak diastolic forward velocity of SVC flow (SVC-D),peak atrial reversal flow velocity of SVC and the SVC-S/D ratio were measured from the waveforms(12) as in figure2.2 .Standard transthoracic echocardiography was performed, and measurements were obtained at end-expiration and during deep inspiration to evaluate respiratory variation.
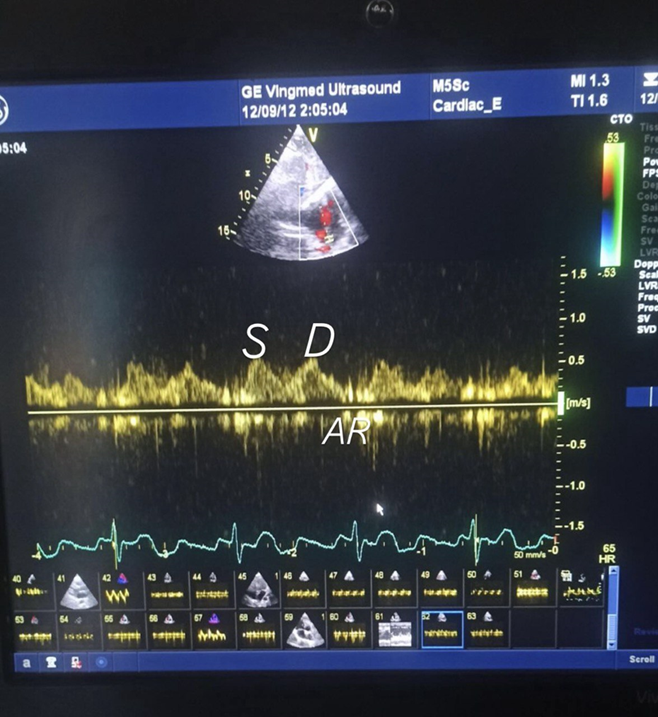
Figure 2.2: PW, Doppler measurement of superior vena cava (SVC) flow velocity
peak systolic lateral annular velocity (S`): Tissue Doppler imaging (TDI) was applied in the pulse-Doppler mode of the tricuspid annulus velocity at its lateral corners with the same echocardiographic unit, and systolic (S) velocity was measured as in figure 2.3(19)
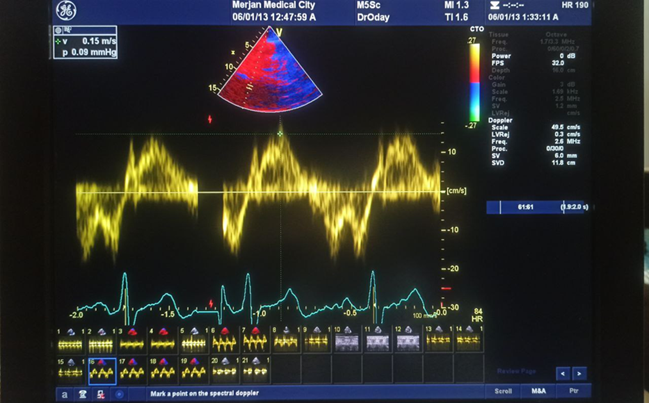
Figure 2.3: TDI, PW Doppler for measurement of RV free wall S'.
The tricuspid annular plane systolic excursion (TAPSE): In the apical four-chamber view, an M-mode beam parallel to the motion of the lateral wall is oriented to cross the lateral portion of the tricuspid annulus, which is the measure of the displacement of the base of the RV towards the apex during systole (normal value of TAPSE=>17 mm). (71) figure 2.4
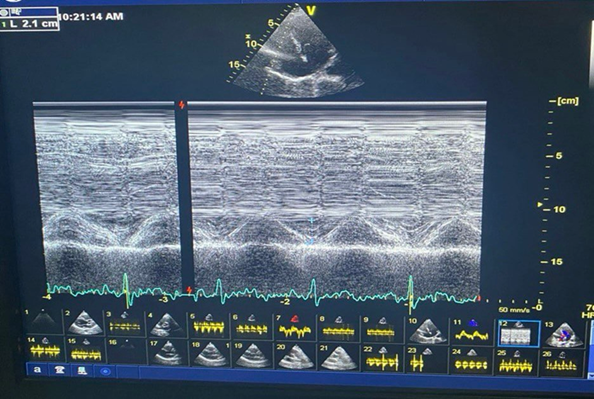
Figure 2.4: M-mode measurement of tricuspid annular plane systolic excursion( TAPSE)
Systolic pulmonary artery pressure (SPAP): The most common method for estimating systolic pulmonary artery pressure (SPAP) involves using the simplified Bernoulli equation to measure the RV right atrium (RA) gradient from peak velocity of the tricuspid valve regurgitation (TR) as in figure 2.5. The RV systolic pressure (RVSP) is then calculated by adding this value to an estimate of the mean RA pressure.
𝑽𝑺𝑷 = 𝟒(𝑽𝑻𝑹)𝟐 + 𝒎𝒆𝒂𝒏 𝑹𝑨 𝒑𝒓𝒆𝒔𝒔𝒖𝒓𝒆
In the absence of pulmonary stenosis or RVOT obstruction, SPAP is considered
equal to RVSP (20).
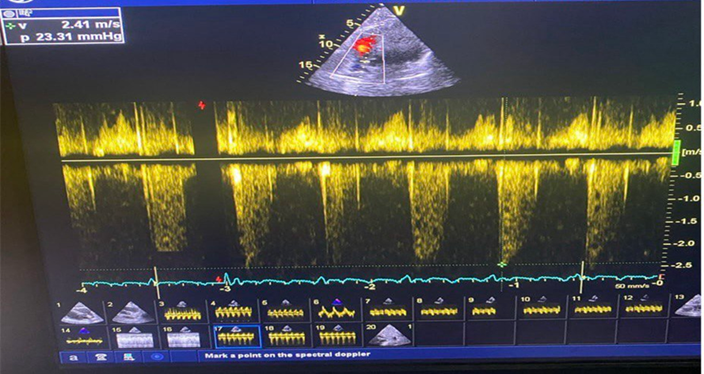
Figure (2.5) CW, Doppler measurement of tricuspid valve velocity.
the pulmonary artery acceleration time (PAAT)
In the parasternal short-axis view, PAAT was measured in milliseconds, from the onset of flow to the peak velocity as in figure 2.6. Additionally, a representative flow velocity profile of the pulmonary artery was recorded from the main pulmonary artery(21)
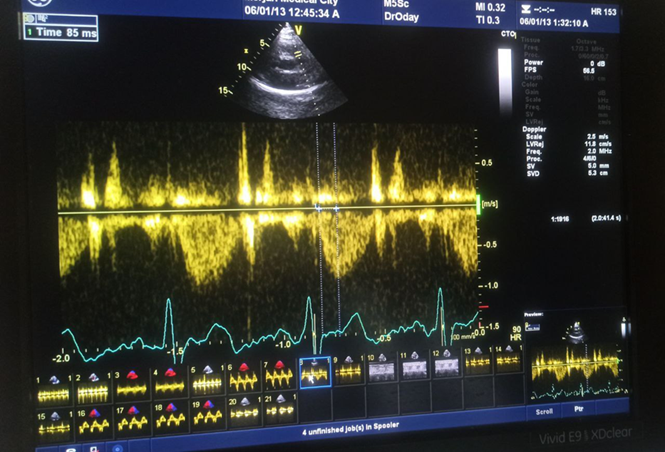
Figure 2.6:PW, Doppler measurement of pulmonary acceleration time (PAAT)
Right atrium:
2 DE volumes are obtained from the dedicated RA-focused apical 4CV view at the end of ventricular systole and can be calculated either by the single plane Simpson’s method(20) as in figure 2.7
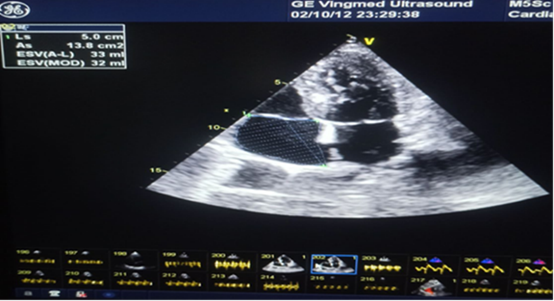
Figure 2.7: Echocardiographic measurement of right atrial volume
Two-dimensional morphological assessment of the right heart and inferior vena cava (IVC)
The inferior vena cava (IVC) dimensions and respiratory variations were evaluated using the subcostal longitudinal view as in figure 2.8. Right atrial pressure (RAP) was estimated as normal (3 mm Hg) when the IVC diameter was 21 mm with greater than 50% collapse, and as elevated (15 mm Hg) when the IVC diameter exceeded 21 mm with less than 50% collapse, following the ASE guidelines (RAP grading) (20). When the IVC diameter and collapse did not fit these criteria, RAP was classified as intermediate (8 mm Hg) (20).
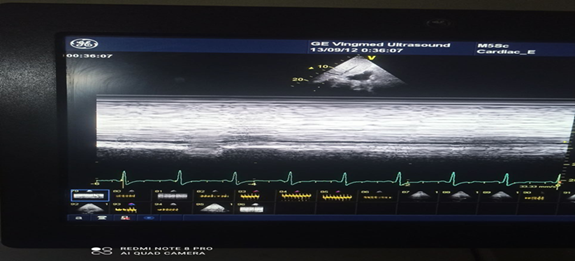
2.8: M- mode measurement of inferior vena cava(IVC) and collapsibility
Assessment of diastolic RV function is less well validated Due to the limited guidelines for assessing right ventricular (RV) diastolic function and its association with several cardiac and systemic conditions, specific RV diastolic parameters were evaluated in this study, PW Doppler of RV inflow and PW-TDI of the TV annulus .(22) The ratio of peak early diastolic tricuspid inflow velocity (tricuspid E) to peak late diastolic tricuspid inflow velocity (tricuspid E/A) was assessed using the modified apical four-chamber view of the right ventricle. Additionally, the early diastolic peak of tricuspid annular velocity was measured, and the ratio of tricuspid E to tricuspid annular velocity (tricuspid E/e’) was subsequently calculated
Tissue Doppler at the lateral tricuspid annulus: RV E′, A′, and E′/A′ should be measured as in figure 2.9. This also permits calculation of the RV E/E`Ratio
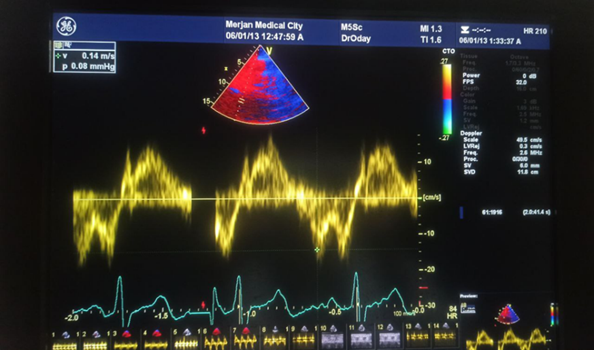
, 2.9: TDI, PW, measurement of lateral RV annulus E`
Doppler interrogation of tricuspid inflow: Early (E) and late (A) trans-tricuspid inflow velocities, E/A ratio, and E deceleration time are recorded using pulsed wave Doppler at the tricuspid leaflet tips. The imaging plane should be optimized to align the beam with tricuspid inflow as in figure 2.10.
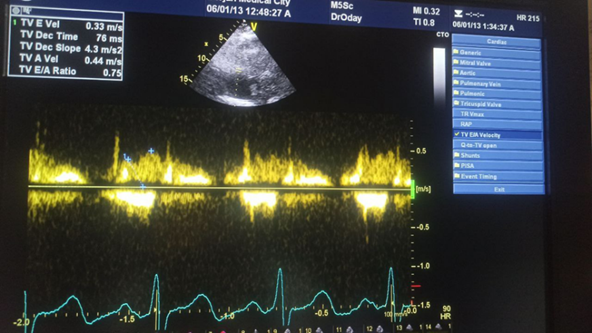
Figure 2.10: PW, Doppler measured inflow of tricuspid wave (E/A ratio)
2.8 Statistical analysis
The data were gathered, condensed, examined, and shown using the statistical software IBM-SPSS version 27 and Microsoft Office Excel 2010. The numeric data were reported as the mean, standard deviation, median, percentile, and range after doing a Kolmogorov-Smirnov normality test and determining if the variables were normally or non-normally distributed. The Mann Witney test was employed to examine the disparity in the average values between two groups, assuming that the variable follows non-normal distribution. ANOVA (Kruskal Wallis test) analysis was conducted to examine the statistical significance of the data using the post hoc test. The chi-square test was employed to examine the relationship between two or more category variables. Receiver Operating Characteristic (ROC) was used in this study. A significance level of less than 0.05 was used to determine statistical significance.
Results: :
In Table 3.1, the results indicate the highest proportion of participants among patients was in the 70–80 years group (36.0%), followed by 40–49 years (24.0%), 60–69 years (22.0%), and 50–59 years (18.0%). The 60-69- and 70-80-years groups (30.0% each) are also the greatest percentage in the control group followed by the 40-49 years and 50-59 years groups (20.0% each). The average age between patients (60.9±13.7 years) and controls (60.9±11.1 years) was not significantly different (P=0.915). With regards to sex distribution, males were the majority in both groups, with 76.0% of the patients and 82.0% of controls, with no statistically significant difference (P=0.461). The majority of patients were overweight (60.0%), then obese (24.0%), and then normal weight (16.0%). The most prevalent type in the control group was overweight (42.0%), which was followed by obesity (34.0%), and normal weight (24.0%). There was no significant difference in the mean BMI values between the patients (27.7±3.0 kg/m 2) and controls (27.9±3.3 kg/m 2) (P=0.448).
Table 3.1. The distribution of Demographic and Anthropometric Characteristics of Patients and Control Groups
|
|
Groups |
P- value |
||||
|
Patients |
Control |
|||||
|
No. |
% |
No. |
% |
|||
|
Age groups |
40-49 years |
12 |
24.0 |
10 |
20.0 |
0.772* |
|
50-59 years |
9 |
18.0 |
10 |
20.0 |
||
|
60-69 years |
11 |
22.0 |
15 |
30.0 |
||
|
70-80 years |
18 |
36.0 |
15 |
30.0 |
||
|
Mean± SD |
60.9±13.7 |
60.9±11.1 |
0.915# |
|||
|
Sex |
Male |
38 |
76.0 |
41 |
82.0 |
0.461* |
|
Female |
12 |
24.0 |
9 |
18.0 |
||
|
BMI categories |
Normal weight |
8 |
16.0 |
12 |
24.0 |
0.197* |
|
Overweight |
30 |
60.0 |
21 |
42.0 |
||
|
Obesity |
12 |
24.0 |
17 |
34.0 |
||
|
Mean± SD |
27.7±3.0 |
27.9±3.3 |
0.448# |
|||
P- value based on chi-square test (*) for categorical variables; while p- value based on Two independent test (#) for numerical data
The COPD patients had a significantly higher mean BSA (1.91±0.21) than controls (1.83±0.09) and the difference between the two was statistically significant (P=0.008). In terms of superior vena cava vein measurements, the inspiratory doppler wave velocity (SvcS insp) was significantly higher in COPD patients (85.29 + 21.59) compared to controls (77.12 +16.58) (P=0.006). But the expiratory doppler wave velocity (SvcS exp) did not show significant differences among COPD patients (63.82±22.99) and controls (70.18±13.49) (P=0.373). COPD patients had significantly larger (P<0.001) SVC vein doppler wave velocity (SvcD) of 63.38±20.59 than the (SvcD) of controls (43.60±10.97). Conversely, the value of the doppler wave velocity (SvcAr) was not significantly different between COPD patients (31.80±7.42) and controls (32.64±7.20), though the values were similar. Expiratory SVC velocity to inspiratory SVC velocity ratio (Svc exp/insp) was also significantly reduced in the COPD patients (0.75±0.28) compared to controls (0.93±0.13) (P<0.001). In the meantime, the ratio of the atrial reversal doppler velocity to systolic doppler velocity (Svc AR/S) was higher in patients than control group (COPD patients (0.69 +0.68) and controls (0.48 +0.11) but statistically not significant (P=0.220). Lastly the Svc S/D ratio was considerably less in COPD (1.10±0.46) than controls (1.69±0.44) (P<0.001). As shown in Table 3.2.
Table 3.2: Comparison of Body Surface Area and Superior vena cava doppler Parameters between Patients with COPD and Controls
|
Parameters |
Groups |
P- value |
|||
|
Mean± SD |
Median |
Q25-Q75 |
|||
|
BSA |
Patients with COPD |
1.91±0.21 |
1.92 |
1.8-2.1 |
0.008** |
|
Control |
1.83±0.09 |
1.86 |
1.8-1.9 |
||
|
SvcS (insp) |
Patients with COPD |
85.29±21.59 |
93.00 |
71.0-102.0 |
0.006** |
|
Control |
77.12±16.58 |
73.00 |
63.0-93.0 |
||
|
SvcS(exp) |
Patients with COPD |
63.82±22.99 |
66.00 |
51.0-82.0 |
0.373 |
|
Control |
70.18±13.49 |
67.00 |
58.0-74.0 |
||
|
SvcD |
Patients with COPD |
63.38±20.59 |
60.00 |
45.0-82.0 |
<0.001** |
|
Control |
43.60±10.97 |
43.00 |
33.0-52.0 |
||
|
SvcAr |
Patients with COPD |
31.80±7.42 |
30.00 |
27.0-35.0 |
0.420 |
|
Control |
32.64±7.20 |
31.00 |
28.0-39.0 |
||
|
Svc (exp)\(insp) |
Patients with COPD |
0.75±0.28 |
0.78 |
0.7-0.9 |
<0.001** |
|
Control |
0.93±0.13 |
0.95 |
0.8-1.0 |
||
|
Svc (AR/S) |
Patients with COPD |
0.69±0.68 |
0.54 |
0.3-0.7 |
0.220 |
|
Control |
0.48±0.11 |
0.51 |
0.4-0.5 |
||
|
Svc S/D |
Patients with COPD |
1.10±0.46 |
1.06 |
0.8-1.4 |
<0.001** |
|
Control |
1.69±0.44 |
1.72 |
1.3-1.8 |
||
*. P value is significant at the 0.05 level (2-tailed).
**. P value is highly significant at the 0.01 level (2-tailed).
In Table 3.3, the patients had slightly lower values of the pulmonary acceleration time (pAAT) (116.84±20.27) than the controls (120.20±13.83) but the difference was not statistically significant (P=0.120). Conversely, the velocity of tricuspid regurgitation (TR) was much greater in patients (1.93±0.60) as compared to controls (1.49±0.31), which was significant (P<0.001). There was no significant difference between patients RV-TAPSE (21.67±4.51) and controls (21.76±2.72), so the tricuspid annular plane systolic excursion (TAPSE) values were almost similar. But, systolic velocity of the tricuspid annulus (S) was much lower in patients (12.06±2.95) than in controls (13.42±2.17) (P=0.001). The size of the inferior vena cava (IVC) was found to be similar in the patients (15.12±2.13) and controls (15.64±2.02), and no significant difference was observed (P=0.382), and the index of collapsibility of the inferior vena cava (IVC) was also similar between the patients(P=0.88). Pulmonary artery systolic pressure (PASP) was significantly higher in patients (20.33±10.19) compared to controls (14.06±4.32) (P=0.003). Meanwhile, there was no significant difference between patients with respect to early diastolic flow velocity (E flow velocity) (56.46±12.58) and controls (55.48±9.07) (P=0.641). Equally, the right ventricular E/A ratio (RVE/A), right ventricular early diastolic annular velocity velocity (Rve` ), and the ratio of right ventricular E/e were not different in patients and controls (P=0.764, 0.821, and 0.300, respectively). Patients (34.47±11.83) and controls (29.78±5.66) had a slightly higher right atrial (RA) volume, which was nearly statistically significant (P=0.052). Right atrial volume index (RA vol index) however, had a significant difference between the two groups (P=0.007) with the right atrial volume index of patients being significantly higher in the patients (19.04±5.67) and controls (16.27±3.00).
Table 3.3: Comparison of Echocardiographic Parameters between Patients and Control Group
|
Parameters |
Groups |
P- value |
|||
|
Mean± SD |
Median |
Q25-Q75 |
|||
|
pAAT |
Patients |
116.84±20.27 |
111.00 |
101.0-130.0 |
0.120 |
|
Control |
120.20±13.83 |
123.00 |
106.0-130.0 |
||
|
TR velocity |
Patients |
1.93±0.60 |
1.80 |
1.4-2.5 |
<0.001* |
|
Control |
1.49±0.31 |
1.50 |
1.3-1.6 |
||
|
TAPSE |
Patients |
21.67±4.51 |
22.00 |
20.0-23.0 |
0.881 |
|
Control |
21.76±2.72 |
22.00 |
20.0-23.0 |
||
|
S |
Patients |
12.06±2.95 |
11.00 |
10.0-13.0 |
0.001* |
|
Control |
13.42±2.17 |
12.00 |
12.0-15.0 |
||
|
IVC Dimension |
Patients |
15.12±2.13 |
15.50 |
14.0-17.0 |
0.382 |
|
Control |
15.64±2.65 |
16.00 |
13.0-18.0 |
||
|
Ivc collapsibility |
Patients |
9.28±2.14 |
9.00 |
8.0-10.0 |
0.880 |
|
Control |
9.20±2.02 |
9.00 |
7.0-10.0 |
||
|
PASP |
Patients |
20.33±10.19 |
18.00 |
12.0-27.0 |
0.003* |
|
Control |
14.06±4.32 |
14.00 |
11.6-15.2 |
||
|
E flow velocity |
Patients |
56.46±12.58 |
54.00 |
49.0-67.0 |
0.641 |
|
Control |
55.48±9.07 |
60.00 |
47.0-62.0 |
||
|
RVE/A |
Patients |
0.98±0.33 |
0.90 |
0.7-1.3 |
0.764 |
|
Control |
0.97±0.27 |
0.80 |
0.8-1.2 |
||
|
RvE' |
Patients |
11.12±4.93 |
10.00 |
8.0-13.0 |
0.821 |
|
Control |
10.28±1.69 |
10.50 |
9.0-11.0 |
||
|
RVE/e` |
Patients |
5.57±2.79 |
4.95 |
3.8-8.0 |
0.300 |
|
Control |
5.53±1.13 |
5.64 |
5.2-6.0 |
||
|
RA volume |
Patients |
34.47±11.83 |
34.00 |
25.0-42.0 |
0.052 |
|
Control |
29.78±5.66 |
30.00 |
26.0-33.0 |
||
|
RA vol index |
Patients |
19.04±5.67 |
19.54 |
14.6-23.4 |
0.007* |
|
Control |
16.27±3.00 |
16.05 |
14.1-18.4 |
||
In Table 3.4, The inspiratory superior vena cava systolic doppler flow velocity (SvcS insp) was very weakly correlated with PASP (r=0.001), RVE/e (r=0.068), TR velocity (r=0.108) and pAAT (r=0.030), all not significant (P>0.05). Likewise, PASP, RVE/e,TR velocity, and pAAT weakly correlated and non-significantly with the expiratory superior vena cava systolic doppler flow velocity (SvcS exp). The superior vena cava diastolic doppler flow velocity (SvcD) was also found to have weak correlations with PASP (r=0.041), RVE/e+ (r=0.073), TR velocity (r=0.092), and pAAT (r=0.137), and did not show any statistically significant relationships (P>0.05). In contrast, the superior vena cava atrial reversal doppler flow velocity (SvcAr) showed a moderate positive and statistically significant correlation with PASP (r=0.488, P<0.001) and TR velocity (r=0.535, P<0.001), indicating that increases in SvcAr were associated with higher PASP and TR velocity values. However, SvcAr showed weak and non-significant correlations with RVE/e′ (r=0.119, P=0.410) and pAAT (r=-0.098, P=0.497).
Table 3.4: Correlation between Superior vena cava doppler Parameters and Selected Echocardiographic Measurements
|
|
PASP |
RVE/e` |
TR velocity |
pAAT |
|
|
SvcS (insp) |
r |
.001 |
.068 |
.108 |
-.030 |
|
p |
.995 |
.638 |
.456 |
.837 |
|
|
SvcS(exp) |
r |
.184 |
-.040 |
.098 |
-.116 |
|
p |
.201 |
.780 |
.497 |
.421 |
|
|
SvcD |
r |
.041 |
.073 |
.092 |
-.137 |
|
p |
.778 |
.612 |
.525 |
.343 |
|
|
SvcAr |
r |
0.488** |
.119 |
0.535** |
-.098 |
|
p |
<0.001 |
.410 |
<0.001 |
.497 |
|
*. Correlation is significant at the 0.05 level (2-tailed).
**. Correlation is highly significant at the 0.01 level (2-tailed).
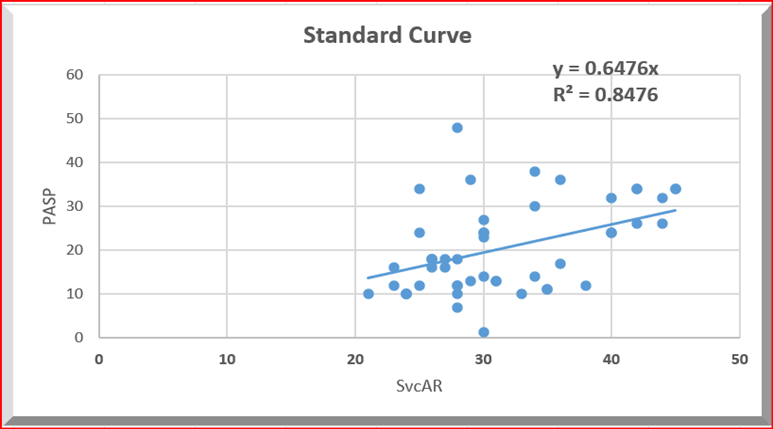
Figure 3.1: Relationship between Superior vena cava atrial reversal doppler flow velocity (SvcAR) and
Pulmonary Artery Systolic Pressure (PASP)
As shown in Figure 3.1, the scatter plot shows the relationship between the superior vena cava atrial reversal velocity(SvcAR) and the pulmonary artery systolic pressure (PASP). The scatter plot reveals a positive linear relationship between the two variables, with high values of SvcAR likely to be related to high levels of PASP. The regression line fitted is of the form y = 0.6476x, indicating that PASP rises by an average of 0.65 points with a one-unit increase in SvcAR. Moreover, the coefficient of determination (R 2 = 0.8476) shows that approximately 84.76 percent of the changes in PASP can be attributed to changes in SvcAR, which is a powerful correlation between these two variables.
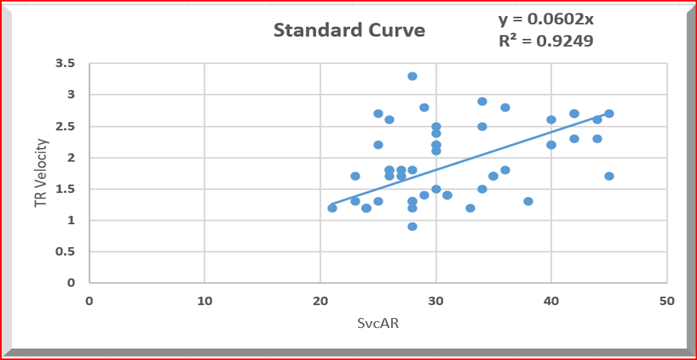
Figure 3.2: Relationship between Superior vena cava atrial reversal (SvcAR) and Tricuspid Regurgitation (TR) Velocity
In Figure 3.2, the data points on the plotted curves show that there is a positive linear relationship with the results, implying that as the values of SvcAR increase, there is a general increase in the values of TR velocity. The regression line fitted can be represented as: y = 0.0602x, meaning that at a one-unit change in the SvcAR, TR velocity changes by an average of 0.06. Further, the coefficient of determination (R2 = 0.9249) indicates that approximately 92.49% of the variability in TR velocity can be attributed to changes in SvcAR implying that there is a very strong correlation between the variables.
In Table 3.5, expiratory to inspiratory Superior vena cava ratio (Svc exp/insp) showed weak correlations with PASP (r=0.196), RVE/e+ (r=0.042), TR velocity (r=0.085) and pAAT (r=0.012), and none of the correlations were statistically significant (P>0.05). Likewise, the ratio of the superior vena cava (Svc AR/S) was found to have weak correlations with PASP (r=0.067), RVE/e + (r=0.147), TR velocity (r=0.154), and pAAT (r=0.0001), with all P- Conversely, the SVC S/D ratio exhibited very weak correlations with all parameters (PASP r = 0.114, TR r = 0.13, E/E′ r = −0.138, PAAT r = −0.05).
Table 3.5: Correlation between Superior vena cava Ratios and Echocardiographic Parameters
|
|
PASP |
RVE/e` |
TR velocity |
pAAT |
|
|
svc(exp)\(insp) |
r |
0.196 |
-0.042 |
0.085 |
0.012 |
|
P |
0.172 |
0.772 |
0.557 |
0.935 |
|
|
svc(AR/S) |
r |
0.067 |
0.147 |
0.154 |
0.0001 |
|
P |
0.644 |
0.310 |
0.287 |
0.997 |
|
|
svcS/D |
r |
0.114 |
-0.138 |
0.13 |
-0.05 |
|
P |
0.431 |
0.339 |
0.929 |
0.971 |
|
In Table (3.6) and Figure (3.3), Receiver Operating Characteristic-Area under Curve Analysis discovered that Svc S exhibited acceptable diagnostic efficiency (sensitivity: 66.0%, specificity: 54.0%), (AUC 0.659) (95% CI: 0.551- 0.767; p=0.006).
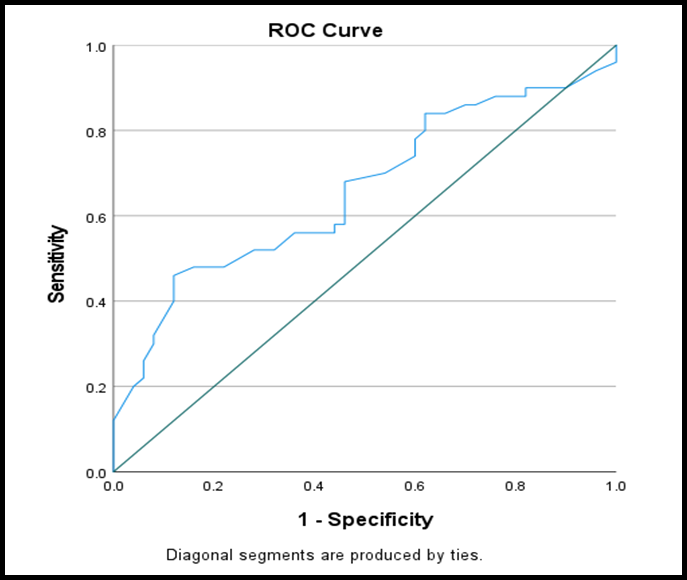
Figure (3.3): ROC curve of Svc S (inspiration)
Table (3.6): Receiver Operating Characteristic-Area under Curve Analysis of the Svc S
|
ROC Analysis (Cutoff Point =77.5) |
||
|
Svc S (inspiration) |
Sensitivity % |
66.0% |
|
Specificity % |
54.0% |
|
|
AUC (95% CI) |
0.659 (0.551- 0.767) "Acceptable" |
|
|
P. value |
0.006* |
|
In Table (3.7) and Figure (3.4), Receiver Operating Characteristic-Area under Curve Analysis discovered that Svc D exhibited fair diagnostic efficiency (sensitivity: 76.0%, specificity: 60.0%), (AUC 0.782) (95% CI: 0.692- 0.871; p<0.001).
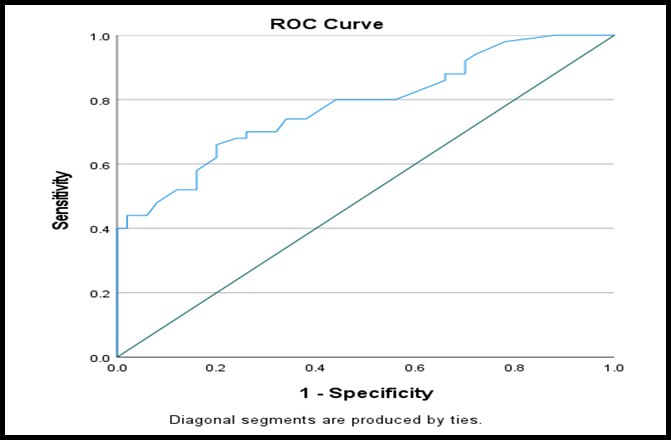
Figure (3.4): ROC curve of Svc D
Table (3.7): Receiver Operating Characteristic-Area under Curve Analysis of the Svc D
|
ROC Analysis (Cutoff Point =44.5) |
||
|
Svc D |
Sensitivity % |
76.0% |
|
Specificity % |
60.0% |
|
|
AUC (95% CI) |
0.782 (0.692- 0.871) "Fair" |
|
|
P. value |
<0.001* |
|
In Table (3.8) and Figure (3.5), Receiver Operating Characteristic-Area under Curve Analysis discovered that Svc S/D exhibited good diagnostic efficiency (sensitivity: 82.0%, specificity: 68.0%), (AUC 0.821) (95% CI: 0.740- 0.902; p<0.001).
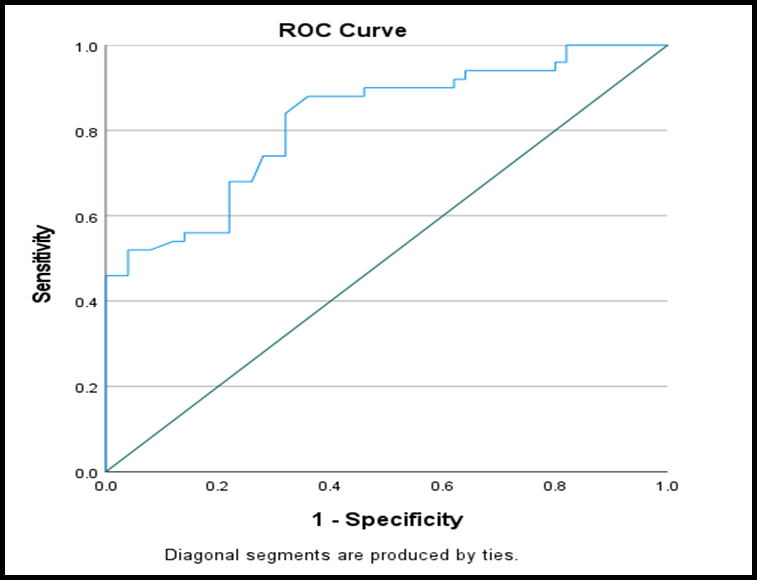
Figure (3.5): ROC curve of Svc S/D
Table (3.8): Receiver Operating Characteristic-Area under Curve Analysis of the Svc S/D
|
ROC Analysis (Cutoff Point =1.46) |
||
|
Svc S/D |
Sensitivity % |
82.0% |
|
Specificity % |
68.0% |
|
|
AUC (95% CI) |
0.821 (0.740- 0.902) "Good" |
|
|
P. value |
<0.001* |
|
In Table (3.9) and Figure (3.6), Receiver Operating Characteristic-Area under Curve Analysis discovered that Svc (exp)\(insp) exhibited good diagnostic efficiency (sensitivity: 80.0%, specificity: 70.0%), (AUC 0.766) (95% CI: 0.673- 0.860; p<0.001).
Figure (3.6): ROC curve of Svc (exp)\(insp)
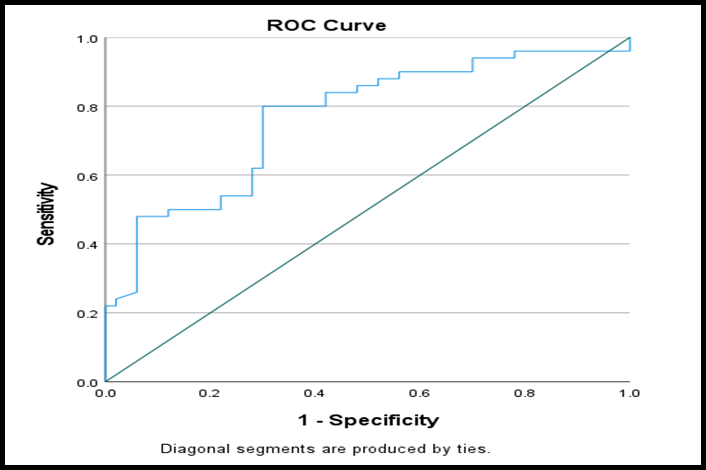
Table (3.9): Receiver Operating Characteristic-Area under Curve Analysis of the Svc (exp)\(insp)
|
ROC Analysis (Cutoff Point =0.890) |
||
|
Svc (exp)\(insp) |
Sensitivity % |
80.0% |
|
Specificity % |
70.0% |
|
|
AUC (95% CI) |
0.766 (0.673- 0.860) "Good" |
|
|
P. value |
<0.001 |
|
In Table(3.10) and Figure(3.7), Receiver Operating Characteristic–Area Under the Curve (ROC-AUC) analysis revealed that the AR/S ratio demonstrated limited diagnostic performance (sensitivity: 60.0%, specificity: 32.0%), with an AUC of 0.580 (95% CI: 0.453–0.689; P = 0.220), indicating an acceptable but statistically non-significant discriminative ability.
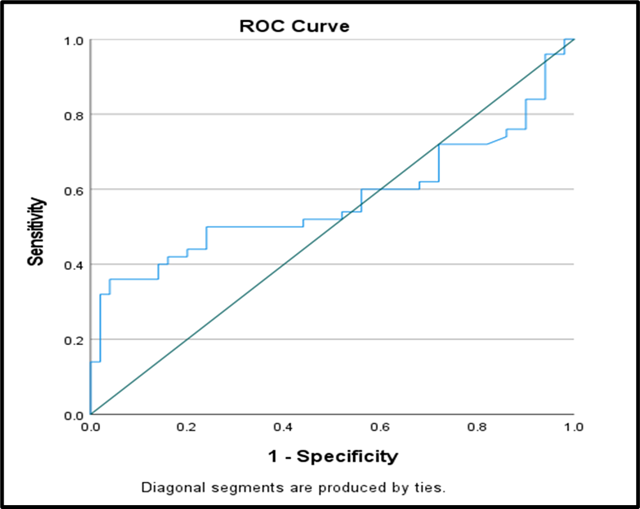
Figure (3.7): ROC curve of Svc (AR/S)
Table (3.10): Receiver Operating Characteristic-Area under Curve Analysis of the Svc AR/S
|
ROC Analysis (Cutoff Point =0.447) |
||
|
AR/S ratio |
Sensitivity % |
60.0% |
|
Specificity % |
32.0% |
|
|
AUC (95% CI) |
0.580 (0.453- 0.689) "Acceptable" |
|
|
P. value |
0.220 |
|
Discussion:
The baseline demographic variables, including age, gender, and body mass index (BMI), did not differ significantly between COPD patients and the control group, indicating that both groups were well matched. However, Body Surface Area (BSA) demonstrated a statistically significant difference (P = 0.008), which may be attributed to the anthropometric alterations commonly associated with COPD. Chronic respiratory disease is often accompanied by metabolic disturbances and unintended weight loss, leading to reductions in body size parameters such as BSA. This finding highlights the importance of using indexed echocardiographic measurements, such as the Right Atrial Volume Index (RAVI), to account for variations in body size. Adjusting for BSA helps to minimize the confounding effect of cachexia frequently observed in advanced COPD, thereby allowing a more accurate evaluation of cardiac structural changes that is independent of overall body size. The present analysis revealed a significant increase in SVC Doppler flow systolic velocity during inspiration in COPD patients compared with healthy individuals .This observation can be interpreted in light of the altered respiratory mechanics characteristic of COPD. Airflow limitation and lung hyperinflation in these patients require greater inspiratory effort to overcome elevated airway resistance. As a result, a more pronounced negative intrathoracic pressure is generated during inspiration, which enhances the pressure gradient toward the right atrium. This, in turn, facilitates venous return through the superior vena cava and leads to higher flow velocities. Such respiratory-related variations in venous flow have been documented in previous studies investigating the interaction between intrathoracic pressure changes and systemic venous hemodynamics. The current results are in line with those reported by Yoshida et al(23). who identified significant respiratory variation in SVC Doppler flow velocities, particularly during the inspiratory phase. However, in contrast to their work, which focused mainly on physiological responses in a general population, the present study specifically targeted patients with COPD and demonstrated a more marked increase in inspiratory SVC velocity. This difference could be explained by the altered intrathoracic pressure dynamics and lung hyperinflation characteristic of COPD. Despite this agreement, direct comparison between the two studies should be approached with caution due to differences in study design, patient populations, and the lack of disease-specific evaluation in the earlier study. The present findings are agreement with those reported by Kunichika et al(24). (2002, who investigated SVC Doppler flow patterns in COPD patients with and without pulmonary hypertension. Their results showed a significant increase in expiratory SVC velocities, particularly among patients with pulmonary hypertension, and emphasized the link between respiratory variation and right heart hemodynamics.
However, a notable difference exists between their findings and the current study. While Kunichika et al. highlighted expiratory flow augmentation in relation to pulmonary hypertension, the present study demonstrated a more pronounced increase in inspiratory SVC velocity. This variation may be explained by differences in patient characteristics, especially regarding COPD severity and the presence of pulmonary hypertension. In more advanced stages of the disease or in patients with pulmonary hypertension, right ventricular impairment may restrict the expected increase in venous return during inspiration, thereby shifting the pattern toward expiratory predominance. In contrast, the inspiratory predominance observed in this study may indicate relatively preserved right ventricular function or an exaggerated compensatory response to increased negative intrathoracic pressure. SVC Doppler evaluation can serve as a useful non-invasive tool for assessing right heart function and understanding venous return dynamics in these patients.
The mean SVC Ar velocity of patient and control groups was Statistical analysis revealed no significant difference between the two groups(P=0.420), suggesting that COPD does not markedly affect SVC Ar velocities in the studied population. The mean SVC S(expiration) velocity in COPD patients healthy controls . Statistical analysis indicated no significant difference between the groups (P = 0.373), suggesting that systolic SVC velocities during expiration are relatively preserved in COPD patients compared to healthy individuals. The present study demonstrated a statistically significant reduction in the SVC expiratory-to-inspiratory (Exp/Insp) ratio in COPD patients compared to healthy controls (0.75 ± 0.28 vs 0.93 ± 0.13, P = 0.001). This finding indicates an alteration in the normal respiratory variation of venous return in COPD patients. Under physiological conditions, SVC flow increases during inspiration due to negative intrathoracic pressure, while expiration leads to a relative reduction in flow. However, in COPD, chronic airflow limitation and lung hyperinflation significantly modify intrathoracic pressure dynamics, particularly by increasing positive pressure during expiration and reducing the normal inspiratory–expiratory gradient. As a result, the expected variation in SVC flow becomes blunted or altered, leading to a lower Exp/Insp ratio. This is consistent with previous studies that demonstrated that respiratory variation in SVC flow is closely related to intrathoracic pressure changes and pulmonary hemodynamics in COPD patients. Furthermore, Kunichika et al. (2002) reported that the Exp/Insp ratio correlates with pulmonary hypertension and right heart hemodynamics, suggesting that altered respiratory variation in SVC flow may reflect early hemodynamic impairment in COPD. The reduction in the SVC Exp/Insp ratio observed in the present study is further supported by more recent investigations into cardiopulmonary interactions in COPD. A study by Rahman et al. (2019)(25) demonstrated that COPD is associated with significant alterations in venous return dynamics, particularly in relation to the severity of emphysema. Using advanced 4D flow MRI, the authors reported that increased intrathoracic pressure and lung hyperinflation impair normal venous return and are associated with abnormal flow patterns in the superior vena cava. These changes can disrupt the normal respiratory variation in venous flow, leading to altered inspiratory–expiratory relationships, as reflected by a reduced Exp/Insp ratio in COPD patients. This supports the concept that SVC flow parameters may serve as sensitive indicators of early hemodynamic impairment and disease severity. The SVC diastolic Doppler velocity (SvcD) was significantly higher in COPD patients compared to the control group (P < 0.001).. This result indicates a noticeable difference in diastolic flow patterns between the two groups, suggesting that COPD may influence venous return and right atrial filling during diastole.
The current study showed a significant rise in SVC diastolic velocity (SvcD) accompanied by a notable decrease in the S/D ratio, reflecting a shift toward diastolic-dominant venous flow. Normally, systolic flow is the predominant component in the superior vena cava, but in COPD patients, this pattern suggests changes in right heart hemodynamics, including increased preload and reduced right ventricular compliance. These observations align with previous research indicating that a lower S/D ratio corresponds to diastolic wave predominance, often associated with elevated right atrial pressure and altered filling dynamics(26). Similar diastolic dominance has been described in conditions of right heart dysfunction, where impaired systolic forward flow leads to compensatory increases in diastolic filling(27). Studies focusing specifically on COPD patients have also reported enhanced diastolic components of SVC flow, supporting the present findings(40). Many earlier studies were limited by focusing solely on S/D ratios, analyzing heterogeneous cardiac populations, or lacking COPD-specific evaluation. By examining both absolute SvcD and the S/D ratio, this study provides additional insight into right heart filling patterns in COPD, particularly in earlier or compensated stages of the disease.
The present study showed the SVC AR/S is higher in patient group but statistically not significant difference between COPD patients and the control group (P = 0.220). This finding suggests that right atrial pressure despite remains relatively within normal limits in the studied population, with no clear evidence of significant right atrial hemodynamic compromise but still there is noticeable increment of this ratio in patients group . Physiologically, the atrial reversal (AR) wave reflects backward flow into the SVC during right atrial contraction, and its relationship to the systolic (S) wave is influenced by right atrial pressure and compliance. The absence of a statistically significant change in the AR/S ratio may indicate preserved right atrial function and compliance in these patients and the need for larger sample size to clarify a statistical significant difference .
This observation is supported by previous studies demonstrating that right atrial pressure often remains within normal or mildly elevated ranges in stable or early-stage COPD, with more pronounced abnormalities typically occurring in advanced disease or in the presence of pulmonary hypertension (Ommen et al., 2000)(28). Therefore, the lack of significant difference in the AR/S ratio in the present study may reflect relatively compensated right heart function in the studied group besides the small sample size of study.
Additional right heart parameters revealed several important findings. Pulmonary artery systolic pressure (PASP) was significantly higher in COPD patients compared to controls( P = 0.003), and tricuspid regurgitation (TR) velocity was also increased in patient group (P < 0.001), indicating elevated pulmonary pressures. In contrast, pulmonary artery acceleration time (PAAT) showed no significant difference between the two groups (116.84 ± 20.27 vs 120.20 ± 13.83 ms, P = 0.120).
Assessment of right ventricular systolic function demonstrated similar TAPSE values in both groups, P = 0.881), suggesting preserved global systolic function. However, tissue Doppler S’ velocity was significantly lower in COPD patients (P = 0.001), which may reflect early subclinical right ventricular systolic dysfunction and s` is better than TAPSE in demonstrating RV systolic function((29).
Inferior vena cava (IVC) diameter and collapsibility were comparable between the groups, indicating similar right atrial preload. Additionally, diastolic and right ventricular filling parameters, including E wave velocity, RV E/A ratio, RV E’, and RVE/e’, were preserved, suggesting maintained diastolic function.
Right atrial (RA) volume showed a borderline increase in COPD patients (34.47 ± 11.83 vs 29.78 ± 5.66 mL, P = 0.052), while the right atrial volume index was significantly higher (19.04 ± 5.67 vs 16.27 ± 3.00 mL/m², P = 0.007), indicating early right atrial remodeling likely due to chronic pressure load.
Overall, these findings suggest early alterations in right heart hemodynamics and venous return in stable COPD patients, with preservation of several functional parameters, consistent with findings reported in early or compensated stages of the disease.
The present study evaluated correlations between various SVC Doppler indices and key echocardiographic parameters in patients with COPD. SVC inspiratory velocity showed a strong positive correlation with E/E′ (r = 0.680), highlighting a significant relationship with right ventricular filling pressures, likely influenced by ventricular interdependence and altered preload. Its correlation with PASP (r = 0.01) and TR velocity (r = 0.108) was negligible or weak, indicating minimal association with right-sided pressures, while a weak negative correlation with PAAT (r = −0.30) suggested a minor link to pulmonary vascular resistance.
SVC expiratory velocity s and (SvcD) demonstrated generally weak correlations with all parameters, including PASP , TR velocity , PAAT and RV E/E′ ,this weak correlation may reflect the need for larger sample size and could explain the a minor link to pulmonary vascular resistance and RV pressure ,up to our knowledge no previous studies studied the link between the mentioned parameters.
The SVC atrial reversal (AR) wave displayed moderate positive correlations with right-sided parameters, including PASP (r = 0.488) and TR velocity (r = 0.535), indicating that AR may better reflect right atrial and pulmonary pressures. Its correlation with E/E′ (r = 0.119) and PAAT (r = −0.098) was weak, suggesting minimal interaction with right heart filling or pulmonary vascular resistance. The SVC expiratory-to-inspiratory (Exp/Insp) velocity ratio had weak correlations across all parameters (PASP r = 0.196, TR r = 0.085, E/E′ r = −0.042, PAAT r = 0.012), implying it mainly reflects respiratory variation rather than intrinsic cardiac function.
Finally, the SVC AR/S ratio showed a moderate positive correlation with PASP (r = 0.67), indicating its potential as a reliable marker of right atrial and pulmonary pressures, while correlations with TR velocity (r = 0.154), E/E′ (r = 0.147), and PAAT (r = 0.00) were weak or absent. In contrast, the SVC S/D ratio exhibited very weak correlations with all parameters (PASP r = 0.114, TR r = 0.13, E/E′ r = −0.138, PAAT r = −0.05), this could be because of limited sample size .
among the evaluated SVC parameters in distinguishing COPD patients from healthy controls.
For SVC S (inspiration), the AUC was 0.659 with sensitivity of 66.0% and specificity of 54.0%, indicating acceptable diagnostic efficiency at the selected cutoff point. Despite statistical significance, this parameter showed relatively limited diagnostic performance when used alone (30).
SVC D demonstrated fair diagnostic performance, with an AUC of 0.782, sensitivity of 76.0%, and specificity of 60.0%. This suggests that diastolic venous flow may be more sensitive to hemodynamic alterations in COPD, particularly those related to right atrial filling and venous return .(30)
The SVC S/D ratio showed good diagnostic performance, with an AUC of 0.821, sensitivity of 82.0%, and specificity of 68.0%, representing the highest diagnostic efficiency among the studied parameters. This highlights the importance of combined indices reflecting both systolic and diastolic components.
Similarly, the SVC (exp/insp) ratio demonstrated good diagnostic performance (AUC 0.766, sensitivity 80.0%, specificity 70.0%), supporting the role of respiratory variation in assessing venous return dynamics in COPD patients.
In contrast, the AR/S ratio showed acceptable but limited diagnostic performance, with an AUC of 0.580, sensitivity of 60.0%, specificity of 32.0%, and a non-significant p-value (P = 0.220) , indicating reduced reliability in differentiating between COPD patients and healthy controls.
Overall, parameters combining systolic and diastolic components, such as SVC S/D and SVC (exp/insp), demonstrated better diagnostic performance compared to isolated indices, supporting the use of a multiparametric approach in the evaluation of cardiopulmonary changes in COPD.
Conclusion:
COPD patients demonstrated early functional and hemodynamic abnormalities.
Svc Doppler parameters showed significant variation in copd pt as inspiratory SVC peak systolic flow velocity and diastolic velocity are increased in COPD patients. The valuable role of SVC-AR from the significant correlation with Tr velocity and PASP so SVC-AR may be alternative role for reflecting pulmonary artery pressure in case of poor acoustic window in copd patients
according to good results regarding the AUC and high sensitivity of expS/Insp s and S/D , they could demonstrated good diagnostic performance while AR/S was with fair value .
Overall, parameters combining systolic and diastolic components, such as SVC S/D and SVC (exp/insp), demonstrated better diagnostic performance compared to isolated indices, supporting the use of a multiparametric approach in the evaluation of cardiopulmonary changes in COPD.
from RVsystolic and diastolic parameters that showed no significant differences, despite evidence of early subclinical dysfunction demonstrated by reduced S’,suggesting preserved global diastolic function in the studied population. these findings suggest that COPD is associated with early pulmonary vascular changes, and significant alterations in SVC flow dynamics, even in the absence of overt right ventricular dysfunction on conventional echocardiography.
Recommendation
-It is recommended that comprehensive echocardiographic evaluation OF superior vena cava Doppler flow indices be routinely performed in patients with chronic obstructive pulmonary disease to enable early detection of subclinical cardiopulmonary alterations.
- Further studies with larger sample sizes and longitudinal follow-up are recommended to validate the diagnostic and prognostic value of superior vena cava Doppler parameters in assessing disease progression and development of pulmonary hypertension so could be a substitute for conventional echocardiographic assessment for PASP especially in COPD patients with poor window .
References :
1. Idrees MM, Habis YZ, Jelaidan I, Alsowayan W, Almogbel O, Alasiri AM, et al. Optimizing Interdisciplinary Referral Pathways for Chronic Obstructive Pulmonary Disease Management Across Cardiology and Pulmonology Specialties in the Kingdom of Saudi Arabia. Vol. 14, Journal of Clinical Medicine. 2025. p. 8865.
2. 2024, 2025 Global Initiative for Chronic Obstructive Lung Disease; Chroanic Obstructive Lung Disease–GOLD: Deer Park, IL, USA, 2025; . 2025; Available from: https://goldcopd.org/2025-gold-report/
3. García AR, Piccari L. Emerging phenotypes of pulmonary hypertension associated with COPD: a field guide. Curr Opin Pulm Med. 2022;28(5):343–51.
4. Gupta NK, Agrawal RK, Srivastav AB, Ved ML. Echocardiographic evaluation of heart in chronic obstructive pulmonary disease patient and its co-relation with the severity of disease. Lung India. 2011 Apr;28(2):105–9.
5. Blanco I, Tura-Ceide O, Peinado VI, Barberà JA. Updated Perspectives on Pulmonary Hypertension in COPD. Int J Chron Obstruct Pulmon Dis. 2020;15:1315–24.
6. Aurangabadkar GM, Lanjewar A V, Jadhav US, Ali SN, Wagh PB, Lanjewar A, et al. Evaluation of pulmonary hypertension in chronic obstructive pulmonary disease. Cureus. 2022;14(2).
i. Gray H, Standring S E. Gray’s Anatomy: The Anatomical Basis of Clinical Practice. 42nd ed. Elsevier; 2020.
7. Ugalde D, Haruel PA, Godement M, Prigent A, Vieillard-Baron A. Transthoracic echocardiography to evaluate the superior vena cava in critically ill patients: window description and pilot study. Intensive Care Med. 2019;45(7):1052–4.
8. Mitchell C, Rahko PS, Blauwet LA, Canaday B, Finstuen JA, Foster MC, et al. Guidelines for performing a comprehensive transthoracic echocardiographic examination in adults: recommendations from the American Society of Echocardiography. J Am Soc Echocardiogr. 2019;32(1):1–64.
9. Ma Q, Ji J, Shi X, Lu Z, Xu L, Hao J, et al. Clinical validation of superior vena cava respiratory variation in predicting fluid responsiveness using transthoracic echocardiography technique: a pilot study. Arch Med Sci AMS. 2022;18(4):1118.
10. Kreit J. Respiratory-Cardiovascular Interactions During Mechanical Ventilation: Physiology and Clinical Implications. Compr Physiol. 2022 Apr;12(3):3425–48.
11. Murayama M, Kaga S, Okada K, Iwano H, Nakabachi M, Yokoyama S, et al. Clinical utility of superior vena cava flow velocity waveform measured from the subcostal window for estimating right atrial pressure. J Am Soc Echocardiogr. 2022;35(7):727–37.
12. Reynolds T, Appleton CP. Doppler Flow Velocity Patterns of the Superior Vena Cava, Inferior Vena Cava, Hepatic Vein, Coronary Sinus, and Atrial Septal Defect: A Guide for the Echocardiographer. J Am Soc Echocardiogr [Internet]. 1991;4(5):503–12. Available from: https://www.sciencedirect.com/science/article/pii/S0894731714803866
13. Al Lami F, Salim Z. Prevalence and determinants of chronic obstructive pulmonary disease among a sample of adult smokers in Baghdad, Iraq, 2014. East Mediterr Heal J = La Rev sante la Mediterr Orient = al-Majallah al-sihhiyah li-sharq al-mutawassit. 2017 Mar;23(2):67–72.
14. Centers for Disease Control and prevention. Calculating Body Mass Index. 2024;
15. Kim CS, Han KD, Choi HS, Bae EH, Ma SK, Kim SW. Association of body mass index and waist circumference with all-cause mortality in hemodialysis patients. J Clin Med. 2020;9(5):1289.
16. Pelletier KJ. A Quick and Reliable Mental Formula to Calculate the BSA of a Patient. J Extra Corpor Technol. 2022 Sep;54(3):255–6.
17. ASE’s Comprehensive Echocardiography Textbook 3rd Edition. 2022; Available from: https://aselearninghub.org/topclass/topclass.do?expand-OfferingDetails-Offeringid=2606
18. İnci S, Erol MK, Bakırcı EM, Hamur H, Değirmenci H, Duman H, et al. Effect of percutaneous mitral balloon valvuloplasty on right ventricular functions in mitral stenosis: short- and mid-term results. Anatol J Cardiol. 2015 Apr;15(4):289–96.
19. Rudski LG, Lai WW, Afilalo J, Hua L, Handschumacher MD, Chandrasekaran K, et al. Guidelines for the echocardiographic assessment of the right heart in adults: a report from the American Society of Echocardiography: endorsed by the European Association of Echocardiography, a registered branch of the European Society of Cardiology, and . J Am Soc Echocardiogr. 2010;23(7):685–713.
20. Koestenberger M, Grangl G, Avian A, Gamillscheg A, Grillitsch M, Cvirn G, et al. Normal Reference Values and z Scores of the Pulmonary Artery Acceleration Time in Children and Its Importance for the Assessment of Pulmonary Hypertension. Circ Cardiovasc Imaging. 2017 Jan;10(1).
21. Zaidi A, Knight DS, Augustine DX, Harkness A, Oxborough D, Pearce K, et al. Echocardiographic assessment of the right heart in adults: a practical guideline from the British Society of Echocardiography. Echo Res Pract. 2020 Feb;7(1):G19–41.
22. Yoshida H, Shukuya M, Takaoka N, Morooka S, Inagaki M, Doba N, et al. [Respiratory changes in the blood flow pattern of the superior vena cava in patients with chronic obstructive pulmonary diseases]. Nihon Ronen Igakkai Zasshi. 1993 May;30(5):369–75.
23. Kunichika N, Miyahar N, Harada M, Tanimoto M. Respiratory variation in superior vena cava flow in patients with chronic obstructive pulmonary disease: estimation of pulmonary hypertension using Doppler flow index. J Am Soc Echocardiogr. 2002 Oct;15(10 Pt 2):1165–9.
24. Rahman O, Markl M, Balte P, Berhane H, Blanken C, Suwa K, et al. Reproducibility and Changes in Vena Caval Blood Flow by Using 4D Flow MRI in Pulmonary Emphysema and Chronic Obstructive Pulmonary Disease (COPD): The Multi-Ethnic Study of Atherosclerosis (MESA) COPD Substudy. Radiology. 2019 Sep;292(3):585–94.
25. Murayama M, Kaga S, Onoda A, Nishino H, Yokoyama S, Goto M, et al. Head-to-Head Comparison of Hepatic Vein and Superior Vena Cava Flow Velocity Waveform Analyses for Predicting Elevated Right Atrial Pressure. Ultrasound Med Biol. 2024 Sep;50(9):1352–60.
26. Ghio S, Recusani F, SebAastiani R, Klersy C, Raineri C, Campana C, et al. Doppler velocimetry in superior vena cava provides useful information on the right circulatory function in patients with congestive heart failure. Echocardiography. 2001 Aug;18(6):469–77.
27. Ommen SR, Nishimura RA, Hurrell DG, Klarich KW. Assessment of right atrial pressure with 2-dimensional and Doppler echocardiography: a simultaneous catheterization and echocardiographic study. Mayo Clin Proc. 2000 Jan;75(1):24–9.
28. Hameed A, Condliffe R, Swift AJ, Alabed S, Kiely DG, Charalampopoulos A. Assessment of Right Ventricular Function-a State of the Art. Curr Heart Fail Rep. 2023 Jun;20(3):194–207.
29. Çorbacıoğlu ŞK, Aksel G. Receiver operating characteristic curve analysis in diagnostic accuracy studies: A guide to interpreting the area under the curve value. Turkish J Emerg Med [Internet]. 2023;23(4). Available from: https://journals.lww.com/tjem/fulltext/2023/23040/receiver_operating_characteristic_curve_analysis.1.aspx