Statistical Relationship Between Drought and Groundwater Characteristics in Al-Alam District
- Maryam Firas Hassan , Department of Geography, College of Education for Humanities, Tikrit University, Iraq
- Muhammad Atiya Saleh , Department of Geography, College of Education for Humanities, Tikrit University, Iraq
Article Information:
Abstract:
Drought is an important climatic and environmental phenomenon that directly affects water resources, especially groundwater. A decline in rainfall, rising temperatures, and increased evaporation rates lead to a reduction in the natural recharge of groundwater reservoirs, which in turn affects both its quantity and quality. Drought also influences the physical and chemical features of groundwater as a result of increasing salts and dissolved elements concentration, as well as reducing groundwater recharge rates. Chapter three addresses the concept of drought and the methods which used to measure it through several climatic and hydrological indicators, such as the Reconnaissance Drought Index (RDI) and the Standardized Precipitation Index (SPI). These indicators rely on the relationship between rainfall and evaporation to determine drought intensity and duration. Groundwater is one of the most important water resources in the study area, especially in arid and semi-arid regions such as Al-Alam district, where the population and agricultural activities depend on it as a supplementary or alternative source to surface water. The quality features of groundwater are affected by several factors, the most important of which are geological formations, groundwater depth, the residence time of water in the aquifer, and climatic conditions, particularly drought, which leads to increased salt concentration and higher chemical properties such as pH. Therefore, studying the statistical relationship between drought and some chemical properties of groundwater helps in understanding how climatic conditions affect groundwater quality in the study area.
Keywords:
Article :
INTRODUCTION:
Multiple linear regression is one of the most important statistical methods used in environmental and hydrogeological studies. It aims to measure the combined effect of several independent variables on a single dependent variable and to identify the nature of the relationships between them in a precise quantitative manner. This method is also used to locate the variables that have the greatest influence on the studied phenomenon and to measure the contribution of each variable in explaining variance in the dependent variable, in addition to testing the statistical significance and explanatory power of the model [1].
In this study, multiple linear regression were used to assess how much the chemical components of groundwater affect drought, and to pinpoint the elements most strongly linked and influential. This involved feeding all the chemical elements into a single statistical model, which helps reveal each element's true impact after accounting for statistical interactions between variables.
Material And Methods:
The Study's Problem:
Al-Alam District has witnessed a steady decline in its water resources due to repeated drought waves, which has negatively affected both the available water quantities and quality. The sharp shortages in water supply have made it tough to meet residents' needs and agricultural demands, while also degrading water quality with rising salinity and pollutants. This situation raises a core question:
1- How have repeated drought waves affected the quantitative changes in water resources (surface and groundwater) in Al-Alam District?
2- What are the impacts of these quantitative and qualitative changes in water resources on agricultural activities and residents' livelihoods?
3- What are the alternatives or strategies could mitigate drought effects and ensure the sustainability of water resources in the district?
Study Hypotheses:
1- There's a positive relationship between repeated drought waves and decreases in available surface and groundwater resources in Al-Alam District.
2- Drought's impact on water resources varies over time and space, depending on the intensity of climate waves and differences in natural conditions across the district's areas.
3- The quantitative and qualitative changes in water resources have negatively affected agricultural activities and residents' living conditions, through reduced crop production and increased burdens of accessing water.
Importance of the Study
The importance of this study stems from several scientific and practical angles, which can be outlined as follows:
· It contributes in expanding academic knowledge on the relationship between climate phenomena (drought) and water resources through quantitative and qualitative analysis of water in an area that's among the most vulnerable to drought waves in Iraq.
· The study offers a practical model that can be applied in similar research linking climate change to water resource management, enriching the body of geographical and hydrological literature.
· It provides a scientific framework for understanding the temporal and spatial variations in drought's impact on water resources, paving the way for comparative studies with other areas inside and outside Iraq.
Study objectives
The study aims to achieve the following:
· Analyzing quantitative changes in surface and groundwater resources in Al-Alam District and measuring their correlation with the frequency of drought waves.
· Monitoring qualitative changes in water in terms of salinity, chemical and physical pollutants, and suitability for drinking and agriculture.
· Identifying temporal and spatial variations in the impact of drought on water resources within Al-Alam District.
Location of the Study Area
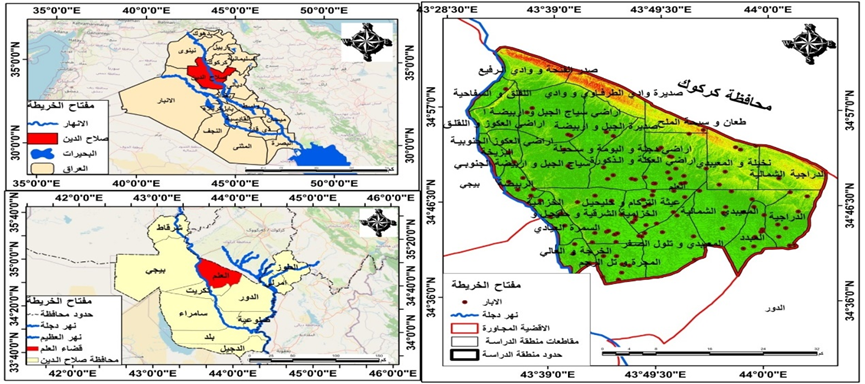
Astronomically, the study area lies between latitudes 34°30'00" to 35°05'00" North and longitudes 43°30'10" to 44°55'00" East. Geographically, it is bordered to the east and northeast by the Hamrin Hills, and to the west and northwest by the Tigris River. Administratively, it falls within Salah al-Din Governorate in the northeastern section, bordered to the northeast by Kirkuk Governorate, to the south by Al-Dour District, and to the west and northwest by the Tigris River—as shown in Map (1-1).
Map (1-1) Location of the study area
Source: According to administrative map of Iraq at scale: 1:100000, by using Arc Map10.8 program
4.1 Statistical Analysis of the Relationship Between Drought and Groundwater Characteristics by Using Pearson's Correlation Coefficient
Introduction:
Quantitative analysis has become a cornerstone of geographical studies, especially with the massive developments in digital tools and modern statistical software. This shift represents a major scientific breakthrough in handling environmental data and interpreting spatial and temporal relationships between different phenomena. Statistical packages and Geographic Information Systems (GIS) have made it easier to process huge datasets, turning them into reliable, precise results that help explain natural and environmental processes. There is doubt, one of the standout developments in contemporary geographical thought is the quantitative approach—using cutting-edge statistical methods to analyze the interplay between natural environmental elements and human activities. It uncovers patterns of influence and interaction between them with scientific precision.
Statistical analysis allows to measure the strength and direction of the relationship between drought indicators and various chemical elements, revealing the elements most affected by drought-related environmental changes. This helps explain the nature of groundwater quality deterioration and quantitatively identify the dominant hydrochemical patterns in the study area[1]. According to what mentioned, this section aims to analyze the statistical relationship between drought indicators and groundwater chemical elements using descriptive and inferential statistical methods in particular correlation coefficients and multiple linear regression in order to uncover the nature of the link between drought intensity and hydrochemical changes in groundwater. Key statistical indicators were relied upon, such as the multiple correlation coefficient (R), the coefficient of determination (R²), the F-test, and the statistical significance level (Sig), to evaluate the strength and direction of the relationship, identify the chemical elements most impacted by drought, test the significance of the statistical models, and assess their ability to explain variations in groundwater chemical properties. This section also seeks to provide a scientific interpretation of the results in light of prevailing climatic and hydrogeological characteristics, as well as the impact of drought on hydrochemical processes related to groundwater, thereby bridging numerical results with environmental and hydrological explanations. This analysis represents a crucial step toward understanding the chemical response of groundwater to drought, identifying the elements most sensitive to environmental and climatic changes, and contributing to the assessment of groundwater quality status and its vulnerability to climate shifts in the study area [2].
In order to create a comprehensive statistical model capturing the linear relationship between the drought variable and groundwater chemical elements, the model could be divided into two main parts. The first part consists of equations of multiple linear regression which explains the mathematical nature of the relationship between variables. The second section includes a set of statistical tests used to measure the model’s efficiency and reliability, such as the multiple correlation coefficient (R), the coefficient of determination (R²), the F-test, and the level of statistical significance (Sig). It also examines the significance of the independent variables and their ability to explain changes in the chemical properties of groundwater under drought conditions, as follows:
4.1.1 Multiple Linear Regression
Regression: is a statistical method enable us to build a model for estimating the relationship between one (quantitative dependent variable) and one (quantitative independent variable), or several quantitative independent variables. When the relationship involves one independent variable, it is called simple regression; when it involves several independent variables, it is called (multiple regression), Multiple linear regression is not just a single technique, but rather a set of methods used to identify the relationship between a continuous dependent variable and a number of independent variables, which are usually also continuous, the linear equation in multiple linear regression is as follows[3]:
Y = a + b1X1 + b2X2 + ……… + e
where:
[y] = the dependent variable
[a] = intercept or constant value
[b_1] = the regression coefficient of [y] with respect to the first independent variable
[b_2] = the regression coefficient of [y] with respect to the second independent variable
[x_1] = the first independent variable
[x_2] = the second independent variable
Multiple linear regression can be used when the following conditions are available:
1- The relationship between the independent variables and the dependent variable is linear.
2- The data for the independent and dependent variables are normally distributed.
After obtaining the linear regression results, the linear regression must subject to a group of statistical linear regression to determine whether these transactions are acceptable from the linear regression perspective in other words they are statistically significant [4]. To estimate the validity of the linear regression symmetry in interpreting the relationship between the linear regression and the independent and dependent variables, we will present a group of several statistical tests as follows:
1- Multiple correlation Coefficient (R)
This is the coefficient that measures the strength of the relationship between two or more variables, mentioning that the linear regression coefficient here does not rely on linearity because these relationships are not uniformly linear across all points within the regression line model [5]. Pearson's correlation coefficient is described by the linear regression formula[6]:
1- Adjust interpretation coefficient (R²)
This test is used to measure the explanatory power of the estimated model through determining the percentage of variables in independent variable (Y) which explained by regression model, it ranges from 0 to 1, where the explanatory power of the model increasing by when its values increased and vice versa [7].
1- Overall significance of regression test or F-Test:
This test aims to identifying whether the explanatory variables (xi-xn) have a significant impact on the dependent variable (Y). If the calculated [F] value exceeds the tabled critical value at the desired significance level and critical degrees (V2 = n-k) (Vi = k -1), we reject the null hypothesis. This means the regression is statistically significant I and not all regression coefficients are zero. Conversely, if (F* < F), we accept the null hypothesis, indicating that the explanatory variables do not explain changes in [Y]. In other words, there's no relationship between [Y] and the explanatory variables[8] .
[1]) World Health Organization (WHO), Climate change and health, Geneva,World Health Organization. 2021
[2] ) Fathi Abdul Aziz Abu Radi, Introduction to Quantitative Methods in Geography. Dar Al-Ma'rifa Al-Jami'iyya for Printing and Publishing, Alexandria, Egypt, 2000, p. 7.
[3] ) Mark Tranmer, Mark Elliot، Multiple Linear Regression, cathie marsh center for census and survey research, India,2001,p21.
[4] ) Farid Khalil Al-Ja'looni, "The Method of Multiple Linear Regression Analysis in Studying the Most Important Economic, Social, and Demographic Variables Affecting the Total Fertility Rate," Journal of Damascus University for Economic and Legal Sciences, Vol. 24, No. 2, 2008, p. 241.
[5] ) Sami Aziz Abbas Al-Utbi and Muhammad Yusuf Hajem Ilahiti, Scientific Research Methodology, Baghdad, 2011, pp. 172–173.
[6] ) Salem bin Saeed Al-Qahtani, Research Methods in the Behavioral Sciences, Dar Al-Masira for Publishing and Distribution, Amman, 2012, pp. 278–280.
[7] ) Nu'man Shahada, The Researcher on Forest Work Using the Brain, United Arab Emirates University, 2nd ed., Dar al-Safa for Publishing and Distribution, Amman, 2002, p. 383.
[8] ) Sami Aziz Abbas, A Quantitative Economic Study of the Demand for Chemical Fertilizers for Some Field Crops in Iraq, Master's thesis, College of Agriculture, University of Baghdad, 1981, p. 67
Result:
Database Used in the Study
The study adopted statistical analysis to reveal the nature of the relationship between drought indices derived from satellite imagery and the chemical elements in groundwater, as determined through laboratory analysis. First, well locations were represented as a (Point Feature Class) in ArcGIS by using their geographic coordinates. These points were then overlaid onto a drought map showing the spatial distribution of drought values extracted from the NDVI vegetation index and the VCI index for the same year the water samples were analyzed. To extract the drought value for each well, we used the "Extract Values to Points" tool from ArcGIS's Spatial Analyst tools. This tool pulls the raster cell value corresponding to each well point and adds it to the point layer's attribute table. As a result, every groundwater sample now had a numerical value representing the drought severity at its geographic location, enabling various statistical analyses between drought values and groundwater chemical elements as shown in Table (1).
Next, Pearson's correlation coefficient was used to measure the strength and direction of the relationship between the drought variable and various chemical elements. This method is one of the most common in environmental and hydrochemical studies because it reveals whether the relationship is positive or negative, while also indicating its strength and statistical significance. Analysis results were used to pinpoint the chemical elements most affected by drought, and to reveal the nature of the hydrogeochemical response in groundwater under the impact of vegetation cover degradation and increasing drought severity
Table (1) Drought valve and chemical elements of groundwater value in Al-Alam district
|
Cl |
ECC |
TDS1 |
Na |
SO_ |
pH |
Ca |
Mg |
K |
HCO3 |
NO3 |
PO4 |
Drought value |
|
86.5 |
2240 |
445 |
205 |
1819 |
7.2 |
326 |
198 |
6.9 |
350 |
94 |
2.2 |
0.158 |
|
94.8 |
3485 |
1095 |
232 |
1680 |
7.3 |
317 |
138 |
10.1 |
360 |
70 |
2.1 |
0.265 |
|
103.6 |
780 |
842 |
216 |
1973 |
7.2 |
412 |
89 |
3.2 |
370 |
53 |
2 |
0.084 |
|
112.9 |
4130 |
356 |
194 |
2097 |
7.5 |
451 |
165 |
4.5 |
380 |
90 |
1.9 |
0.272 |
|
120.4 |
2890 |
690 |
168 |
1850 |
6.7 |
305 |
191 |
2.6 |
85 |
57 |
0.6 |
0.171 |
|
127.5 |
3290 |
985 |
181 |
3336 |
7.3 |
473 |
72 |
8.3 |
390 |
74 |
1.8 |
0.211 |
|
138.7 |
1725 |
1295 |
194 |
1620 |
7.4 |
198 |
86 |
1.8 |
92 |
72 |
0.7 |
0.131 |
|
145.2 |
1175 |
598 |
169 |
1241 |
7.2 |
318 |
148 |
0.6 |
400 |
122 |
1.7 |
0.073 |
|
156.9 |
4100 |
942 |
221 |
2136 |
7.2 |
128 |
145 |
3.4 |
110 |
94 |
0.8 |
0.311 |
|
163.8 |
3940 |
768 |
295 |
1728 |
8.1 |
501 |
126 |
2.1 |
410 |
56 |
1.6 |
0.378 |
|
172.3 |
950 |
1390 |
157 |
1789 |
7.8 |
134 |
220 |
0.9 |
125 |
63 |
0.9 |
0.056 |
|
181.4 |
2590 |
1155 |
273 |
1349 |
7.3 |
486 |
93 |
13.4 |
420 |
67 |
1.5 |
0.278 |
|
189.6 |
2680 |
842 |
182 |
1340 |
7.1 |
175 |
135 |
4.7 |
138 |
82 |
1 |
0.194 |
|
197.9 |
860 |
1178 |
248 |
1167 |
7.7 |
571 |
184 |
5.7 |
430 |
81 |
1.4 |
0.151 |
|
205.8 |
3460 |
1001 |
205 |
2016 |
7.6 |
186 |
97 |
2.1 |
145 |
52 |
0.7 |
0.27 |
|
214.6 |
4410 |
742 |
225 |
1190 |
7.6 |
489 |
82 |
1.2 |
440 |
59 |
1.3 |
0.352 |
|
218.4 |
2150 |
721 |
176 |
1539 |
8.3 |
205 |
180 |
6.3 |
152 |
119 |
0.6 |
0.164 |
|
229.7 |
3725 |
556 |
214 |
2314 |
8.5 |
221 |
78 |
1.2 |
160 |
67 |
0.8 |
0.303 |
|
232.1 |
3065 |
518 |
210 |
1680 |
7.3 |
533 |
154 |
7.8 |
95 |
96 |
1.2 |
0.259 |
|
241.2 |
1250 |
487 |
189 |
986 |
7.4 |
268 |
162 |
3.9 |
168 |
84 |
0.9 |
0.128 |
|
248.7 |
1525 |
495 |
237 |
2304 |
7.8 |
418 |
111 |
3.9 |
105 |
75 |
1.1 |
0.196 |
|
253.9 |
3017 |
990 |
163 |
1538 |
7.3 |
82 |
124 |
5.1 |
175 |
59 |
1.1 |
0.216 |
|
263.4 |
3720 |
372 |
221 |
1938 |
8.2 |
512 |
104 |
0.4 |
115 |
48 |
1 |
0.321 |
|
266.5 |
1860 |
1089 |
147 |
1638 |
6.8 |
165 |
101 |
0.7 |
182 |
72 |
1.2 |
0.132 |
|
276.8 |
2395 |
902 |
198 |
2193 |
7.2 |
317 |
212 |
6.2 |
125 |
91 |
0.9 |
0.22 |
|
279.1 |
4320 |
978 |
238 |
2131 |
7.7 |
118 |
200 |
2.8 |
190 |
90 |
1 |
0.38 |
|
288.9 |
905 |
665 |
186 |
2339 |
7.3 |
396 |
130 |
9.9 |
135 |
79 |
0.8 |
0.119 |
|
291.8 |
2595 |
934 |
171 |
1763 |
8.1 |
149 |
140 |
4.2 |
198 |
47 |
0.9 |
0.209 |
|
301.3 |
4155 |
898 |
172 |
2155 |
7.6 |
532 |
92 |
2.8 |
145 |
117 |
0.7 |
0.31 |
|
304.6 |
720 |
889 |
199 |
2014 |
7.5 |
235 |
90 |
1.5 |
205 |
74 |
0.8 |
0.126 |
|
313.6 |
2815 |
1160 |
259 |
2349 |
7.4 |
497 |
172 |
4 |
155 |
61 |
0.6 |
0.319 |
|
317.3 |
3985 |
1058 |
184 |
1635 |
7.6 |
402 |
168 |
7.6 |
212 |
126 |
0.7 |
0.317 |
|
326.8 |
1720 |
542 |
243 |
1819 |
7.3 |
561 |
75 |
14.1 |
165 |
66 |
0.8 |
0.239 |
|
329.9 |
2810 |
632 |
156 |
1300 |
7.4 |
152 |
73 |
3.1 |
220 |
69 |
1.1 |
0.219 |
|
339.1 |
3990 |
836 |
218 |
1567 |
7.6 |
439 |
151 |
1.5 |
175 |
84 |
1 |
0.358 |
|
342.6 |
1640 |
348 |
209 |
1070 |
7.7 |
178 |
149 |
0.4 |
228 |
82 |
1.3 |
0.205 |
|
351.6 |
3100 |
402 |
203 |
1178 |
7.4 |
482 |
120 |
5 |
185 |
64 |
1.2 |
0.292 |
|
355.4 |
4525 |
1215 |
192 |
1441 |
7.5 |
154 |
128 |
2.3 |
235 |
55 |
1.4 |
0.37 |
|
364.9 |
1865 |
685 |
189 |
1459 |
8.5 |
615 |
99 |
8.6 |
195 |
93 |
1.4 |
0.205 |
|
368.1 |
2385 |
764 |
226 |
840 |
7.8 |
512 |
95 |
5.8 |
242 |
97 |
1.2 |
0.276 |
|
377.2 |
4520 |
1078 |
266 |
1337 |
7.1 |
598 |
140 |
0.7 |
205 |
72 |
1.6 |
0.452 |
|
381.7 |
3095 |
428 |
178 |
1201 |
8.6 |
258 |
186 |
1.9 |
250 |
75 |
1 |
0.275 |
|
389.7 |
2700 |
495 |
251 |
3124 |
7.4 |
391 |
214 |
3.4 |
215 |
56 |
1.8 |
0.327 |
|
394.2 |
870 |
1102 |
165 |
2734 |
7.4 |
163 |
84 |
8.4 |
258 |
65 |
0.9 |
0.128 |
|
402.4 |
1980 |
965 |
229 |
2044 |
7.6 |
455 |
130 |
6.6 |
225 |
89 |
2 |
0.265 |
|
407.9 |
3550 |
805 |
241 |
1382 |
6.9 |
421 |
156 |
3.6 |
265 |
85 |
1.5 |
0.376 |
|
415.8 |
3465 |
340 |
214 |
1387 |
7.2 |
446 |
95 |
11.2 |
235 |
75 |
2.2 |
0.346 |
|
421.5 |
2140 |
365 |
203 |
1736 |
7.4 |
447 |
114 |
0.6 |
272 |
120 |
1.6 |
0.254 |
|
428.6 |
2160 |
792 |
197 |
941 |
8.3 |
548 |
175 |
2 |
245 |
123 |
2.4 |
0.251 |
|
435.2 |
4660 |
1168 |
187 |
1900 |
7.3 |
232 |
106 |
2.7 |
280 |
57 |
1.4 |
0.398 |
|
441.1 |
4300 |
468 |
178 |
2124 |
7.3 |
479 |
76 |
4.7 |
255 |
58 |
2.3 |
0.369 |
|
448.8 |
2930 |
692 |
172 |
2834 |
8.1 |
365 |
215 |
4.9 |
288 |
70 |
1.3 |
0.28 |
|
454.7 |
1255 |
245 |
206 |
2730 |
7.6 |
471 |
158 |
15.3 |
265 |
69 |
2.1 |
0.213 |
|
462.3 |
980 |
1090 |
259 |
1746 |
7.2 |
201 |
132 |
1.1 |
295 |
91 |
1.2 |
0.252 |
|
467.2 |
2890 |
612 |
234 |
1322 |
7.4 |
505 |
120 |
1.1 |
275 |
86 |
1.9 |
0.346 |
|
475.9 |
3810 |
1086 |
231 |
1348 |
7.4 |
239 |
94 |
6.8 |
302 |
62 |
1.1 |
0.403 |
|
480.8 |
3705 |
318 |
219 |
2206 |
7.9 |
498 |
99 |
5.9 |
285 |
71 |
1.7 |
0.386 |
|
489.4 |
2260 |
915 |
196 |
2485 |
7.6 |
196 |
175 |
3.3 |
310 |
79 |
1 |
0.276 |
|
494.6 |
2105 |
305 |
201 |
2623 |
6.7 |
446 |
194 |
9.1 |
295 |
81 |
1.5 |
0.273 |
|
503.1 |
4475 |
1115 |
181 |
2746 |
7.9 |
452 |
76 |
0.2 |
318 |
114 |
1.6 |
0.402 |
|
508.9 |
4620 |
428 |
285 |
668 |
8.6 |
521 |
135 |
0.5 |
305 |
93 |
1.3 |
0.518 |
|
516.7 |
1990 |
1170 |
168 |
1740 |
8.8 |
338 |
154 |
5.5 |
325 |
66 |
1.7 |
0.239 |
|
522.4 |
1985 |
265 |
262 |
801 |
8.1 |
439 |
88 |
3.1 |
315 |
65 |
1.1 |
0.336 |
|
530.2 |
3225 |
738 |
215 |
2894 |
7.3 |
189 |
121 |
9.2 |
332 |
80 |
1.8 |
0.367 |
|
536.7 |
3220 |
762 |
247 |
973 |
7.8 |
514 |
162 |
7.4 |
325 |
84 |
0.9 |
0.402 |
|
543.8 |
1410 |
522 |
244 |
1049 |
7.2 |
371 |
100 |
2.4 |
340 |
50 |
1.5 |
0.289 |
|
550.1 |
1500 |
589 |
231 |
819 |
7.1 |
536 |
71 |
12.8 |
335 |
69 |
0.7 |
0.283 |
|
557.4 |
3680 |
1195 |
207 |
2844 |
7.5 |
274 |
194 |
1.7 |
348 |
92 |
1.4 |
0.396 |
|
564.8 |
4050 |
310 |
215 |
789 |
7.6 |
552 |
147 |
2.3 |
345 |
95 |
0.6 |
0.429 |
|
571 |
2520 |
856 |
193 |
2588 |
8 |
188 |
88 |
4.1 |
355 |
76 |
1.3 |
0.314 |
|
579.3 |
2750 |
435 |
193 |
691 |
7.3 |
386 |
123 |
4.2 |
355 |
58 |
0.8 |
0.331 |
|
584.6 |
905 |
412 |
176 |
1489 |
7.4 |
256 |
147 |
6 |
362 |
124 |
1.2 |
0.201 |
|
593.7 |
950 |
1012 |
222 |
606 |
7.1 |
492 |
92 |
16 |
365 |
77 |
1 |
0.253 |
|
598.2 |
4150 |
1015 |
228 |
1337 |
7.6 |
245 |
219 |
0.8 |
370 |
53 |
1.1 |
0.459 |
|
608.4 |
3350 |
945 |
254 |
560 |
8.2 |
487 |
181 |
1.4 |
375 |
89 |
1.2 |
0.439 |
|
611.7 |
2795 |
625 |
219 |
1783 |
8.2 |
176 |
138 |
3.5 |
378 |
71 |
1.9 |
0.37 |
|
623.9 |
1875 |
395 |
239 |
500 |
7.7 |
501 |
80 |
4.6 |
385 |
61 |
1.4 |
0.337 |
|
625.3 |
1065 |
348 |
201 |
1979 |
7.8 |
279 |
98 |
7.1 |
385 |
88 |
2 |
0.249 |
|
638.9 |
3420 |
1138 |
188 |
2247 |
7.6 |
173 |
182 |
2.9 |
392 |
62 |
1.8 |
0.386 |
|
650.9 |
4580 |
702 |
227 |
1765 |
9 |
468 |
152 |
1.9 |
410 |
91 |
1.6 |
0.501 |
|
652.5 |
2310 |
892 |
170 |
2847 |
7.9 |
142 |
79 |
1.3 |
400 |
95 |
1.7 |
0.303 |
|
666.1 |
4605 |
1135 |
252 |
1438 |
8.4 |
158 |
165 |
10.4 |
408 |
68 |
1.6 |
0.533 |
|
672.8 |
2645 |
545 |
172 |
1988 |
7.2 |
489 |
109 |
7.3 |
295 |
74 |
1.8 |
0.333 |
|
679.6 |
1765 |
1075 |
235 |
1994 |
7.5 |
326 |
127 |
4.6 |
415 |
84 |
1.5 |
0.344 |
|
693.2 |
3995 |
785 |
211 |
1344 |
7.7 |
351 |
103 |
2 |
422 |
121 |
1.4 |
0.462 |
|
705.3 |
3920 |
385 |
201 |
2450 |
7.5 |
476 |
102 |
0.8 |
175 |
83 |
2 |
0.451 |
|
706.8 |
2665 |
318 |
197 |
1004 |
8.3 |
217 |
205 |
5.9 |
430 |
56 |
1.3 |
0.37 |
|
720.4 |
820 |
1008 |
183 |
1120 |
7.9 |
258 |
143 |
8.7 |
438 |
73 |
2.1 |
0.245 |
|
734 |
4215 |
825 |
262 |
1794 |
8.2 |
126 |
92 |
1.6 |
445 |
91 |
2.2 |
0.54 |
|
739.6 |
1210 |
274 |
193 |
1328 |
7.4 |
573 |
208 |
5.4 |
260 |
67 |
2.2 |
0.286 |
|
747.5 |
3030 |
465 |
246 |
1604 |
7.3 |
389 |
170 |
3.8 |
120 |
46 |
2 |
0.455 |
|
761.1 |
1120 |
1186 |
223 |
950 |
7.5 |
312 |
74 |
6.5 |
130 |
79 |
1.9 |
0.317 |
|
774.7 |
3745 |
748 |
206 |
1018 |
7.3 |
342 |
150 |
0.5 |
140 |
116 |
1.8 |
0.467 |
|
788.3 |
2450 |
998 |
191 |
1219 |
7.4 |
405 |
130 |
2.2 |
150 |
66 |
1.7 |
0.376 |
|
801.9 |
1580 |
1205 |
174 |
1862 |
7.9 |
301 |
97 |
11.8 |
160 |
82 |
1.6 |
0.309 |
|
815.4 |
4085 |
698 |
229 |
1920 |
8.7 |
283 |
189 |
4.3 |
170 |
53 |
1.5 |
0.524 |
|
829 |
2895 |
945 |
217 |
1363 |
7.6 |
295 |
86 |
7.9 |
180 |
94 |
2.3 |
0.442 |
|
842.6 |
895 |
1140 |
198 |
2506 |
7.5 |
452 |
158 |
1.4 |
190 |
75 |
2.4 |
0.304 |
|
856.2 |
4345 |
772 |
185 |
1584 |
7.3 |
508 |
118 |
3 |
200 |
127 |
2.2 |
0.508 |
|
869.8 |
3195 |
915 |
271 |
1680 |
7.2 |
291 |
108 |
5.2 |
210 |
60 |
2.1 |
0.529 |
|
883.3 |
1015 |
1025 |
254 |
1901 |
8 |
328 |
117 |
0.9 |
220 |
67 |
2 |
0.38 |
|
896.9 |
3615 |
548 |
236 |
2342 |
7.6 |
371 |
98 |
2.6 |
230 |
86 |
1.9 |
0.528 |
|
910.5 |
2735 |
928 |
214 |
1556 |
7.5 |
392 |
189 |
9.6 |
240 |
64 |
1.8 |
0.455 |
|
924.1 |
645 |
336 |
199 |
2880 |
7.6 |
346 |
84 |
6.1 |
250 |
96 |
1.7 |
0.315 |
|
937.7 |
4265 |
1120 |
208 |
2100 |
7.4 |
504 |
142 |
1 |
260 |
73 |
2.5 |
0.552 |
|
951.2 |
2965 |
905 |
224 |
2243 |
7.3 |
379 |
218 |
4.8 |
270 |
49 |
2.4 |
0.492 |
|
964.8 |
1090 |
648 |
190 |
1478 |
7 |
362 |
133 |
12.6 |
280 |
92 |
2.3 |
0.346 |
|
978.4 |
3875 |
1105 |
177 |
1517 |
7.2 |
251 |
96 |
3.7 |
290 |
77 |
2.2 |
0.509 |
|
992 |
2125 |
1152 |
163 |
2246 |
7.8 |
482 |
178 |
0.3 |
300 |
118 |
2.1 |
0.391 |
|
1005.6 |
4680 |
815 |
286 |
2248 |
7.6 |
519 |
77 |
5.4 |
310 |
57 |
2 |
0.678 |
|
1019.1 |
2530 |
482 |
268 |
1718 |
8.4 |
401 |
160 |
7.2 |
320 |
68 |
1.9 |
0.531 |
|
1032.7 |
1380 |
1068 |
241 |
1382 |
7.9 |
389 |
122 |
2.5 |
330 |
83 |
1.8 |
0.437 |
|
1046.3 |
4010 |
708 |
219 |
1603 |
7.6 |
468 |
100 |
1.8 |
340 |
62 |
2.3 |
0.581 |
Source: according to digital matching between drought and chemical elements of groundwater
1- The relationship between drought and chloride element (CL)
Chloride is one of the most sensitive chemical elements to drought conditions in groundwater. As a conservative ion, it doesn't easily precipitate or undergo complex reactions in the aquifer, so changes in its concentration directly reflect shifts in water balance and climate, especially evaporation and reduced recharge. During intense droughts, recharge drops and evaporation ramps up, concentrating dissolved salts and driving up chloride levels. That's why hydrochemical studies often use chloride as a key indicator of water quality decline and rising salinity in arid and semi-arid areas[1]. After applying statistical correlation analysis, the results appear in Table (2).
Table 2: Results of Correlation and Simple Linear Regression Between Drought and Chloride (Cl)
|
R |
R² |
Adjusted R² |
F |
Sig |
Beta |
Std. Error |
The element |
|
0.714 |
0.51 |
0.506 |
115.62 |
0 |
0.714 |
0.128 |
CL |
Source: Researcher's work using SPSS v.28 statistical package
The table shows a strong positive relationship between drought and chloride (Cl) in groundwater. The correlation coefficient (R) hit 0.714, pointing to a solid link between the two which means higher drought intensity goes hand-in-hand with rising chloride concentrations in the study's wells. It also reveals that drought explains about (51%) of the variation in chloride levels, a solid percentage that highlights its major influence compared to other factors affecting groundwater chemistry.
(F) test value of (115.62) with a significance level (Sig = 0.000), confirms the model's high reliability in explaining the relationship between drought and chloride concentration, the standardized regression coefficient (Beta = 0.714) shows a clear positive effect to chloride, in other words, more severe drought leads to higher chloride concentrations in the groundwater.
This is scientifically explained by the fact that drought conditions reduce water recharge and increase evaporation rates, leading to higher concentrations of dissolved salts, especially chloride, which is a conservative ion with low precipitation and chemical reactivity. As a result, it responds quickly to climatic and hydrological changes, particularly in arid and semi-arid environments.
1- The Relationship Between Drought and Electrical Conductivity (EC)
Electrical conductivity (EC) is one of the key hydrochemical indicators used to assess groundwater quality, as it directly reflects the amount of dissolved salts and ions in the water. EC values are heavily influenced by climatic conditions, especially drought, because lower water recharge and higher evaporation rates boost dissolved salt concentrations, which in turn raises EC levels. So EC is widely used in environmental studies as a critical indicator of declining water quality and rising salinity under drought [2]. By applying simple linear correlation and regression analysis between drought and EC, the statistical results shown in Table (3).
Table (3): Results of Simple Linear Correlation and Regression Between Drought and Electrical Conductivity
|
R |
R² |
Adjusted R² |
F |
Sig |
Beta |
Std. Error |
The element |
|
0.667 |
0.445 |
0.44 |
89.14 |
0 |
0.667 |
0.141 |
ECC |
Source: Researcher's work using SPSS v.28 statistical package
The results in Table (3) reveal a relatively strong positive relationship between drought and electrical conductivity (EC), with the correlation coefficient (R) reaching 0.667. This means that as drought intensity increases, EC values in groundwater rise accordingly. The analysis also shows that drought explains about 44.5% of the variation in EC values which is a clear sign of drought impact on saline properties of groundwater.
(F) test value and statistical significance level (Sig = 0.000) confirm the statistical significance of the relationship and the efficiency of the model used. Scientifically, this means that increased drought leads to higher concentrations of ions and dissolved salts due to reduced water recharge and heightened evaporation. This directly boosts electrical conductivity, which serves as a general indicator of dissolved salts in groundwater.
1- The Relationship Between Drought and Sodium (Na)
Sodium is a key chemical element in hydrogeochemical studies, as it's one of the main dissolved ions in groundwater and is clearly affected by climatic and hydrological changes, especially in arid and semi-arid environments. Drought reduces water recharge and ramps up evaporation rates, which concentrates dissolved salts in aquifer reservoirs and raises sodium levels. Elevated sodium can also tie into ion exchange processes and the dissolution of saline minerals, making it a critical factor in assessing drought's impact on groundwater quality[3] .
By applying simple linear correlation and regression analysis between drought and sodium (Na) yielded the statistical results shown in Table (4).
Table (4): Results of Simple Linear Correlation and Regression Between Drought and Sodium (Na)
|
R |
R² |
Adjusted R² |
F |
Sig |
Beta |
Std. Error |
The element |
|
0.487 |
0.237 |
0.23 |
34.52 |
0 |
0.487 |
0.173 |
Na |
Source: Researcher's work using SPSS v.28 statistical package
The table results shows a moderate positive relationship between drought and sodium (Na), with the correlation coefficient (R) at 0.487. This indicates that greater drought intensity correlates with relatively higher sodium concentrations in groundwater. The results also reveal that drought explains about (23.7%) of variation in sodium concentrations and it is a ratio that clearly signals the impact of drought. However, it's less pronounced compared to chloride and electrical conductivity.
(F) test value and statistical significance level (Sig = 0.000) confirm a statistically meaningful relationship between these variables. This explains that drought conditions boost dissolved salt concentrations through evaporation and reduced water recharge. Sodium levels may also rise due to ion exchange processes and the dissolution of sodium-bearing minerals, driving up its presence in groundwater.
5- The Relationship Between Drought and Phosphate (PO4)
Phosphate is one of those chemical elements that indirectly ties into environmental and climatic conditions. Its concentration in groundwater is influenced by factors like agricultural activity, chemical fertilizer use, and hydrological changes linked to water recharge and drought. During drought, lower water volumes and higher evaporation rates concentrate certain dissolved elements including phosphate due to weaker dilution and a relative buildup of chemicals in the groundwater[4] . By applying linear correlation and regression analysis between drought and phosphate (PO4), the results shown in Table (5).
Table 5: Results of Simple Linear Correlation and Regression Between Drought and Phosphate (PO4)
|
R |
R² |
Adjusted R² |
F |
Sig |
Beta |
Std. Error |
The element |
|
0.414 |
0.171 |
0.164 |
22.91 |
0 |
0.414 |
0.186 |
PO4 |
Source: Researcher's work using SPSS v.28 statistical package
Table (5) results shows a moderate positive relationship between drought and phosphate (PO4), with the correlation coefficient (R) at (0.414) , which indicate that as drought intensifies, phosphate concentrations in groundwater tend to rise relatively.As the results showed that drought explains (17.1 %) of the variation in phosphate concentrations , a percentage that points to a real drought effect, though it's still smaller compared to elements directly tied to salinity.
(F) test value and statistical significance level (Sig = 0.000) confirms the meaningful statistical link between the two variables. This can be explained as drought conditions reduces water volumes, boosting the relative concentration of dissolved elements. Plus, phosphates might get a lift from agricultural activities and chemical fertilizers, which ramp up their levels in groundwater in certain areas.
1- The relationship Between Drought and Hydrogen Ion Concentration (pH)
pH, or hydrogen ion concentration, is a core chemical property of groundwater. It shows whether the water leans acidic or basic, influenced by factors like rock types, geological formations, dissolved salts, and ion exchange processes in the aquifer. Drought can indirectly nudge pH values too through higher evaporation rates and weak water recharge [5]. And by using simple linear correlation and regression analysis between drought and pH, the results in table (6) appeared:
Table (6): Results of Simple Linear Correlation and Regression Between Drought and Hydrogen Ion Element (pH)
|
R |
R² |
Adjusted R² |
F |
Sig |
Beta |
Std. Error |
The element |
|
0.218 |
0.048 |
0.039 |
5.53 |
0.021 |
0.218 |
0.211 |
PH |
Source: Researcher's work using SPSS v.28 statistical package.
The results of the table shows a weak positive correlation between drought and pH, with the correlation coefficient (R) at (0.218). This indicate that drought has a limited impact on groundwater pH compared to other chemical elements. Indeed, drought explains just (4.8%) of the variation in pH values, indicating that the element is influenced more by other factors than by drought, such as the nature of the rocks and chemical interactions within the groundwater.
Despite the weak relationship, the statistical significance level indicates an acceptable level of statistical meaningfulness for the model. This can be explained by the fact that drought increasing leads indirectly to a slight change in the balance of dissolved ions, which affects the acidity and alkalinity values of the water. However, this effect remains limited due to the regulatory and balancing nature of the hydrogen ion (pH) in groundwater systems.
6- The Relationship Between Drought and Bicarbonate (HCO₃)
Bicarbonate is one of the main ions in groundwater, directly linked to the dissolution of carbonate rocks and geochemical interactions between the water and geological formations. Bicarbonate concentrations are affected by several factors, most notably the amount of carbon dioxide, the solubility of carbonate minerals, and prevailing climatic and hydrological conditions. Drought can also cause a relative change in bicarbonate concentrations due to reduced water recharge and increased relative concentration of dissolved elements in the groundwater. By applying simple linear correlation and regression between drought and bicarbonate (HCO₃), the statistical results shown in Table (7) were obtained:
Table (7): Results of Simple Linear Correlation and Regression Between Drought and Bicarbonate (HCO 3)
|
R |
R² |
Adjusted R² |
F |
Sig |
Beta |
Std. Error |
The element |
|
0.203 |
0.041 |
0.032 |
4.79 |
0.031 |
0.203 |
0.214 |
HCO3 |
Source: Researcher's work using SPSS v.28 statistical package
The results in Table (7) show a weak positive relationship between drought and bicarbonate (HCO₃), with the correlation coefficient (R) reaching 0.203. This suggests that drought's impact on bicarbonate concentrations is relatively limited compared to elements directly tied to salinity. The results also indicate that drought explains only about (4.1%) of the variation in bicarbonate concentrations, pointing to the fact that this element is strongly influenced by geological factors and chemical interactions inside the aquifer. In spite of the weak relationship, the results of the statistical significance test indicate an acceptable level of statistical significance for the model. This can be explained by the fact that drought indirectly contributes to higher bicarbonate concentrations due to reduced water dilution and increased relative concentrations of dissolved elements. However, the nature of bicarbonates tied to chemical equilibrium and the dissolution of carbonate rocks makes their response to drought less pronounced compared to other salinity elements.
7- The Relationship Between Drought and Calcium (Ca)
Calcium is one of the major chemical elements in groundwater, directly linked to the dissolution processes of limestone, gypsum, and geological formations containing carbonate minerals, their concentrations are influenced by climatic and hydrological factors, especially in arid and semi-arid environments and drought leads to reduced water recharge and higher evaporation rates, which can increase the relative concentration of certain dissolved ions, including calcium in groundwater [6]. By applying simple linear correlation and regression between drought and calcium (Ca), the statistical results shown in Table (8) appeared.
Table (8): Results of Simple Linear Correlation and Regression Between Drought and Calcium (Ca)
|
R |
R² |
Adjusted R² |
F |
Sig |
Beta |
Std. Error |
The element |
|
0.188 |
0.035 |
0.027 |
4.08 |
0.046 |
0.188 |
0.219 |
Ca |
Source: Researcher's work using SPSS v.28 statistical package.
The results in table (8) show a weak positive relationship between drought and calcium (Ca), with the correlation coefficient (R) reaching (0.188) indicating that drought's impact on calcium concentrations is relatively limited. The analysis also reveals that drought explains about (3.5%) of the variance in calcium levels is a low percentage that reflects how this element is more influenced by other geological and chemical factors than by direct drought effects.
(F) test and statistical significance level further confirm an acceptable significance statistical of the relationship though it was relatively weak. This makes sense because calcium is primarily tied to dissolution processes of carbonate and gypsum rocks within the aquifer means its response to drought is less pronounced compared to elements directly tied to rising salinity and evaporation.
[1] ) Todd, D. K., & Mays, L. W., Groundwater Hydrology, 3rd ed., John Wiley & Sons, New York, 2005, p. 389.
[2] ) Freeze, R. A., & Cherry, J. A., Groundwater, Prentice Hall, New Jersey, 1979, p. 104.
[3] ) Hem, J. D., Study and Interpretation of the Chemical Characteristics of Natural Water, U.S. Geological Survey Water-Supply Paper, 1985, p. 89.
[4] ) Appelo, C. A. J., & Postma, D., Geochemistry, Groundwater and Pollution, 2nd ed., CRC Press, London, 2005, p. 153.
[5] ) Drever, J. I., The Geochemistry of Natural Waters, 3rd ed., Prentice Hall, New Jersey, 1997, p. 45.
[6] ) Todd, D. K., & Mays, L. W., Groundwater Hydrology, 3rd ed., John Wiley & Sons, New York, 2005, p. 401.
CONCLUSION :
The study reached the following key findings after achieving its objectives:
1- Pearson correlation analysis revealed the nature of the relationship between drought intensity (X) and electrical conductivity values (EC) (Y) over 2013 and 2024. The sum of the products of deviations was (4.4187), the sum of squared drought deviations was (0.00076), and the sum of squared EC deviations was (25,665.78), this led to a correlation coefficient of r = -1, reflecting a perfect inverse relationship between the variables which means a drop in the drought index.
2- The absence of sanitary sewage networks in the area, coupled with residents using cesspits to dispose of human waste, allows these wastes to seep into the ground and reach the groundwater. This heightens contamination, especially in the floodplain where groundwater sits close to the surface.
3- Producing a groundwater pollution vulnerability map using the (DRASTIC) method.
4- Using of kriging interpolation methods available in ArcGIS software.
Recommendations:
1- Farmers should test the chemical and physical properties of groundwater before planting, matching them to soil type and crops to maximize yields while minimizing soil damage and water waste.
2- Drill monitoring wells to track any changes that could impact aquifer use.
3- Implement the planned Nayef irrigation project in the study area to ease pressure on groundwater and boost its recharge.
4- Reducing pollution by regulating the discharge of agricultural and industrial waste
BIBLIOGRAPHY:
1. Abdul Aziz Abu Radi, Introduction to Quantitative Methods in Geography. Dar Al-Ma'rifa Al-Jami'iyya for Printing and Publishing, Alexandria, Egypt, 2000, p. 7.
2. Appelo, C. A. J., & Postma, D., Geochemistry, Groundwater and Pollution, 2nd ed., CRC Press, London, 2005, p. 153.
3. Drever, J. I., The Geochemistry of Natural Waters, 3rd ed., Prentice Hall, New Jersey, 1997, p. 45.
4. Farid Khalil Al-Ja'looni, "The Method of Multiple Linear Regression Analysis in Studying the Most Important Economic, Social, and Demographic Variables Affecting the Total Fertility Rate," Journal of Damascus University for Economic and Legal Sciences, Vol. 24, No. 2, 2008, p. 241.
5. Fathi Abdul Aziz Abu Radi, Introduction to Quantitative Methods in Geography. Dar Al-Ma'rifa Al-Jami'iyya for Printing and Publishing, Alexandria, Egypt, 2000, p. 7.
6. Freeze, R. A., & Cherry, J. A., Groundwater, Prentice Hall, New Jersey, 1979, р. 104.
7. Hair, J. F. et al., Multivariate Data Analysis, 7th ed., Pearson Education, London, 2010. p. 162. World Health Organization (WHO), Climate change and health, Geneva, World Health Organization. 2021.
8. Hem, J. D., Study and Interpretation of the Chemical Characteristics of Natural Water, U.S. Geological Survey Water-Supply Paper, 1985, p. 89.
9. Mark Tranmer, Mark Elliot. Multiple Linear Regression, cathie marsh center for census and survey research, India, 2001, p21.
10. Nu'man Shahada, Quantitative Methods in Geography Using Computers, 2nd ed., UAE University, Dar Al-Safa for Publishing and Distribution, Amman, 2002, p. 383.
11. Salem bin Saeed Al-Qahtani, Research Methods in the Behavioral Sciences, Dar Al-Masira for Publishing and Distribution, Amman, 2012, pp. 278–280.
12. Sami Aziz Abbas Al-Utbi and Muhammad Yusuf Hajem Ilahiti, Scientific Research Methodology, Baghdad, 2011, pp. 172–173.
13. Todd, D. K., & Mays, L. W., Groundwater Hydrology, 3rd ed., John Wiley & Sons, New York, 2005, p. 389.