Exploration of Selective Cytotoxic and Anticancer Activity of Helicteres isora Against Skin Cancer Cells: A Phytochemical and Bioanalytical Approach
- Radhika Bhalchandra Deshpande , Research Scholar, Department of Botany.N.E.S. Science College, Nanded.
- Roopa Vishwanath Sangvikar , Associate Professor and Research guide, Department of BotanyN.E.S. Science College, Nanded.
Article Information:
Abstract:
Abstract: Background: The present study aimed to evaluate the pharmacological potential and phytochemical profile of Helicteres isora fruit extract. Preliminary phytochemical screening confirmed the presence of bioactive constituents such as phenols, flavonoids, and other secondary metabolites. The total phenolic content (TPC) and total flavonoid content (TFC) of the extract were found to increase in a concentration-dependent manner, indicating a significant presence of polyphenolic compounds. The antioxidant activity demonstrated moderate free radical scavenging potential, with increasing percentage inhibition at higher concentrations. The extract also exhibited dose-dependent α-amylase inhibitory activity, suggesting its potential role in antidiabetic applications. FTIR analysis confirmed the presence of various functional groups, including hydroxyl, carbonyl, and aromatic groups, indicating the presence of diverse phytoconstituents. HPTLC profiling further supported the presence of flavonoids, with quercetin identified as a major compound. LC–MS analysis revealed a complex chemical composition, identifying multiple bioactive compounds belonging to phenolic, fatty acid, and terpenoid classes. Cytotoxicity studies on L929 cell lines indicated negligible toxicity, demonstrating the biocompatibility of the extract. Additionally, the extract exhibited moderate growth inhibitory activity, suggesting its potential therapeutic relevance. Although limited studies are available on the combined evaluation of cytotoxicity, anticancer potential, and FTIR profiling of Helicteres isora, the present investigation offers novel insights into its bioactive composition and biological activities.
Keywords:
Article :
INTRODUCTION:
Cancer and diabetes are among the most serious health challenges worldwide and are responsible for significant morbidity and mortality. The rapid increase in incidence of these diseases has created growing demand for safer and more effective therapeutic agents. Although several synthetic drugs are available for the treatment of these conditions, many of them are associated with adverse effects and high treatment costs. Consequently, researchers are increasingly exploring natural products derived from medicinal plants as a potential source of new therapeutic compounds (Giovannucci et al., 2010).
Cancer develops when a normal cell undergoes genetic alterations that lead to uncontrolled growth and loss of normal regulatory mechanisms. These abnormal cells can invade surrounding tissues and may spread to other parts of the body through metastasis (Hanahan et al., 2011). According to global health reports, cancer is one off the leading causes of death worldwide and continues to increase due to factors such as aging, lifestyle changes and environmental exposures (Klement, 2024). Conventional cancer treatments such as chemotherapy, radiation therapy and surgery have improved survival rates but these approaches are often associated with serious side effects and toxicity to normal cells (Stein et al., 2008). In recent years, natural products are plant derived compounds have gained attention as potential anticancer agents because they may selectively target cancer cells while causing comparatively fewer adverse effects (Rincón et al., 2025).
Diabetes mellitus is a chronic metabolic disorder characterized by elevated blood glucose levels resulting from defects in insulin secretion, insulin action or both (American diabetes association., 2010). Persistent hyperglycaemia in diabetic patients can lead to long term complications affecting vital organs such as the hearts, kidneys, nerves and eyes (Antar et al., 2023).
Enzymes such as α-amylase and α-glucosidase play an important role in carbohydrate digestion. The inhibition of these enzymes is considered as a useful strategy for controlling postprandial blood glucose levels (Febriyanti et al., 2025). Plant based therapies have attracted considerable interest in diabetes management because many medicinal plants contain bioactive compounds capable of improving glucose metabolism and reducing oxidative stress (Jacob et al., 2018).
So, cancer and diabetes are two major non-communicable diseases that significantly affect global health. Their prevalence has increased rapidly in recent decades due to factors such as lifestyle changes, aging populations, and environmental influences (Liu et al., 2025). Biologically, the connection between cancer and diabetes is associated with metabolic disturbances such as hyperglycaemia, insulin resistance, and elevated insulin levels, which can promote abnormal cell growth and contribute to tumour development (Cignarelli et al., 2018).
Although current treatments such as chemotherapy and antidiabetic drugs are widely used, they often cause side effects and long-term complications. Therefore, there is an increasing need to explore safer and more effective therapeutic approaches (Bigorra et al., 2021).
Natural products derived from plants have historically played a crucial role in the discovery of therapeutic agents. Many modern drugs used in clinical practice originate from natural sources or their derivatives. Natural products contain a wide variety of bioactive secondary metabolites such as phenolics, flavonoids, alkaloids, terpenoids, and glycosides. These compounds are known to possess several pharmacological activities including antioxidant, antimicrobial, antidiabetic, and anticancer properties (Les et al., 2024). Compared to many synthetic drugs, natural compounds are often considered safer due to their relatively lower toxicity and better biological compatibility. As a result, plant-derived compounds are increasingly explored as potential alternatives for disease prevention and treatment. Natural products continue to play a vital role in modern drug discovery and development. Advances in phytochemical and analytical techniques have facilitated the identification of novel compounds with promising therapeutic potential (Liu et al., 2024).
Due to their diverse biological activities and long history of traditional use, medicinal plants are receiving increasing attention from researchers worldwide. Scientific investigations are being conducted to validate their therapeutic potential and identify bioactive constituents responsible for their pharmacological effects.
Helicteres isora L. is a medicinal plant belonging to the family Sterculiaceae. It is commonly known as the Indian screw tree and is widely distributed in tropical and subtropical regions of Asia, particularly in India. Different parts of Helicteres isora, including fruits, bark, and leaves, have been traditionally used in various herbal systems of medicine for the treatment of gastrointestinal disorders, infections, inflammation, and metabolic conditions such as diabetes (Thapa., 2024).
Phytochemical investigations have reported that Helicteres isora contains several bioactive compounds including phenolics, flavonoids, tannins, alkaloids, and terpenoids. These secondary metabolites are known to contribute to various biological activities. Previous studies have indicated that extracts of Helicteres isora exhibit multiple pharmacological properties such as antioxidant, antimicrobial, anti-inflammatory, and antidiabetic activities (Sharma et al., 2016). Phenolic and flavonoid compounds play a significant role in reducing oxidative stress by scavenging free radicals. Their ability to modulate multiple biological pathways makes them promising candidates for managing complex diseases like cancer and diabetes (Suthar et al., 2009).
Advanced analytical techniques are essential for identifying and characterizing bioactive compounds present in plant extracts. These techniques help in understanding the chemical composition responsible for biological activities. High Performance Thin Layer Chromatography (HPTLC) is an effective method for obtaining the fingerprint profile of plant extracts. It allows the separation and identification of different phytoconstituents based on their retention factor (Bhujbal et al., 2024). Liquid Chromatography–Mass Spectrometry (LC-MS) is a powerful analytical technique used for the identification of bioactive compounds based on their molecular mass and structure. It provides detailed information about the chemical constituents present in the extract (Ramachandram et al., 2016).
Although Helicteres isora has been reported to possess certain pharmacological activities, comprehensive studies integrating phytochemical profiling using HPTLC and LC-MS with evaluation of antioxidant, antidiabetic, and anticancer activities are still limited. Therefore, the present study was undertaken to evaluate the phytochemical profile of Helicteres isora using HPTLC and LC-MS techniques and to investigate its antioxidant, antidiabetic, and anticancer activities along with cytotoxicity assessment.
Materials and Methods:
Plant Material Collection and Authentication
The plant material of Helicteres isora was collected from Aundha Nagnath, located in Hingoli district of Maharashtra, India. Aundha Nagnath is a historically and ecologically significant region located in Hingoli district of Maharashtra, India. The area is well known for the ancient Aundha Nagnath temple, one of the twelve revered Jyotirlingas dedicated to Lord Shiva. Apart from its religious importance, the region also possesses a diverse natural environment that supports a variety of plant species.
The collection was carried out during the appropriate season to ensure the availability of healthy and mature plant parts. The selected plants were free from disease and physical damage. After collection, the plant material was thoroughly washed with water to remove soil and other contaminants. The cleaned samples were shade-dried at room temperature to preserve their phytochemical constituents. Once completely dried, the plant material was coarsely powdered using a mechanical grinder and stored in airtight containers for further pharmacognostic and phytochemical analysis.
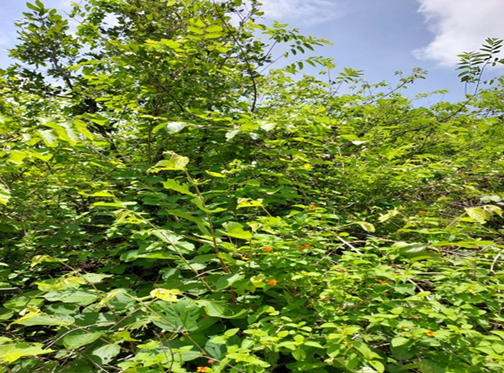
Fig. – Collection of H. isora from Aundha Nagnath
Preparation of Plant Extract by Soxhlet extraction method
5 g of dried and powdered plant material was placed in a thimble and kept inside the Soxhlet apparatus. 300 mL of methanol was taken as the solvent.
The setup was heated using a heating mantle. As the solvent heated up, it evaporated and moved towards the condenser, where it cooled and changed back into liquid form. This liquid then collected in the chamber containing the plant material.
When the solvent level reached a certain point, it automatically flowed back into the flask, carrying the extracted compounds along with it. This cycle kept repeating and helped in proper extraction of the plant constituents.
The process was continued for about 8 hours, completing around 6–7 cycles. After extraction, the collected extract was allowed to dry in air to remove the remaining solvent. The dried extract was then stored properly for further analysis (Redfern et al., 2014; Kasiramar et al., 2019).
Analysis such as preliminary phytochemical screening, total phenolic content (TPC), and total flavonoid content (TFC) analyses were carried out at the Botany Research Laboratory, N. E. S. Science College Nanded. Antioxidant and antidiabetic assays were performed at Infinite Biotech Sangli. HPTLC and LC-MS analyses were conducted at CSIR-National Chemical Laboratory Pune, while FTIR analysis was carried out at Annasaheb Dange College Ashta.
Preliminary Phytochemical Analysis
Preliminary phytochemical screening of the extract was performed using standard qualitative methods to detect the presence of major secondary metabolites such as alkaloids, flavonoids, phenolics, tannins, saponins, glycosides, and terpenoids.
Test for glycosides:
1. Kellar killani test: The extract was treated with glacial acetic acid containing ferric chloride, followed by careful addition of concentrated sulphuric acid along the side of the test tube. The formation of characteristic colour changes was observed.
2. Raymond’s test: The extract was mixed with dinitrobenzene in methanolic alkali and gently heated. The appearance of violet colour was noted.
3. Legal’s test: The extract was treated with pyridine and sodium nitroprusside solution, and the development of pink to red colour was observed.
Test for Alkaloids
1. Mayer’s Test: The test solution was treated with Mayer’s reagent (potassium mercuric iodide). The formation of a cream-colored precipitate was observed, indicating the presence
Test for Flavonoids
1. Ferric Chloride Test: The extract was treated with a few drops of ferric chloride solution.
2. Shinoda Test: The extract was treated with small pieces of magnesium ribbon followed by the addition of concentrated hydrochloric acid.
3. Zinc Hydrochloric Acid Reduction Test: The extract was mixed with zinc dust and a few drops of hydrochloric acid.
4. Alkaline Reagent Test: The extract was treated with sodium hydroxide solution, followed by the addition of dilute acid.
5. Lead acetate solution test: The extract was treated with a few drops of lead acetate solution
Test for steroids:
1. Chloroform test: The extract was dissolved in chloroform. Concentrated sulphuric acid was then carefully added along the side of the test tube.
2. Salkowski’s Test: The extract solution was carefully treated with concentrated sulphuric acid along the side of the test tube to form a separate lower layer.
Test for saponins:
Foam Test: The extract was mixed with water and shaken vigorously for a few minutes.
Test for carbohydrates:
1. Molisch’s Test: The extract was treated with a few drops of Molisch’s reagent, followed by the careful addition of concentrated sulphuric acid along the side of the test tube.
2. Benedict’s test: The extract was treated with Benedict’s reagent and heated in a water bath for a few minutes.
Test for proteins:
1. Millon’s Test: The extract was treated with Millon’s reagent and heated in a water bath.
2. Xanthoproteic Test: The extract was treated with concentrated nitric acid and heated gently.
3. Biuret Test: The extract was treated with sodium hydroxide solution followed by the addition of dilute copper sulphate solution.
4. Ninhydrin Test: The extract was treated with ninhydrin reagent and heated.
Test for starch:
1. Starch reagent test: About 1 mL of the extract was mixed with sodium chloride solution and heated. After heating, starch reagent was added to the mixture.
Test for tannins:
1. Gelatin Test: The extract was dissolved in distilled water, followed by the addition of gelatin solution and sodium chloride solution.
2. NaOH Test: The extract was treated with sodium hydroxide solution and shaken well.
(Shaikh et al., 2020; Basumatary., 2016; Kalita et al.,2017)
Determination of Total Phenolic Content
The total phenolic content of the extract was evaluated using the Folin–Ciocalteu colorimetric method. The extract was prepared at different concentrations ranging from 20 to 100 µg/mL for analysis.
For the assay, 1 mL of the extract was diluted with 9 mL of distilled water in a 25 mL volumetric flask. Subsequently, 1 mL of Folin–Ciocalteu reagent was added and the mixture was mixed thoroughly. After an incubation period of 5 minutes, 10 mL of 7% sodium carbonate solution was added, and the volume was adjusted up to 25 mL with distilled water.
A series of gallic acid standard solutions (20–100 µg/mL) were prepared following the same procedure to generate a calibration curve. The reaction mixtures were allowed to stand at room temperature for 90 minutes.
The absorbance of both sample and standard solutions was recorded at 550 nm against a reagent blank using a spectrophotometer. All experiments were conducted in triplicate to ensure reliability of results. The total phenolic content was expressed as micrograms of gallic acid equivalents (µg GAE/g) of extract (Chang et al.,2002; Ulloa et al., 2024; Nikolaeva et al., 2022).
5. Determination of Total Flavonoid Content
The total flavonoid content of the extract was determined using the aluminium chloride colorimetric method. For the assay, 1 mL of the extract was mixed with 4 mL of distilled water in a 10 mL volumetric flask.
To this mixture, 0.30 mL of 5% sodium nitrite solution was added and allowed to stand for 5 minutes. Subsequently, 0.30 mL of 10% aluminium chloride was added and the mixture was incubated for another 5 minutes. Thereafter, 2 mL of 1 M sodium hydroxide was added, and the final volume was adjusted to 10 mL using distilled water.
Standard solutions of quercetin (200–1000 µg/mL) were prepared following the same procedure to obtain a calibration curve. The absorbance of both the sample and standard solutions was measured at 510 nm against a reagent blank using a spectrophotometer.
All determinations were carried out in triplicate to ensure accuracy. The total flavonoid content was expressed as micrograms of quercetin equivalents (µg QE/g) per gram of extract (Muchandi et al., 2017; Shraim et al., 2021)
Antioxidant Assay
The antioxidant activity of the extract was evaluated based on its free radical scavenging ability using 2,2-diphenyl-1-picrylhydrazyl (DPPH) radicals.
Different concentrations of the extract (20–100 µg/mL) were prepared, and 1 mL of each concentration was taken in separate test tubes. To each tube, 1.5 mL of 0.1% DPPH solution in methanol was added. The reaction mixtures were then incubated in the dark at room temperature for 30 minutes.
Following incubation, the change in colour from deep purple to yellow was monitored, and the absorbance was measured at 510 nm using a colorimeter against an appropriate control.
The percentage of DPPH radical scavenging activity was calculated using the following formula:
(Baliyan et al., 2002; Rumpf et al., 2023).
7. Antidiabetic Assay
The α-amylase inhibitory activity of the extract was evaluated following the method of Bernfeld.
Different concentrations of the extract (20–100 µg/mL) were prepared, and 100 µL of each concentration was mixed with 500 µL of 0.1 M phosphate buffer (pH 6.9) containing α-amylase enzyme. The reaction mixture was incubated at 25°C for 10 minutes.
Subsequently, 500 µL of 1% starch solution prepared in 0.1 M phosphate buffer (pH 6.8) was added, and the mixture was further incubated at 25°C for 10 minutes.
For the control, the enzyme solution was replaced with buffer under similar conditions. After incubation, 1 mL of dinitrosalicylic acid (DNS) reagent was added to both test and control tubes. The mixtures were then heated in a boiling water bath for 10 minutes, followed by cooling to room temperature.
The absorbance was measured at 540 nm using a spectrophotometer. The percentage inhibition of α-amylase activity was calculated using the following equation:
(Zephy et al., 2015; Maritim et al.,2003).
HPTLC Analysis
The Helicteres isora sample solution was prepared by dissolving 5 mg of sample in 5 mL of distilled water, followed by sonication for 5 minutes. The volume was then adjusted to 10 mL with methanol. Further dilution was carried out by taking 1 mL of this solution and making up to 10 mL using methanol and water (1:1) to obtain a final concentration of 50 ppm.
The sample was applied onto pre-coated silica gel 60 F254 HPTLC plates using a Linomat 5 applicator. Each track was applied as bands at a fixed position with controlled dosage.
Chromatographic development was carried out in a twin-trough chamber using a mobile phase consisting of toluene, ethyl acetate, and formic acid in the ratio of 6:3:1 (v/v/v). The chamber was saturated for about 20–25 minutes prior to development. The plate was developed up to a distance of 70 mm.
After development, the plate was dried at room temperature and visualized under UV light at 254 nm. Densitometric scanning was performed at 329 nm using a TLC scanner to record the chromatographic profile of the sample (Chewchinda et al., 2020; Sujatha et al., 2019; Thomas et al., 2020).
LC-MS analysis
The phytochemical profiling of the plant extract was carried out using Liquid Chromatography–Mass Spectrometry (LC–MS) analysis. The extract was first filtered through a membrane filter to remove any particulate matter before injection into the system.
The LC–MS analysis was performed using a suitable chromatographic column under optimized operating conditions. A compatible mobile phase system was used to achieve effective separation of the compounds present in the extract. The sample was introduced into the system, and separation of phytoconstituents was carried out based on their interaction with the stationary and mobile phases.
The eluted compounds were subsequently detected using a mass spectrometer equipped with an appropriate ionization source. The mass spectra of the compounds were recorded over a defined mass range. The identification of compounds was carried out based on their retention time, molecular mass (m/z values), and comparison with available spectral databases.
The obtained chromatogram provided multiple peaks corresponding to different phytoconstituents present in the extract, indicating the presence of diverse bioactive compounds (Thorsteinsdottir et al., 2021; Gandu et al., 2025; Jouaneh et al., 2022).
Cytotoxicity Assay
L929 fibroblast cells were maintained in suitable culture medium and incubated at a density of approximately 1 × 10⁴ cells/ml for 24 hours at 37°C in a humidified atmosphere containing 5% CO₂.
After incubation, the cells were seeded into 96-well tissue culture plates by dispensing 100 µl of cell suspension per well (approximately 1 × 10⁴ cells/well). The cells were then treated with different concentrations of the test samples (20, 40, 60, 80, and 100 µg/ml). Control wells containing cells treated with 0.2% DMSO in PBS were maintained for comparison. All treatments, including controls, were performed in triplicate to ensure accuracy and reproducibility.
The plates were incubated for an additional 24 hours under standard culture conditions (37°C and 5% CO₂). Following the incubation period, the culture medium was carefully removed from each well, and 20 µl of MTT solution (5 mg/ml prepared in PBS) was added.
The plates were then incubated for 4 hours to allow the formation of formazan crystals by metabolically active cells. The development of dark-coloured formazan crystals indicated the presence of viable cells, as the yellow MTT reagent is reduced only by living cells.
After incubation, the medium was completely discarded, and 200 µl of dimethyl sulfoxide (DMSO) was added to each well to dissolve the formed formazan crystals. The plates were kept for approximately 10 minutes at 37°C, protected from light using aluminium foil.
Finally, the absorbance of each well was measured using a microplate reader at a wavelength of 550 nm. The experiment was conducted in triplicate, and the results were used to calculate the percentage of cell viability and inhibition (Stephen., 2005; Sigma-Aldrich. (n.d.); Mosmann.,1983; Hansen et al., 1989).
Anticancer Assay
B16F10 melanoma cells were maintained in appropriate culture medium and incubated at a density of approximately 1 × 10⁴ cells/ml for 24 hours at 37°C in a humidified atmosphere containing 5% CO₂.
Following incubation, the cells were seeded into 96-well tissue culture plates by adding 100 µl of cell suspension per well (approximately 1 × 10⁴ cells/well). The cells were then treated with varying concentrations of the test samples (25, 50, 75, 100, and 125 µg/ml). Control wells containing cells treated with 0.2% DMSO in PBS were included for comparison. All treatments were performed in triplicate to ensure reliability of the results.
The plates were further incubated for 24 hours under standard conditions (37°C and 5% CO₂). After the incubation period, the culture medium was carefully removed from each well, and 20 µl of MTT solution (5 mg/ml prepared in PBS) was added.
The plates were incubated again for 4 hours to allow viable cells to convert the yellow MTT into dark purple formazan crystals. The formation of these crystals indicates metabolically active cells.
After incubation, the medium was completely removed, and 200 µl of dimethyl sulfoxide (DMSO) was added to each well to dissolve the formed formazan crystals. The plates were kept for approximately 10 minutes at 37°C and protected from light by covering with aluminium foil.
Finally, the absorbance of each well was measured using a microplate reader at a wavelength of 550 nm. All experiments were conducted in triplicate, and the data obtained were used to calculate the percentage of cell viability and inhibition (Stephen., 2005; Sigma-Aldrich. (n.d.); Mosmann.,1983; Hansen et al., 1989)
FTIR Analysis
Fourier Transform Infrared (FTIR) spectroscopy was employed to identify the functional groups present in the plant extract. The dried extract was prepared for analysis by mixing with potassium bromide (KBr) to form a fine powder, which was then compressed into a transparent pellet using a hydraulic press.
The prepared pellet was placed in the FTIR spectrophotometer, and the spectrum was recorded over a range of 4000 to 650 cm⁻¹.The obtained spectra were analysed to identify characteristic absorption peaks corresponding to different functional groups present in the extract.
The observed peaks were interpreted based on standard reference values to determine the presence of functional groups such as hydroxyl, carbonyl, amine, and other chemical moieties. This analysis provided useful information regarding the chemical nature of the bioactive compounds present in the extract (Gang et al., 2024; Shen et al., 2023; Munajad et al., 2018).
Results and discussion:
Preliminary Phytochemical Analysis
The preliminary phytochemical screening of Helicteres isora fruit extract revealed the presence of several important bioactive constituents. Glycosides and alkaloids were not detected, as all respective tests showed negative results.
Flavonoids were identified by positive reactions in ferric chloride and lead acetate tests, indicating the presence of phenolic flavonoid compounds known for their antioxidant activity (Kadam et al., 2022). Steroids were confirmed by positive results in chloroform and Salkowski tests, suggesting the presence of steroidal constituents that may contribute to various pharmacological activities (Venkatesh et al., 2024).
Phenolic compounds were detected through a positive ferric chloride test, supporting the antioxidant potential of the extract, as phenols are well recognized for their free radical scavenging ability (Sharma et al., 2023). Saponins showed a partially positive response in the foam test, indicating their presence in trace amounts, which may play a role in biological activity.
Carbohydrates were confirmed by a positive Molisch’s test, while proteins were detected by positive Millon’s and Biuret tests, indicating the presence of essential biomolecules. In contrast, starch and tannins were absent in the extract, as indicated by negative test results.
Overall, the presence of flavonoids, phenols, steroids, and saponins suggests that Helicteres isora extract possesses significant bioactive potential. These phytoconstituents are known to contribute to antioxidant, antidiabetic, and anticancer activities, thereby supporting the observed biological properties of the extract (Rattanamaneerusmee et al., 2018).
Figure 3.1 - Preliminary Phytochemical Analysis of Helicteres isora
|
|
|
|
Negative |
|
Negative |
|
Negative |
|
|
|
|
Test for alkaloids |
|
|
Negative |
|
|
|
|
Test for flavonoids |
|
|
Positive |
|
Negative |
|
Negative |
|
Negative |
|
Positive |
|
|
|
|
Test for steroids |
|
|
1. Chloroform test |
Positive |
|
2. Salkowaski test |
Positive |
|
|
|
|
Test for phenols |
|
|
Positive |
|
|
|
|
Test for saponins |
|
|
Partially positive |
|
|
|
|
Test for carbohydrates |
|
|
Positive |
|
Negative |
|
|
|
|
Test for proteins |
|
|
Positive |
|
Negative |
|
Positive |
|
Negative |
|
|
|
|
Test for starch |
|
|
Negative |
|
|
|
|
Test for tannins |
|
|
Negative |
|
Negative |
Table 3.1: Preliminary phytochemical analysis of Helicteres isora fruit extract
Total Phenolic Content
The total phenolic content (TPC) of Helicteres isora fruit extract was determined using the Folin–Ciocalteu method with gallic acid as the standard. The absorbance values increased with increasing concentration, indicating a concentration-dependent response of phenolic compounds in the extract. The TPC was found to range from 6.5 to 45.5 µg GAE/g across the tested concentrations, demonstrating a gradual increase in phenolic content with concentration.
This increase suggests that the extract contains appreciable amounts of phenolic constituents, which are known to contribute significantly to antioxidant activity due to their ability to donate hydrogen atoms and neutralize free radicals. Similar concentration-dependent increases in phenolic content have been reported in plant extracts using the Folin–Ciocalteu method, supporting the reliability of this assay for phenolic estimation (Latif et al., 2024).
Furthermore, the presence of phenolic compounds in higher concentrations may be directly associated with the biological activities observed in the extract, particularly antioxidant and therapeutic effects. Previous studies have demonstrated a positive correlation between phenolic content and free radical scavenging activity, indicating that phenolics play a crucial role in reducing oxidative stress (Sharma et al., 2026).
Overall, the results confirm that Helicteres isora fruit extract is a rich source of phenolic compounds, which may contribute to its pharmacological potential.
Figure 3.2: Total phenolic content estimation using Folin–Ciocalteu method showing standard (gallic acid) and Helicteres isora fruit extract at different concentrations
The results are presented in Table 3.2 where the values are expressed as mean ± standard deviation (SD) based on triplicate measurements. The low variation among replicate readings indicates good precision and reliability of the experimental data.
|
Sr. No. |
Concentration (µg/ml) |
Test 1 |
Test 2 |
Test 3 |
Mean ± SD |
Total Phenolic Content (µg GAE/g) |
|
1 |
20 |
0.062 |
0.065 |
0.068 |
0.065 ± 0.003 |
6.5 |
|
2 |
40 |
0.121 |
0.125 |
0.129 |
0.125 ± 0.004 |
12.5 |
|
3 |
60 |
0.202 |
0.205 |
0.209 |
0.205 ± 0.004 |
20.5 |
|
4 |
80 |
0.321 |
0.325 |
0.329 |
0.325 ± 0.004 |
32.5 |
|
5 |
100 |
0.453 |
0.455 |
0.459 |
0.455 ± 0.003 |
45.5 |
Table 3.2 Total phenolic content of Helicteres isora fruit extract
Total Flavonoid Content
The total flavonoid content (TFC) of Helicteres isora fruit extract was quantified using the aluminium chloride colorimetric method, employing quercetin as the reference standard. A progressive increase in absorbance was observed with increasing concentrations of the extract, indicating a clear concentration-dependent response and validating the suitability of the method for flavonoid estimation.
The TFC of the extract ranged from 13.8 to 56.4 µg QE/g across the tested concentrations. This steady rise in flavonoid content reflects the effective extraction of flavonoid compounds and suggests that the fruit of Helicteres isora is a considerable source of these bioactive constituents.
Flavonoids are well-recognized for their antioxidant, anti-inflammatory, and therapeutic activities, primarily due to their ability to donate hydrogen atoms or electrons and scavenge free radicals. The appreciable flavonoid content observed in the present study may therefore contribute significantly to the pharmacological potential of the extract. Similar findings have been reported in earlier studies, where Helicteres isora fruit extracts demonstrated notable flavonoid content along with associated biological activities such as antioxidant and antimicrobial effects (Rattanamaneerusmee et al., 2018).
Furthermore, the aluminium chloride method is based on the formation of stable complexes between flavonoids and aluminium ions, resulting in measurable colour intensity proportional to flavonoid concentration (Chang et al., 2002). The consistency of the present results with established literature supports the reliability of the method and confirms the presence of flavonoid compounds in substantial amounts in the studied extract.
Values are presented as mean ± SD calculated from triplicate readings, indicating consistency and reproducibility of the experimental results.
Figure 3.3: Total flavonoid content estimation using aluminium chloride method showing standard (quercetin) and Helicteres isora fruit extract at different concentrations
|
Sr. No. |
Concentration (µg/ml) |
Test 1 |
Test 2 |
Test 3 |
Mean ± SD |
Total Flavonoid Content (µg QE/g) |
|
1 |
20 |
0.136 |
0.137 |
0.142 |
0.138 ± 0.003 |
13.8 |
|
2 |
40 |
0.205 |
0.209 |
0.212 |
0.208 ± 0.004 |
20.8 |
|
3 |
60 |
0.327 |
0.330 |
0.335 |
0.330 ± 0.004 |
33.0 |
|
4 |
80 |
0.402 |
0.405 |
0.409 |
0.405 ± 0.004 |
40.5 |
|
5 |
100 |
0.560 |
0.565 |
0.569 |
0.564 ± 0.005 |
56.4 |
Table 3.3: Total flavonoid content of Helicteres isora fruit extract
Antioxidant assay
A concentration-dependent increase in free radical scavenging activity was observed for both the standard and the extract. The standard exhibited higher antioxidant activity, with percentage inhibition increasing from 26.42% to 76.16% across the tested concentrations. In comparison, the extract showed a gradual increase from 15.02% to 55.95%, indicating moderate antioxidant potential.
At intermediate concentrations (40–80 µg/ml), the extract demonstrated a steady rise in inhibition (20.20%–31.60%), confirming a dose-dependent response. However, its activity remained consistently lower than that of the standard at all concentrations. This is further supported by the higher IC₅₀ value of the extract (92.36 µg/ml) compared to the standard (58.30 µg/ml), indicating comparatively lower antioxidant efficiency.
The observed antioxidant activity may be attributed to the presence of flavonoids and phenolic compounds, which are known to neutralize free radicals through hydrogen or electron donation mechanisms. Similar findings have been reported for Helicteres isora, where the fruit extract exhibited appreciable antioxidant activity (Suthar et al., 2009). Another study also reported significant free radical scavenging potential of Helicteres isora extracts, supporting the present observations (Mahajan et al.,2020). The results, expressed as mean ± SD of triplicate measurements, indicate good precision and reliability of the experimental data.
Figure 3.4: Microplate representation of DPPH assay indicating antioxidant activity of standard ascorbic acid and Helicteres isora fruit extract across varying concentrations
Standard: Ascorbic acid
|
Sr. No. |
Concentration (µg/ml) |
Test 1 |
Test 2 |
Test 3 |
Mean ± SD |
% Inhibition |
IC₅₀ (µg/ml) |
|
1 |
20 |
1.45 |
1.42 |
1.40 |
1.42 ± 0.02 |
26.42 |
|
|
2 |
40 |
1.39 |
1.40 |
1.38 |
1.39 ± 0.01 |
27.97 |
|
|
3 |
60 |
0.95 |
0.97 |
0.93 |
0.95 ± 0.02 |
50.77 |
|
|
4 |
80 |
0.82 |
0.85 |
0.79 |
0.82 ± 0.03 |
57.51 |
|
|
5 |
100 |
0.46 |
0.45 |
0.46 |
0.46 ± 0.01 |
76.16 |
58.30 |
Table 3.4: DPPH free radical scavenging activity of standard ascorbic acid
Helicteres isora
|
Sr. No. |
Concentration (µg/ml) |
Test 1 |
Test 2 |
Test 3 |
Mean ± SD |
% Inhibition |
IC₅₀ (µg/ml) |
|
1 |
20 |
1.64 |
1.66 |
1.62 |
1.64 ± 0.02 |
15.02 |
|
|
2 |
40 |
1.55 |
1.52 |
1.55 |
1.54 ± 0.02 |
20.20 |
|
|
3 |
60 |
1.40 |
1.43 |
1.38 |
1.40 ± 0.02 |
27.46 |
|
|
4 |
80 |
1.32 |
1.35 |
1.30 |
1.32 ± 0.02 |
31.60 |
|
|
5 |
100 |
0.85 |
0.85 |
0.85 |
0.85 ± 0.00 |
55.95 |
92.36 |
Table 3.5: DPPH free radical scavenging activity of Helicteres isora fruit extract
Figure 3.6: Comparative antioxidant activity of standard (ascorbic acid) and Helicteres isora fruit extract at different concentrations using DPPH assay
Antidiabetic assay
A concentration-dependent increase in enzyme inhibitory activity was observed for both the standard and the extract. The standard showed percentage inhibition ranging from 6.89% to 75.86%, whereas the extract exhibited values from 23.56% to 60.34%, indicating moderate α-amylase inhibitory potential.
At intermediate concentrations (40–80 µg/ml), the extract demonstrated a steady increase in inhibition (30.45%–54.59%), confirming a dose-dependent response. Interestingly, the extract showed higher inhibitory activity than the standard at lower concentrations, suggesting the presence of potent bioactive constituents acting effectively at minimal doses. However, at higher concentrations, the standard exhibited superior inhibition.
The IC₅₀ value of the extract (75.41 µg/ml) was higher than that of the standard (62.13 µg/ml), indicating comparatively lower inhibitory potency. The antidiabetic activity observed in the extract may be attributed to the presence of phytoconstituents such as flavonoids and phenolic compounds, which are known to inhibit carbohydrate-hydrolysing enzymes and delay glucose absorption.
Similar findings have been reported for Helicteres isora, where the fruit extract demonstrated significant α-amylase inhibitory activity supporting its antidiabetic potential (Jeba et al., 2021). Another study also highlighted the role of plant-derived phenolic compounds in enzyme inhibition and glycaemic (Chandirasegaran et al., 2016).
The results, expressed as mean ± SD of triplicate measurements, indicate good precision and reliability of the experimental data.
Figure 3.7: α-amylase inhibition assay showing antidiabetic activity of Helicteres isora fruit extract at different concentrations
Figure 3.8: Antidiabetic activity of Helicteres isora extract and standard drug showing percentage inhibition at different concentrations (20–100 µg/ml) using α-amylase inhibition assay
Standard: Acarbose
|
Sr. No. |
Concentration (µg/ml) |
Test 1 |
Test 2 |
Test 3 |
Mean ± SD |
% Inhibition |
IC₅₀ (µg/ml) |
|
1 |
20 |
1.62 |
1.62 |
1.63 |
1.62 ± 0.01 |
6.89 |
|
|
2 |
40 |
1.31 |
1.32 |
1.31 |
1.31 ± 0.01 |
24.71 |
|
|
3 |
60 |
1.09 |
1.08 |
1.07 |
1.08 ± 0.01 |
37.93 |
|
|
4 |
80 |
0.82 |
0.83 |
0.82 |
0.82 ± 0.01 |
52.87 |
|
|
5 |
100 |
0.43 |
0.43 |
0.42 |
0.42 ± 0.01 |
75.86 |
62.13 |
Table 3.6: α-amylase inhibitory activity of standard acarbose
Helicteres isora
|
Sr. No. |
Concentration (µg/ml) |
Test 1 |
Test 2 |
Test 3 |
Mean ± SD |
% Inhibition |
IC₅₀ (µg/ml) |
|
1 |
20 |
1.37 |
1.34 |
1.30 |
1.33 ± 0.04 |
23.56 |
|
|
2 |
40 |
1.21 |
1.24 |
1.18 |
1.21 ± 0.03 |
30.45 |
|
|
3 |
60 |
1.11 |
1.12 |
1.10 |
1.11 ± 0.01 |
36.20 |
|
|
4 |
80 |
0.79 |
0.82 |
0.77 |
0.79 ± 0.03 |
54.59 |
|
|
5 |
100 |
0.68 |
0.70 |
0.71 |
0.69 ± 0.02 |
60.34 |
75.41 |
Table 3.7: α-amylase inhibitory activity of Helicteres isora
HPTLC analysis
The chromatographic profile exhibited well-resolved and distinct peaks, indicating the presence of multiple phytoconstituents in the extract. The sample tracks showed Rf values ranging from 0.402 to 0.470, with prominent peaks observed at 0.429, 0.432, 0.443, 0.456, and 0.470. The similarity of these Rf values with those of the standard suggests the presence of comparable bioactive compounds in the extract.
An increase in peak area with increasing sample concentration was observed, indicating a consistent response and good linearity of the analytical method. The peaks were sharp and symmetrical, reflecting efficient separation and minimal interference from other constituents. The reproducibility of Rf values across different tracks further confirms the reliability and precision of the method.
The detection of quercetin in the extract indicates the presence of flavonoid compounds, which are known for their significant pharmacological activities. Similar chromatographic profiles and the presence of flavonoids in Helicteres isora have been reported in previous studies, supporting the phytochemical richness of the plant (Dhole et al., 2022). Another study also confirmed the applicability of HPTLC as a reliable technique for the identification and quantification of flavonoids such as quercetin in plant extracts (Tiwari et al., 2010).
Overall, the HPTLC profile confirms the presence of bioactive constituents and validates the phytochemical significance of Helicteres isora.
Figure 3.9: HPTLC chromatographic profile of standard and Helicteres isora extract observed under UV light (254 nm)
Figure 3.10: HPTLC densitogram of standard showing peak at 329 nm
Figure 3.11: HPTLC densitogram of Helicteres isora extract showing peaks at 329 nm
LC-MS analysis
The analysis revealed a total of 41 compounds, indicating a complex phytochemical composition of the extract. Among these, only biologically relevant and plant-associated compounds were considered for further interpretation. The chromatogram displayed peaks at retention times ranging from 2.366 to 28.752 minutes, suggesting the presence of both polar and non-polar constituents.
The identified compounds predominantly belonged to phenolic derivatives, fatty acids, terpenoid-like structures, and nitrogen-containing bioactive molecules. The wide range of retention times and molecular weights reflects the structural diversity of phytoconstituents present in the extract.
These classes of compounds are well known for their pharmacological significance, particularly in relation to antioxidant and antidiabetic activities. Phenolic compounds and flavonoids are widely reported to exhibit strong free radical scavenging properties, while fatty acids and certain nitrogen-containing compounds have been associated with metabolic regulation and enzyme inhibition.
A comprehensive LC–MS-based profiling of Helicteres isora remains largely unexplored. In this context, the present study represents a novel contribution towards the identification and characterization of its bioactive constituents.
Overall, the findings confirm that Helicteres isora is a rich source of structurally diverse bioactive compounds, which may be responsible for its observed biological activities.
.
|
Sr. No. |
Retention Time (min) |
Molecular Formula |
Molecular Weight (g/mol) |
Compound Name |
Class |
|
1 |
8.009 |
C₈H₆O₂ |
134.0361 |
6Z-Octene-2,4-diynoic acid |
Organic acid |
|
2 |
11.509 |
C₉H₉O₃ |
165.0564 |
Phenolic derivative |
Phenol |
|
3 |
12.978 |
C₇H₆N₃O₂S |
196.0172 |
Heterocyclic compound |
Alkaloid-like |
|
4 |
14.592 |
C₁₆H₃₀NO₅ |
316.2127 |
Fatty acid derivative |
Lipid |
|
5 |
15.492 |
C₁₆H₁₄N₄O₅ |
342.0967 |
Nitrogen-containing compound |
Bioactive |
|
6 |
18.455 |
C₁₈H₁₉N₂O₃ |
311.1400 |
Aromatic compound |
Phenolic |
|
7 |
25.103 |
C₃₀H₃₄O₃ |
442.2507 |
Terpenoid derivative |
Terpenoid |
|
8 |
27.003 |
C₂₈H₃₂N₃O₂ |
442.2503 |
Bioactive compound |
Alkaloid-like |
Table 3.8: Selected bioactive compounds identified in Helicteres isora extract by LC-MS analysis
Figure 3.12: LC-MS total ion chromatogram (TIC) of Helicteres isora extract obtained using APCI mode showing multiple peaks at different retention times
Figure 3.13: LC-MS mass spectrum of a major compound identified in Helicteres isora extract showing characteristic m/z peaks
Cytotoxicity Assay
A dose-dependent increase in cytotoxic activity was observed for the standard, with percentage inhibition rising from 38.25% to 86.09% across the tested concentration range. Correspondingly, cell viability decreased markedly from 61.75% to 13.91%, with an IC₅₀ value of 39.33 µg/ml, indicating strong cytotoxic potential.
In contrast, the Helicteres isora extract exhibited minimal growth inhibition, ranging from 3.31% to 9.65%, while maintaining high cell viability (96.69%–90.35%) across all concentrations. The IC₅₀ value was not achieved within the tested range, suggesting negligible cytotoxicity towards normal L929 cell lines and indicating good biocompatibility of the extract.
The low variation in mean ± SD values reflect good precision and reproducibility of the experimental data. The observed non-toxic nature of the extract may be attributed to the presence of bioactive phytoconstituents that exhibit therapeutic effects without causing significant damage to normal cells. Such selective behaviour is desirable in pharmacological studies, particularly for compounds intended for long-term use.
Similar observations have been reported for Helicteres isora, where the extract demonstrated biological activity with minimal toxicity towards normal cells. And plant-derived compounds are reported to exhibit low cytotoxicity in normal cell lines while maintaining pharmacological potential (Swami et al., 2021).
Although the present study demonstrated significant cytotoxic activity of Helicteres isora extract, limited scientific investigations have been reported on its cytotoxic potential, indicating the need for further detailed studies to explore its mechanism of action and therapeutic applications.
Figure 3.14: Microscopic image of L929 cells treated with Helicteres isora extract showing cell morphology and viability under MTT assay
Standard: Ethanol
|
Concentration (µg/ml) |
Test 1 |
Test 2 |
Test 3 |
Mean ± SD |
% Inhibition |
% Viability |
IC₅₀ (µg/ml) |
|
20 |
0.916 |
0.915 |
0.916 |
0.915 ± 0.001 |
38.25% |
61.75% |
|
|
40 |
0.732 |
0.729 |
0.734 |
0.731 ± 0.003 |
50.67% |
49.33% |
|
|
60 |
0.507 |
0.504 |
0.502 |
0.504 ± 0.003 |
65.99% |
34.01% |
|
|
80 |
0.315 |
0.312 |
0.314 |
0.313 ± 0.002 |
78.87% |
21.13% |
|
|
100 |
0.208 |
0.205 |
0.207 |
0.206 ± 0.002 |
86.09% |
13.91% |
39.33 |
Table 3.9: Cytotoxic effect of Standard on L929 cell line
Helicteres isora
|
Concentration (µg/ml) |
Test 1 |
Test 2 |
Test 3 |
Mean ± SD |
% Inhibition |
% Viability |
IC₅₀ (µg/ml) |
|
20 |
1.434 |
1.431 |
1.434 |
1.433 ± 0.002 |
3.31% |
96.69% |
|
|
40 |
1.417 |
1.412 |
1.419 |
1.416 ± 0.004 |
4.45% |
95.55% |
|
|
60 |
1.386 |
1.382 |
1.387 |
1.385 ± 0.003 |
6.55% |
93.45% |
|
|
80 |
1.365 |
1.369 |
1.362 |
1.365 ± 0.004 |
7.89% |
92.11% |
|
|
100 |
1.338 |
1.334 |
1.345 |
1.339 ± 0.006 |
9.65% |
90.35% |
NE |
Table 3.10: Cytotoxic effect of Helicteres isora extract on L929 cell line
Anticancer Assay
The anticancer activity of the standard (5-Fluorouracil) and Helicteres isora extract was evaluated using the MTT assay. The standard exhibited a strong dose-dependent anticancer effect, with percentage inhibition increasing from 38.25% to 86.09% as the concentration increased from 20 to 100 µg/ml. Correspondingly, cell viability decreased from 61.75% to 13.91%, with an IC₅₀ value of 39.33 µg/ml, indicating potent anticancer activity.
In contrast, the Helicteres isora extract demonstrated a moderate concentration-dependent increase in growth inhibition ranging from 7.89% to 62.55%, while cell viability decreased from 92.11% to 37.45% across the tested concentrations. However, the IC₅₀ value was not achieved within the tested range, suggesting comparatively lower anticancer activity than the standard.
The low standard deviation values across all concentrations indicate good reproducibility and reliability of the experimental data. Overall, the findings suggest that while the standard drug exhibits strong anticancer potential, Helicteres isora extract shows moderate activity and may serve as a promising natural therapeutic candidate.
Although specific reports on Helicteres isora against skin cancer models are limited, plant-derived compounds are widely known for their anticancer properties (Cragg et al., 2005). In this context, the present study provides novel insights into its growth inhibitory potential.
Figure 3.15: Microscopic image of cancer cells treated with Helicteres isora extract showing morphological alterations and reduced cell viability
Standard :5-Fluorouracil
|
Concentration (µg/ml) |
Test 1 |
Test 2 |
Test 3 |
Mean ± SD |
% Inhibition |
% Viability |
IC₅₀ (µg/ml) |
|
20 |
0.916 |
0.915 |
0.916 |
0.915 ± 0.001 |
38.25% |
61.75% |
|
|
40 |
0.732 |
0.729 |
0.734 |
0.731 ± 0.003 |
50.67% |
49.33% |
|
|
60 |
0.507 |
0.504 |
0.502 |
0.504 ± 0.003 |
65.99% |
34.01% |
|
|
80 |
0.315 |
0.312 |
0.314 |
0.313 ± 0.002 |
78.87% |
21.13% |
|
|
100 |
0.208 |
0.205 |
0.207 |
0.206 ± 0.002 |
86.09% |
13.91% |
39.33 |
Table 3.12: In vitro anticancer activity of standard 5-Fluorouracil by MTT assay
Helicteres isora
|
Concentration (µg/ml) |
Test 1 |
Test 2 |
Test 3 |
Mean ± SD |
% Inhibition |
% Viability |
IC₅₀ (µg/ml) |
|
20 |
1.365 |
1.368 |
1.362 |
1.365 ± 0.003 |
7.89% |
92.11% |
|
|
40 |
1.202 |
1.206 |
1.208 |
1.205 ± 0.003 |
18.69% |
81.31% |
|
|
60 |
0.943 |
0.947 |
0.951 |
0.947 ± 0.004 |
36.10% |
63.90% |
|
|
80 |
0.778 |
0.772 |
0.775 |
0.775 ± 0.003 |
47.71% |
52.29% |
|
|
100 |
0.556 |
0.558 |
0.551 |
0.555 ± 0.004 |
62.55% |
37.45% |
NE |
Table 3.13: In vitro anticancer activity of Helicteres isora extract by MTT assay
FIIR analysis
The FTIR spectrum of Helicteres isora extract revealed the presence of various functional groups corresponding to different bioactive compounds. A broad absorption peak observed around 3418 cm⁻¹ indicates O–H stretching vibrations, suggesting the presence of phenolic compounds and alcohols. The peaks at 3067 cm⁻¹ and 2883 cm⁻¹ correspond to aromatic and aliphatic C–H stretching vibrations.
A prominent peak at 1660 cm⁻¹ is attributed to C=O stretching, indicating the presence of carbonyl groups. The absorption bands at 1583 cm⁻¹ and 1487 cm⁻¹ represent C=C stretching of aromatic rings, confirming the presence of phenolic and flavonoid compounds. Further, peaks at 1319 cm⁻¹ and 1145 cm⁻¹ correspond to C–O stretching vibrations, suggesting the presence of alcohols, ethers, and other oxygenated functional groups.
Additionally, peaks observed in the lower region such as 937 cm⁻¹, 885 cm⁻¹, and 703 cm⁻¹ indicate bending vibrations associated with substituted aromatic compounds. Overall, the FTIR analysis confirms the presence of multiple functional groups, supporting the phytochemical composition and biological activity of Helicteres isora extract.
Figure 3.16: FTIR spectrum of Helicteres isora extract showing characteristic absorption peaks of functional
groups
|
Sr. No. |
Peak (cm⁻¹) |
Functional Group |
Assignment |
|
1 |
3418.87 |
O–H stretching |
Phenols / Alcohols |
|
2 |
3067.32 |
C–H stretching |
Aromatic compounds |
|
3 |
2883.40 |
C–H stretching |
Aliphatic compounds |
|
4 |
2759.86 |
C–H stretching |
Aldehydic group |
|
5 |
1660.10 |
C=O stretching |
Carbonyl compounds |
|
6 |
1583.16 |
C=C stretching |
Aromatic ring |
|
7 |
1487.99 |
C=C stretching |
Aromatic compounds |
|
8 |
1319.50 |
C–O stretching |
Phenols / Alcohols |
|
9 |
1145.20 |
C–O stretching |
Ethers / Alcohols |
|
10 |
937.73 |
=C–H bending |
Alkene group |
|
11 |
885.78 |
C–H bending |
Aromatic compounds |
|
12 |
703.25 |
C–H bending |
Substituted benzene |
|
13 |
640.18 |
C–H bending |
Aromatic compounds |
Table 3.14: FTIR spectral analysis of Helicteres isora extract showing functional groups
FTIR spectroscopy is widely used for the identification of functional groups in plant extracts (Stuart., 2004). However, limited reports are available on FTIR analysis of Helicteres isora, and the present study provides insights into its functional group composition.
CONCLUSION :
The present investigation comprehensively evaluated the phytochemical composition and pharmacological potential of Helicteres isora using a combination of qualitative, quantitative, analytical, and biological approaches. Preliminary phytochemical analysis confirmed the presence of major secondary metabolites such as flavonoids, phenols, tannins, alkaloids, and other bioactive constituents, indicating its rich phytochemical profile.
Quantitative estimation revealed significant levels of total phenolic content by the Folin–Ciocalteu method and total flavonoid content by the aluminium chloride method, suggesting strong antioxidant potential. This was further supported by antioxidant assays, which demonstrated notable free radical scavenging activity of the extract. Additionally, the extract exhibited promising antidiabetic activity, indicating its potential role in managing metabolic disorders.
Advanced analytical techniques further validated these findings. HPTLC profiling provided characteristic fingerprint patterns confirming the presence of diverse phytoconstituents, while LC–MS analysis enabled the identification of several bioactive compounds that may be responsible for the observed biological activities. FTIR analysis confirmed the presence of functional groups corresponding to these phytochemicals, thereby supporting the overall chemical characterization of the extract.
Importantly, the study demonstrated significant cytotoxic and anticancer activity of Helicteres isora against skin cancer cell lines, indicating its potential as a promising source of anticancer agents. Notably, the cytotoxic and anticancer potential of this plant remains relatively underexplored, and the present work contributes novel insights into this aspect by systematically evaluating its effects using in-vitro models.
Overall, the findings suggest that Helicteres isora possesses considerable therapeutic potential due to its rich phytochemical composition and diverse biological activities. However, despite these encouraging results, limited scientific investigations are available, particularly regarding its cytotoxic and anticancer mechanisms. Therefore, further detailed studies involving molecular mechanism elucidation, isolation of active compounds, and clinical validation are required to establish its efficacy and safety for therapeutic applications.
BIBLIOGRAPHY:
1. Giovannucci E, Harlan DM, Archer MC, Bergenstal RM, Gapstur SM, Habel LA, Pollak M, Regensteiner JG, Yee D. Diabetes and cancer: a consensus report. Diabetes Care. 2010 Jul;33(7):1674-85. doi: 10.2337/dc10-0666. PMID: 20587728; PMCID: PMC2890380.
2. Hanahan, D., & Weinberg, R. A. (2011). Hallmarks of cancer: The next generation. Cell, 144(5), 646–674. https://doi.org/10.1016/j.cell.2011.02.013
3. Klement, R. J. (2024). Cancer as a global health crisis with deep evolutionary roots. Global Transitions, 6, 45–65.
4. Stein, K. D., Syrjala, K. L., & Andrykowski, M. A. (2008). Physical and psychological long-term and late effects of cancer. Cancer, 112(S11), 2577–2592. https://doi.org/10.1002/cncr.23448
5. Quintero-Rincón, P., Caballero-Gallardo, K., & Olivero-Verbel, J. (2025). Natural anticancer agents: Prospection of medicinal and aromatic plants in modern chemoprevention and chemotherapy. Natural Product Bioprospecting, 15(1), 25. https://doi.org/10.1007/s13659-025-00511-0
6. American Diabetes Association. (2010). Diagnosis and classification of diabetes mellitus. Diabetes Care, 33(Suppl 1), S62–S69. https://doi.org/10.2337/dc10-S062
7. Antar, S. A., Ashour, N. A., Sharaky, M., Khattab, M., Ashour, N. A., Zaid, R. T., Roh, E. J., Elkamahwy, A., & Al-Karmalawy, A. A. (2023). Diabetes mellitus: Classification, mediators, and complications: A gate to identify potential targets for the development of new effective treatments. Biomedicine & Pharmacotherapy, 168, 115734. https://doi.org/10.1016/j.biopha.2023.115734
8. Jacob, B., & Narendhirakannan, R. T. (2019). Role of medicinal plants in the management of diabetes mellitus: A review. 3 Biotech, 9(1), 4. https://doi.org/10.1007/s13205-018-1528-0
9. Liu H., Zhang T.Y., Wang Y.W., Gao J.J. (2025). Risk factors for cancer among patients with type 2 diabetes: A retrospective cohort study. BMC Cancer, 25(1), 1059.
10. Cignarelli A., Genchi V. A., Caruso I., Natalicchio A., Perrini S., Laviola L., Giorgino F. (2018). Diabetes and cancer: Pathophysiological fundamentals of a “dangerous affair.” Diabetes Research and Clinical Practice, 143, 378–388.
11. Sempere-Bigorra M., Julián-Rochina I., Cauli O. (2021). Chemotherapy-Induced Neuropathy and Diabetes: A Scoping Review. Current Oncology, 28(4), 3124–3138. https://doi.org/10.3390/curroncol28040273
12. Les, F., Valero, M. S., & Arruebo, M. P. (2024). Natural product chemistry and biological research. International Journal of Molecular Sciences, 25(7), 3774. https://doi.org/10.3390/ijms25073774.
13. Liu, T., & Chen, X. (2024). Bioactive compounds from natural sources: Discovery, evaluation, and applications. Molecules, 29(13), 3209.
14. Thapa, B. (2024). Experimental and preclinical investigations of Helicteres isora extracts in drug discovery. International Journal of Pharmaceutical and Clinical Research, 6(2), 144–147.
15. Sharma V., Chaudhary U. (2016). Pharmacognostic and phytochemical screening of Helicteres isora roots. Asian Journal of Pharmaceutical and Clinical Research, 9(Suppl. 2), 121–128.
16. Suthar M., Rathore G. S., Pareek A. (2009). Antioxidant and antidiabetic activity of Helicteres isora (L.) fruits. Indian Journal of Pharmaceutical Sciences, 71(6), 695–699.
17. Bhujbal S., Rupenthal I. D., Agarwal P. (2024). Development and validation of a stability-indicating HPLC method for assay of tonabersat in pharmaceutical formulations. Methods, 231, 178–185.
18. Ramachandram D., Dinesh R. (2016). LCMS – A review and a recent update. World Journal of Pharmacy and Pharmaceutical Sciences, 5, 377
19. Redfern, J., Kinninmonth, M., Burdass, D., & Verran, J. (2014). Using Soxhlet ethanol extraction to produce and test plant material (essential oils) for their antimicrobial properties. Journal of Microbiology & Biology Education, 15(1), 45–46. https://doi.org/10.1128/jmbe.v15i1.656
20. Kasiramar, G., & Gopalasatheeskumar, K. (2018). Significant role of Soxhlet extraction process in phytochemical research. Mintage Journal of Pharmaceutical & Medical Sciences, 7(Suppl 1), 43–47.
21. Shaikh, J., & Patil, M. (2020). Qualitative tests for preliminary phytochemical screening: An overview. International Journal of Chemical Studies, 8, 603–608.
22. Ayetree Rai Basumatary. (2016). Preliminary phytochemical screening of some compounds from plant stem bark extracts of Tabernaemontana divaricata Linn. used by Bodo community at Kokrajhar District, Assam, India. Archives of Applied Science Research, 8(8), 47–52.
23. Kalita, L., Dash, B., Borah, U., Deka, J., & Dash, S. (2017). Preliminary phytochemical analysis and antimicrobial activity ethanolic extracts of dried fruits of Solanum torvum (family-Solanaceae). International Journal of Current Pharmaceutical Research, 9(3).
24. Chang C. C., Yang M. H., Wen H. M. (2002) Estimation of total flavonoids content in propolis by two complementary colorimetric methods. Journal of Food and Drug Analysis 23: 77-85.
25. Franco-Ulloa, D., Luaces-Alberto, M. D., Valdés-Gonzalez, A. C., Agüero-Luzón, L., & Baeza-Fonte, A. N. (2024). Determination of total phenolic compounds in Cuban monofloral honeys by reverse flow injection analysis – Folin–Ciocalteu method. Microchemical Journal, 204, 111008.
26. Nikolaeva, T., Lapshin, P., & Zagoskina, N. (2022). Method for determining the total content of phenolic compounds in plant extracts with Folin–Denis reagent and Folin–Ciocalteu reagent: Modification and comparison. Russian Journal of Bioorganic Chemistry, 48, 1519–1525.
27. Muchandi, A. A., & Dhawale, S. C. (2017). Estimation of total phenolic contents, total flavonoid contents and muscle co-ordination activity of ethanolic extract of Stereospermum suaveolens DC. International Journal of Research in Pharmaceutical and Nano Sciences, 6(3), 118–124.
28. Baliyan, S., Mukherjee, R., Priyadarshini, A., Vibhuti, A., Gupta, A., Pandey, R. P., & Chang, C. M. (2022). Determination of antioxidants by DPPH radical scavenging activity and quantitative phytochemical analysis of Ficus religiosa. Molecules, 27(4), 1326. https://doi.org/10.3390/molecules27041326
29. Rumpf, J., Burger, R., & Schulze, M. (2023). Statistical evaluation of DPPH, ABTS, FRAP, and Folin–Ciocalteu assays to assess the antioxidant capacity of lignins. International Journal of Biological Macromolecules, 233, 123470.
30. Zephy D., Ahmad J. Type 2 diabetes mellitus: role of melatonin and oxidative stress. Diabetes Metab Syndr: Clinical Research & Reviews. 2015;9(2):127–131.
31. Maritim, A. C., Sanders, R. A., & Watkins, J. B., III. (2003). Diabetes, oxidative stress, and antioxidants: A review. Journal of Biochemical and Molecular Toxicology, 17(1), 24–38.
32. Chewchinda, S., & Kongkiatpaiboon, S. (2020). A validated HPTLC method for quantitative analysis of morin in Maclura cochinchinensis heartwood. Chinese Herbal Medicines, 12(2), 200–203.
33. Sujatha, S., & Sekar, T. (2019). Phytochemical screening and HPTLC method for phytochemical compounds present in extracts of leaf and stem Litsea laevigata Gamble. Journal of Pharmacognosy and Phytochemistry, 8(2), 970–977.
34. Thomas, A., Kankadhari, A., Shiras, A., Deshkar, S., & Kothapalli, L. (2020). A high-performance thin layer chromatographic method using a design of experiment approach for estimation of phytochemicals in extracts of Moringa oleifera leaves. Turkish Journal of Pharmaceutical Sciences, 17(2), 148–158.
35. Thorsteinsdottir, U. A., & Thorsteinsdottir, M. (2021). Design of experiments for development and optimization of a LC-MS/MS bioanalytical assay. Journal of Mass Spectrometry, 56.
36. Jouaneh, T. M. M., Rosario, M. E., Li, Y., Leibovitz, E., & Bertin, M. J. (2022). Incorporating LC-MS/MS analysis and the dereplication of natural product samples into an upper-division undergraduate laboratory course. Journal of Chemical Education, 99(7), 2636–2642.
37. Gandu, S., Gandla, K., & Repudi, L. (2025). Development and validation of an LC–MS/MS method for the simultaneous estimation of tadalafil and macitentan in rat plasma: Greenness assessment and design of experiment approach. Green Analytical Chemistry, 12, 100211.
38. Stephen, J. (2005). Basic biology and clinical assessment (pp. 343–349).
39. Sigma-Aldrich. (n.d.). MTT assay protocol for cell viability and proliferation. Sigma-Aldrich.
40. Mosmann, T. (1983). Rapid colorimetric assay for cellular growth and survival: Application to proliferation and cytotoxicity assays. Journal of Immunological Methods, 65(1–2), 55–63.
41. Hansen, M. B., Nielsen, S. E., & Berg, K. (1989). Re-examination and further development of a precise and rapid dye method for measuring cell growth/cell kill. Journal of Immunological Methods, 119(2), 203–210.
42. Shen, H., Fu, C., Zhang, J., Feng, B., & Yu, S. (2023). Protocol for determining protein dynamics using FT-IR spectroscopy. STAR Protocols, 4(4), 102587. https://doi.org/10.1016/j.xpro.2023.102587.
43. Munajad, A., Subroto, C., & Harjo, S. (2018). Fourier transform infrared (FTIR) spectroscopy analysis of transformer paper in mineral oil-paper composite insulation under accelerated thermal aging. Energies, 11(2), 364. https://doi.org/10.3390/en11020364.
44. Gong, Y., Chen, X., & Wu, W. (2024). Application of fourier transform infrared (FTIR) spectroscopy in sample preparation: Material characterization and mechanism investigation. Advances in Sample Preparation, 11, 100122. https://doi.org/10.1016/j.sampre.2024.100122
45. Rattanamaneerusmee, A., Thirapanmethee, K., Nakamura, Y., Bongcheewin, B., & Chomnawang, M. T. (2018). Chemopreventive and biological activities of Helicteres isora L. fruit extracts. Research in Pharmaceutical Sciences, 13(6), 484–492. https://doi.org/10.4103/1735-5362.245960
46. Venkatesh, S., Bolleddu, R., Shivani, Y., Alvala, R. K., & Zareen, N. (2024). Pharmacognostical, phytochemical, in vitro hypoglycemic studies of Avartani (Helicteres isora L.) root and fruit extracts. Journal of Ayurveda, 18(1), 5–13.
47. Kadam, P. V., Bhingare, C. L., Rathi, S. A., Soni, S. B., & Patil, M. J. (2013). Pharmacognostical evaluation of fruits of Helicteres isora Linn (Sterculiaceae). Journal of Biological & Scientific Opinion, 1(1).
48. Sharma, P., & Bithel, N. (2023). Phytochemical screening, antimicrobial potential, ADME predictions targeting the Helicteres isora L. fruit extracts and their essential oil. Research Journal of Pharmacy and Technology, 16(11). https://doi.org/10.52711/0974-360X.2023.00812.
49. Sharma, P., Kumar, V., Singh, S. P., Kumar, S., & Navneet. (2026). Unlocking the biological potentials of Helicteres isora plant: A comprehensive study of pharmacological and phytochemical perspectives. International Journal of Drug Delivery Technology, 16(24s), 730–736. https://doi.org/10.25258/ijddt.16.24s.91.
50. Latif, A., Farzana, M., Hossain, M. M., & Chowdhury, H. (2024). Study of antioxidant, cytotoxic and analgesic properties of the stem of Helicteres isora Linn. Mediterranean Journal of Basic and Applied Sciences, 8(2), 1–20.
51. 51.Suthar, M., Rathore, G. S., & Pareek, A. (2009). Antioxidant and antidiabetic activity of Helicteres isora (L.) fruits. Indian Journal of Pharmaceutical Sciences, 71(6), 695–699. https://doi.org/10.4103/0250-474X.59557.
52. Mahajan, R., & Itankar, P. (2020). Antioxidant, antimicrobial and wound healing potential of Helicteres isora Linn. leaf extracts. Digital Chinese Medicine, 3(3), 188–198. https://doi.org/10.1016/j.dcmed.2020.09.005.
53. Jeba, R. C., Pooja, S., & Priyanka, P. (2021). Antioxidant and antibacterial work of methanolic extract of Helicteres isora. Plant Cell Biotechnology and Molecular Biology, 22(39–40), 199–209.
54. Chandirasegaran, G., Elanchezhiyan, C., Ghosh, K., & Sethupathy, S. (2016). Determination of antidiabetic compounds from Helicteres isora fruits by oral glucose tolerance test. Journal of Applied Pharmaceutical Science, 6(2), 172–174. https://doi.org/10.7324/JAPS.2016.60227.
55. Dhole, S. M., Swami, A. B., Rathod, R. S., Kshirsagar, P. M., & Kendre, J. M. (2022). High-performance thin layer chromatography analysis and fingerprinting of phytoconstituents of Helicteres isora Linn and Psidium guajava Linn. Journal of Pharmaceutical Negative Results, 13(Special Issue 10), 2022.
56. Tiwari, V., Tiwari, A., & Madhavan, V. (2010). Preliminary phytochemical analysis, HPTLC studies and antipyretic activity of alcohol and aqueous extract of Helicteres isora L. root. International Journal of Pharmacy and Pharmaceutical Sciences, 2(2), 74–79.
57. Swami, S., Joshi, U., Gurav, R., Karambelkar, P., Thakur, A. L., & Jagtap, V. (2021). Pharmacognostical investigation and in-vitro cytotoxicity study of Helicteres isora fruit. International Journal of Pharmaceutical Research and Applications, 6(4), 98–102.
58. Cragg G.M., Newman D.J. Plants as a source of anti-cancer agents. J Ethnopharmacol. 2005;100(1–2):72–79.
59. Stuart B. Infrared Spectroscopy: Fundamentals and Applications. Chichester: John Wiley & Sons Ltd; 2004.