The Spatial Relationship Between the Educational Structure of the Population and the Pattern of Economic Activity in Saladin Governorate
- Adnan Attia Mohammed , Department of Geography and Geographic Information Systems, College of Arts
- Zainab Jamal Numan , Department of Geography and Geographic Information Systems, College of Arts
Article Information:
Abstract:
This research aims to analyze the spatial relationship between the educational structure of the workforce and the patterns of economic activity in Saladin Governorate, as it is considered one of the core themes in geographical and developmental studies. The significance of the study comes from the fact that education is one of the key determinants of human resource efficiency, and its role in guiding economic activities and achieving sustainable development. The study adopted a spatial analytical approach, relaying on official statistical data, based on the official statistical data, with the utilization of quantitative methods and geographical indicators to measure the spatial variation in the levels of education, and analyzing its connection with the economic activities, agricultural, industrial, and service. The results of the study showed an obvious spatial variation in the educational structure between the administrative units, where the low educational levels prevail in rural areas, in contrast to higher rates of intermediate and high education in urban centers. As shown that the agricultural activity depends significantly on low educated labor, which mirrors its traditional nature, while the industrial activity depends on the intermediate education due to its link to technical skills, while the service activity connects with the intermediate and high educational levels given to its knowledge-based nature. Also, the study discovered a direct correlation between the high educational level and the improvement of economic development indicators, such as the increased job opportunities and the rise in income levels. Also, the variation indicators showed that the low educational level is wide for spatial distribution and relative stability, while the high education characterized by greater spatial variation due to its concentration.
Keywords:
Article :
INTRODUCTION :
Educational system of work force can be considered a very important measure regarding efficiency of human resources since it plays an integral role in shaping the economic activities by defining their nature and future evolution trend. It is evident that there exists some intrinsic interrelation between economic activity and its corresponding level of academic qualifications. Namely, conventional branches are known to employ low-educated personnel, whereas the development of more advanced industries presupposes the presence of qualified specialists who have intermediate and higher education (Abu Ayana, 2009, 96). However, one cannot speak about the even distribution of educational level and economic activities among all administrative units since there is considerable difference depending on such factors as the extent of urbanization, proximity to educational institutions, etc. Taking everything into account, the current study attempts to reveal spatial relations between the educational level and economic activities in Saladin governorate. The main purpose here is to discover the dominant patterns of variation and their implications for the future of this territory in general.
Research Problem:
The main research problem of the study under consideration can be stated in the following question: "What is the character of the spatial disparity in educational structure among the population of Saladin Governorate and to what extent does it affect the process of achieving economic development?" In order to clarify the key point, it would be necessary to raise some questions concerning the matter:
-What are the patterns behind the spatial distribution of different educational levels among the population of Saladin Governorate?
-Is the educational structure of the population associated with the development of economic activity in various regions?
-Are there any regions which face significant educational problems preventing them from reaching development rates typical for their area?
-How can education help to narrow the gaps in development among various regions of the governorate?
Research Hypotheses
The hypotheses formulated according to the problem raised above are listed below:
There are distinctive characteristics in the level of education among various administrative units as education is determined by many variables rather than is homogenous.
High educational level is highly correlated with economic development, since economically developed regions tend to have more favorable educational structure.
Rural areas, especially those located at a considerable distance from big cities, demonstrate decreasing educational level compared to that of urban areas.
Low educational structure intensifies the developmental gap between centers and adjacent rural regions.
Significance of the Study
The significance of this study is mainly due to the fact that the study topic belongs to one of the most important topics which is the essential link between human capital and economic development within a defined geographical location. Education system of the population can be seen as a main indicator for socio-economic development ability. Moreover, this study acts as a diagnosis tool for detecting imbalances in development and finding the reasons behind those imbalances. Using the current modern spatial database with an analytical study of the indicators will enable policymakers to use such information as a guide for developing educational and developmental strategies. Thus, there is a clear demand for scientific studies that depend on scientific spatial study of human elements especially education to have a better perception about our developmental status.
Research Objectives
Through this research, we aim to accomplish the following:
Visualization of spatial distribution of the education structure of Saladin Governorate's population.
Detecting the relationship between the population's education level and the economic development indicators.
Explaining the influence of differences in the education level on economic activities and job opportunities distribution.
Identification of differences in the education level between the urban and rural areas and its effects on economic development.
Monitoring areas suffering from educational deficiency and linking them to their actual situation through scientific analysis.
Analyzing the spatial distribution of education distribution using statistics and geography integration techniques.
Study Area: Location and Scope
Geographical Boundaries:
Saladin Governorate is located in the central part of Iraq. Being geographically located on the Mesopotamian Plain. The governorate is surrounded to the north by Nineveh Governorate, and in the northeast by Kirkuk Governorate. While the eastern borders coincide with Diyala Governorate. Saladin Governorate borders Baghdad Governorate to the south and Anbar Governorate to the southwest. It has also borders with both Nineveh and Anbar Governorates to the west. See Map (1).
Saladin Governorate spreads over an area of 24,363 km2, making it the fourth largest among all Iraqi governorates in size (Central Statistical Organization, 2023, 22). Administrative division: the Governorate includes 11 districts, (Al-Shirqat, Baiji, Tikrit, Al-Alam, Samarra, Balad, Ad-Dawr, Ad-Dujail, Ad-Dhuluiya, Tuz Khurmatu, and Amirli), and six sub-districts, (Al-Siniyah, Dijla, Al-Mu'tasim, Al-Ishaqi, Sulaiman Bek, and Yathrib).
Time Boundaries:
The time span of this study ranges from 1997 to 2024 years.
Map (1): The Geographical Location of the Study A
Source: Prepared by the researcher based on:
The Administrative Map of Iraq, scale 1:1,000,000.
The Saladin Governorate Map, scale 1:250,000.
Designed using ArcGIS 10.8 software.
I. Relation between the Level of Education and Agricultural Labor Force
Agricultural sector represents one of the most essential activities that have great significance economically for the province of Saladin. It depends significantly on labor force because this activity needs great number of human resources. Besides its importance in quantitative terms, it has qualitative importance through education level which has a significant impact in measuring the production efficiency and adaptation with modern techniques. In simple terms, as the education level increases, then there will be an increase in the capabilities of using advanced technology along with fertilizers and modern irrigation system as well as improved farm management practices (Hussein, 2014, 112).
There are differences among districts in terms of the level of education of agricultural labor force which arise due to some differences among these units in demographic and socioeconomic aspects. These
differences also exist as a result of rurality as well as availability or unavailability of educational services. Accordingly, there is a need to investigate the relationship between the level of education of agricultural labor force in order to reveal such relations.
Data collection in order to analyze this relationship was conducted based on collecting information related to the number of agricultural workers according to their levels of education in Saladin's administrative units. This was done as indicated in Table (1). However, since absolute numbers do not provide full clarity, these numbers were transformed into percentages taking into consideration the difference in the size of agricultural labor force in these units.
Accordingly, there was a classification of education levels of the agricultural labor force in Saladin. This classification consisted of three categories; low education (including illiterates, below primary and primary), intermediate education (including middle school, high school, and technical education), and higher education (university and postgraduate studies). Such categorization is intended to facilitate interpretation of data and reveal spatial pattern of the educational structure of the labor force (UNESCO Institute, 2012, 26). This approach is also adopted in all other sectors such as industries and services sectors.
Table (1): Number of Workers in Agricultural Activity by Educational Level in Saladin Governorate for the Year 2024
|
Adminstrative unit |
Agricultural workforce |
Illiterate & below primary |
Primary |
Middle School |
High school& Vocational |
Bachelor’s & Diploma |
Postgraduate degrees |
|
Tikrit District |
8321 |
1747 |
1664 |
1947 |
1240 |
1556 |
167 |
|
AL-Alam District |
9382 |
2862 |
2045 |
1576 |
1210 |
1370 |
319 |
|
Tuz District |
9087 |
2535 |
2017 |
1318 |
1508 |
1563 |
146 |
|
Amiril District |
6117 |
1523 |
1523 |
1028 |
1083 |
942 |
18 |
|
Samaraa District |
21674 |
6329 |
5440 |
3186 |
2058 |
4238 |
423 |
|
Balad District |
15043 |
5325 |
3189 |
1880 |
1775 |
2738 |
136 |
|
Ad-Dhuluiya District |
7974 |
1946 |
1778 |
1124 |
1037 |
1938 |
151 |
|
As-Dujail District |
12341 |
4208 |
2209 |
1234 |
2036 |
2530 |
124 |
|
Baiji District |
11789 |
3820 |
2452 |
2346 |
1356 |
1698 |
117 |
|
Ad-Dawr District |
8156 |
2520 |
1811 |
1126 |
1011 |
1631 |
57 |
|
Al-Shirqat District |
22141 |
6930 |
5425 |
3130 |
2030 |
4916 |
310 |
|
Total |
132025 |
39745 |
29553 |
19895 |
19344 |
24520 |
1968 |
Source: Ministry of Planning, Central Statistical Organization (CSO), Workforce in Saladin Governorate by Activity, 2024, Unpublished Data.
Percentages of Educational Structure
Based on previous data, Table has been constructed to show the percentages of the educational structure of the agricultural workforce in the administrative units of the governorate of Saladin. Such a table forms the basis for analysis of the educational structure of the agricultural labor force and its impact on the nature of agricultural activity in the governorate.
The percentages of the educational structure of agricultural workers are presented in Table (2). Agricultural workers were divided into three groups based on educational status, which included low, intermediate, and high education. The data presented in the table shows that the average for low education was equal to (51.3%) of the agricultural workforce, while the. average for intermediate education constituted (29.8%), and the average for high education amounted to (19.9%). Therefore, it is clear that the majority of the agricultural workforce had low educational qualifications, which reflects the nature of the rural agricultural activity carried out in the province. That is, most of these workers have inherited practical knowledge about agriculture from generations of family members working in the field of agriculture and are used mainly to physical labor because of the dominance of such practices in the agricultural sector
As shown in the above table, Balad district has the highest percentage of low education, which amounts to (56.6%) of the agricultural workforce in the district. Other districts, including Al-Shirqat, Samarra, Baiji, Ad-Dawr, Al-Alam, and Ad-Dujail have a relatively high percentage of low education, amounting to (55.8%), (54.3%), (53.2%), (53.1%), (52.3%), and (52.0%), respectively. This is due to the presence of large agricultural lands in the aforementioned districts and their rural nature. Moreover, a significant portion of the population of these districts works in the field of agriculture, making people work in this sector early in their life and not complete their higher education. Consequently, many social and economic problems exist in such rural societies, preventing their people from obtaining a higher education.
However, it can be noticed that Tikrit has the lowest percentage of low education, which constitutes (41.0%). Other districts, including Ad-Dhuluiya, Amirli, and Tuz Khurmatu have relatively low percentages of low education equal to (46.7%), (49.8%), and (50.1%), respectively. This relative decline in these percentages can be attributed to the proximity of these districts to urban centers and the superior availability of educational services. This is especially true for the governorate’s capital, Tikrit, which benefits from a concentration of diverse educational institutions. Such an environment naturally boosts the educational attainment levels of the population across various economic sectors, including agriculture.
Table (2): Relative Distribution of Educational Levels for the Agricultural Workforce in Saladin Governorate, 2024
|
Adminstrative Unit |
Low Education% |
Intermediate Education |
High Education |
|
Tikrit District |
41 |
38.3 |
20.7 |
|
Al-Alam District |
52.3 |
29.7 |
18 |
|
Tuz District |
50.1 |
31.1 |
18.8 |
|
Amiril District |
49.8 |
34.5 |
15.7 |
|
Samarra District |
54.3 |
24.2 |
21.5 |
|
Balad District |
56.6 |
24.3 |
19.1 |
|
Ad-Duluiya District |
46.7 |
27.1 |
26.2 |
|
Ad-Dujail District |
52 |
26.5 |
21.6 |
|
Baiji District |
53.2 |
31.4 |
15.4 |
|
Ad-Dawr District |
53.1 |
26.2 |
20.7 |
|
Al-Shirqat District |
55.8 |
23.3 |
20.9 |
|
Average |
51.3 |
28.8 |
19.9 |
Source: Ministry of Planning, Central Statistical Organization (CSO), Workforce in Saladin Governorate by Activity, 2024, Unpublished Data.
Analysis of Intermediate and High Education Categories
With respect to the Intermediate Education category, the general average amounted to 28.8%. The most prevalent percentages were registered in Tikrit District (38.3%), Amirli (34.5%), Baiji (31.4%), Tuz Khurmatu (31.1%), and Al-Alam (29.7%). Such high percentages indicate the existence of an agricultural working class with medium educational background and the ability to apply contemporary agricultural techniques and manage agricultural technologies. On the contrary, the smallest percentages of intermediate education can be seen in Al-Shirqat (23.3%), Samarra (24.2%), and Balad (24.3%) because of the presence of a larger number of low education workers, thus decreasing the importance of the intermediate class.
As regards the High Education category, the general average is 19.9%, which is much smaller than the others. This demonstrates that the involvement of educated people in agriculture is minimal compared with their participation in other sectors of the economy. The maximum prevalence of high education workers was observed in Ad-Dhuluiya (26.2%), Ad-Dujail (21.6%), Samarra (21.5%), Al-Shirqat (20.9%), and Tikrit/Ad-Dawr (20.7%) as these districts are located near urban centers where there is more consciousness about education; moreover, university graduates could be engaged in agricultural activities like marketing or administration.
The minimum number of high education workers belongs to Baiji (15.4%), Amirli (15.7%), and Al-Alam (18.0%) since agriculture in these districts is traditionally performed in a countryside and university graduates prefer to work not only outside agriculture but also in the governmental sector.
Summarizing the above, it can be noted that the educational structure of Saladin agricultural workers is represented by the predominance of less-educated workers whereas highly-educated employees have little involvement in this type of occupation. Such data can be explained by the character of agriculture that involves mainly physical labor based on the experience passed from generation to generation. Still, it should be noted that there is considerable spatial variation associated with differences in rurality, educational facilities, and distance from urban centers.
Coefficient of Variation (CV) in Relation to the Educational Structure of the Agricultural Labor Force
The Coefficient of Variation (CV) is an important statistic used in geography as a measure of the degree of variation or disparity between phenomena at various locations. It provides an illustration of the degree to which the phenomenon’s values are spread out from its arithmetic average. This measure is very important in analyzing demographic or economic features since it enables researchers to determine the spatial disparity of the variables under study.
Here, the Coefficient of Variation is being used to measure the disparity in the educational structure of the agricultural labor force in the administration districts of Saladin Province. Whether education levels in the district are uniform or not may be determined by calculating the CV using the formula below:
Where:
CV: Coefficient of Variation.
\sigma: Standard Deviation.
\bar{x}: Arithmetic Mean.
Based on the data from Table (1), the results are presented in Table (3) below.
Table (3): Coefficient of Variation Values for Educational Levels in Saladin Governorate, 2024
|
Educational Level |
Average |
Standard Deviation |
Ceofficient of Variation |
|
Low Education |
51.3 |
4.6 |
9 |
|
Intermediate Education |
28.8 |
4.5 |
15.6 |
|
High Education |
19.9 |
3.1 |
15.5 |
Source: Calculated using Coefficient of Variation Formula.
Results from the Coefficient of Variation (CV) calculations presented in Table (3) reveal the degree of spatial variation of education levels among agricultural workforces in the Saladin Governorate. Low Education obtained a CV of (9.0%) and hence a relatively low degree of spatial variation in relation to the distribution of the educational level among administrative units. It shows that this type of education is evenly distributed among many districts due to the nature of agriculture activity as it is traditionally carried out by people with a low level of education.
On the other hand, Intermediate Education showed a CV of (15.6%), suggesting a relatively higher spatial variation in comparison to the low education. The degree of spatial variation indicates the differences in the provision of educational services and disparities in the populations' capability of completing different levels of education.
High Education revealed a CV of (15.5%). In this case, there are significant disparities in the distribution of the educated workforce in the governorate districts. This is attributed to the location of some administrative units near urban areas and provision of high-level education in these units as compared to other far rural areas.
Therefore, the findings show that low education represents the most spatially stable education type among agricultural workers while intermediate and high education have a relatively high spatial variation among administrative units.
2. Education Index for Agricultural Activity
Education index for agricultural activity refers to an analytical tool used to gauge the level of educational development of the agricultural workforces. It uses relative weighting of different levels of education to get a numerical value indicative of the level of educational development within the agriculture sector. Such an education index is helpful in comparing different spatial units as regards the degree of educational development among agricultural labor forces. The index aids in explaining the differences in agricultural productivity and development (Hayami, 1985, 78).
To measure the level of education of the agricultural workforce quantitatively, an Agriculture Education Index was derived using the relative weightings principle. This index uses ascending weights assigned to the levels of education. The following were the assigned values: 1 for Low Education, 2 for Intermediate Education, and 3 for High Education. The procedure for calculating the index is based on research that highlights education as an essential element of human capital that influences the efficiency of agricultural production, using the exact approach employed in developing education indexes in Human Development Reports (UNDP). The equation is presented below (Huffman, 2000, 5). The outcomes are illustrated in Table (4).
Where:
EI: Agricultural Education Index.
Low: Percentage of Low Education.
Mid: Percentage of Intermediate Education.
High: Percentage of High Education.
Table (4): Results of the Agricultural Education Index in Saladin Governorate, 2024
|
Administrative Unit |
Low Education |
Intermediate Education |
High Education |
Agricultural Education Index |
|
Tikrit District |
41 |
38.3 |
20.7 |
1.8 |
|
Al-Alam District |
52.3 |
29.7 |
18 |
1.66 |
|
Tuz District |
20.1 |
31.1 |
18.8 |
1.69 |
|
Amirli District |
49.8 |
34.5 |
15.7 |
1.66 |
|
Samarra Distric |
54.3 |
24.2 |
21.5 |
1.67 |
|
Balad District |
56.6 |
24.3 |
19.1 |
1.63 |
|
Ad-Dhuluiya District |
46.7 |
27.1 |
26.2 |
1.79 |
|
Ad-Dujail District |
52 |
26.5 |
21.6 |
1.7 |
|
Baiji District |
53.2 |
31.4 |
15.4 |
1.62 |
|
Ad-Dawr District |
53.1 |
26.2 |
20.7 |
1.68 |
|
Al-Shirqat District |
55.8 |
23.3 |
20.9 |
1.65 |
|
Average |
51.4 |
28.8 |
19.9 |
1.7 |
Source: Based on the application of the weighted agricultural education formula.
It can be noticed from classifying the Agricultural Education Index into three equal levels (as shown in Table (4) and Map (2)) that there is significant variation in educational levels for the agricultural work force in Saladin Governorate. Most districts fall within the Low Level which include seven districts; Baiji, Balad, Al-Shirqat, Al-Alam, Amirli, Samarra, and Ad-Dawr, where the values of the indices of these districts lie between (1.62 – 1.68). This level shows less educational development of the agricultural work force due to having very high rates of low education that exceeds 50% in most cases. That proves that agriculture in these areas still uses old methods based on inheritance of practical experiences and not academic qualifications.
Only two districts are included in the Intermediate Level and have index values of (1.69) for Tuz Khurmatu and (1.74) for Ad-Dujail. This means that this level is characterized by relative balance among educational categories with some increase in the percentage of intermediate education which leads to the existence of transitional characteristics of the agricultural work force from its old methods to being organized, and equipped with limited educational capabilities to improve agricultural activity.
On the other hand, districts of Tikrit and Ad-Dhuluiya represent the High Level in the index map with values of (1.80) and (1.75) respectively. In addition, there is an increase in percentages of intermediate and high education with relative decline in low education in comparison with other districts. This is attributed to the nearness of these administrative divisions to cities in addition to their better provision of educational facilities and services along with high educational awareness among citizens. Thus, these districts include more qualified agricultural workers to adopt advanced technology and develop agricultural activities.
In general, it can be noticed that the educational level of the agricultural work force in Saladin Governorate is relatively low, but there exist limited variations represented by emergence of certain districts with relatively high educational levels. This is influenced by spatial factors especially degrees of rurality and distances from cities.
Map (4): Levels of the Agricultural Education Index in Saladin Governorate, 2024
Source: Prepared by the researcher based on Table (4), using ArcGIS 10.8.
II. The Relationship Between Educational Levels and the Industrial Workforce
The industry is considered one of the most important economic sectors in Saladin Governorate. It depends highly on the effectiveness and education of the workforce since the industry is directly related to technology and requires organization and technical expertise. However, the effect of the industry workforce is not only concerned with its volume but includes its qualitative aspects as well. First and foremost, the educational structure of the industrial workforce can be regarded as an effective tool to assess the productivity and development stage of the industry. As the education level of the workforce increases, the possibility of handling equipment, utilizing technology, and improving the quality of production and managing it becomes higher (Todaro & Smith, 2015, 389).
Educational levels of industrial workforce differ geographically depending on the extent of urbanization of areas, industrial establishment, and the availability of educational institutions. Accordingly, studying the relation between educational structure and the industry workforce could help us identify the characteristics and development stage of this sector and find the disparities in the efficiency of the workforce. To conduct this study accurately, we need to gather data on the numbers of industrial workers according
to their educational status in the administrative divisions of Saladin Governorate as illustrated in Table (5).
Table (5): Numbers of Industrial Workers According to Their Educational Status in Saladin Governorate, 2024
|
Administrative Unit |
Industrial Workforce |
Illiterate & Below Primary |
Primary |
Intermediate |
Preparatory & Vocational |
Bachelor's & Diploma |
Postgraduate Degrees |
|
Tikrit District |
5651 |
503 |
1028 |
1322 |
1384 |
1226 |
188 |
|
Al-Alam District |
1375 |
221 |
356 |
320 |
342 |
122 |
14 |
|
Tuz District |
4723 |
912 |
798 |
954 |
1006 |
940 |
113 |
|
Amirli District |
1342 |
195 |
225 |
285 |
331 |
298 |
8 |
|
Samarra District |
9925 |
1360 |
1796 |
2035 |
2144 |
2074 |
516 |
|
Balad District |
4117 |
667 |
786 |
996 |
963 |
646 |
59 |
|
Ad-Dhuluiya District |
1725 |
278 |
286 |
298 |
443 |
388 |
32 |
|
Ad-Dujail District |
2392 |
335 |
433 |
512 |
653 |
433 |
26 |
|
Baiji District |
14541 |
1556 |
2545 |
2952 |
4028 |
2850 |
610 |
|
Ad-Dawr District |
2242 |
312 |
424 |
442 |
507 |
462 |
95 |
|
Al-Shirqat District |
6574 |
1124 |
1124 |
1729 |
1413 |
1012 |
172 |
|
Total |
54607 |
7463 |
9801 |
11845 |
13214 |
10451 |
1833 |
Source: Ministry of Planning, Central Statistical Organization (CSO), Workforce in Saladin Governorate by Activity, 2024, Unpublished Data.
Table (6): Educational Percentages of the Industrial Workforce by District in Saladin Governorate, 2024
|
Administrative Unit |
Low education % |
Intermediate education% |
High education% |
|
Tikrit District |
27.1 |
47.9 |
25 |
|
Al-Alam District |
41.2 |
48.1 |
9.9 |
|
Tuz District |
36.2 |
41.5 |
22.3 |
|
Amrili District |
31.3 |
45.9 |
22.8 |
|
Samarra District |
31.8 |
42.1 |
26.1 |
|
Balad District |
35.3 |
47.6 |
17.1 |
|
Al-Duluiya District |
32.7 |
42.4 |
24.4 |
|
Al-Dujail District |
32.1 |
48.3 |
19.2 |
|
Baiji District |
28.2 |
48 |
23.8 |
|
al-Dur district |
32.8 |
42.4 |
24.8 |
|
Al-Sharqat District |
34.2 |
47.8 |
18 |
|
Average |
33.1 |
45.8 |
21.2 |
Source: Computed from Table (5).
Table (6) shows the percentage distribution of education among workers in the industry of Saladin Governorate administrative regions as classified into low, medium, and high education. According to this table, the average value of Medium Education was found to be (45.6%) which represents the highest percentage among all other categories. On the other hand, the percentage of Low Education and High Education was (33.1%) and (21.2%) respectively. This proves that industries mostly depend on a medium educated labor force.
This is due to the nature of the industries involved since industrial work requires skills that suit intermediate levels of education and not illiterate labor or specialized education.
In terms of the district level, the highest percentage of people with low education is observed in Al-Alam at (41.2%), then Tuz Khurmatu (36.2%), and Balad (35.3%). On the other hand, the least percentage is seen in Tikrit (27.1%) and Baiji (28.2%). The higher percentage in some districts is due to the involvement of basic industries that do not need advanced education and limited educational institutions in such districts or semi-rural nature. Meanwhile, the reduction in the percentage in Tikrit and Baiji is due to the involvement of organized industrial sectors that need a skilled workforce.
Concerning Intermediate Education, the highest percentages were observed in Ad-Dujail, reaching (48.3%), followed by Al-Alam (48.1%), Baiji (48.0%), Al-Shirqat (47.8%), and Balad (47.6%). While the lowest percentage was obtained in Tuz Khurmatu at (41.5%). The increase in the percentages indicates the predominance of this type of education above all other categories. This is due to the fact that this educational type is related to industrial operations and activities. That's because it represents the technical workforce which plays a fundamental role in carrying out industrial activities.
As far as High Education is concerned, the average percentage was obtained to be equal to (21.2%). However, the highest percentage belongs to Samarra at (26.1%), followed by Tikrit (25.0%), Ad-Dawr (24.8%), and Ad-Dhuluiya (24.4%). While the lowest percentages of High Education occurred in Al-Alam (9.9%), followed by Balad (17.1%) and Al-Shirqat (18.0%). The emergence of higher education in particular regions is linked to the degree of urbanization of the district and the nature of its industrial activities.
Thus, it can be concluded that the educational structure of the industrial workforce in the governorate of Saladin is distinguished by the predominance of intermediate education. This can be attributed to the nature of industrial activity which requires technical and organizational skills.
1. Coefficient of Variation (CV) for the Educational Structure of the Industrial Workforce
It can be seen from Table (7) that the degree of spatial variation in educational levels varies according to each category. The lowest CV was obtained for Intermediate Education and amounts to (5.7%). Thus, the degree of spatial disparity in this category is relatively low since the differences among administrative units are not great. In fact, industrial activity depends mainly on intermediate education as it is considered the most appropriate type for industrial activities.
While Low Education recorded the second-lowest CV amounting to (12.3%). The degree of variation is considered to be moderate in this category. The reason for that lies in the diversity of the nature of industrial activities in different districts; this category increases in districts where industrial activities depend mainly on simple industries.
Table (7): Coefficient of Variation Values for Educational Levels in the Industrial Activity, Saladin Governorate, 2024
|
Education level |
intermediate |
Standard deviation |
Coefficient of variation |
|
Low education |
34 |
4.2 |
12.3 |
|
Intermediate education |
45 |
2.6 |
5.7 |
|
High education |
21 |
4.5 |
21.4 |
Source: Base On the other hand, High Education obtained the largest Coefficient of Variation at (21.4%). This highlights the spatial inequality in the distribution of the workforce possessing high education. This phenomenon is due to the existence of higher levels of advanced industrial activities in some selected administrative units particularly those districts surrounding urban centers compared with decreasing levels in districts featuring low or traditional industrial sectors.
Accordingly, the above results imply that Intermediate Education is the most stable and widespread type among the industrial activities. However, High Education is associated with the largest extent of variability representing the difference in the degree of industrial development between the various administrative units of Saladin Governorate.
2. Education Index for Industrial Workforce
Through applying the identical formula of weightings for measuring the Industrial Education Index, Table (8) and Map (3) below show the following results depending on the Industrial Workforce in Saladin Governorate:
Low Level: This level was represented by Al-Alam District with an index equal to (1.69). The above index reflects a lower level of educational qualification among the workforce engaged in industrial activities because of the predominance of low education (41.2%) compared with a marked decrease in high education which amounted to (9.9%). Consequently, these results indicate the presence of simple or artistic types of industries in such a district that do not need advanced education.
Intermediate Level: This level included four districts: Balad (1.82), Al-Shirqat (1.84), Tuz Khurmatu (1.86), and Ad-Dujail (1.87). The current index indicates the balance of education types especially the domination of intermediate education ranging from (41.5% - 48.3%). d on the application of the Coefficient of Variation formula.
Table (8): Results of the Industrial Education Index in Saladin Governorate, 2024
|
Administrative unit |
Low education% |
Intermediate education% |
High education% |
Industrial education index |
|
Tikrit district |
27.1 |
47.9 |
25 |
1.98 |
|
Al-Alam district |
41.2 |
48.1 |
9.9 |
1.69 |
|
Tuz district |
36.2 |
41.5 |
22.3 |
1.86 |
|
Amirli district |
31.3 |
45.9 |
22.8 |
1.92 |
|
Samarra district |
31.8 |
42.1 |
26.1 |
1.94 |
|
Balad district |
35.3 |
47.6 |
17.1 |
1.82 |
|
Al-Duluyia district |
32.7 |
42.4 |
24.4 |
1.92 |
|
Al-dujail district |
32.1 |
48.3 |
19.2 |
1.87 |
|
Baiji district |
28.2 |
48 |
23.8 |
1.95 |
|
Al-dur district |
32.8 |
42.4 |
24.8 |
1.92 |
|
Al-Shiqat district |
34.2 |
47.8 |
18 |
1.84 |
|
Average |
33.1 |
45.6 |
21.2 |
1.9 |
Source: Based on the application of the weighted industrial education formula.
High Level is characterized in the six districts; Tikrit (1.98), Baiji (1.95), Samarra (1.94), Amirli (1.92), Ad-Dhuluiya (1.92), and Ad-Dawr (1.92). This is attributed to the existence of advanced industrial activities or because of proximity to the urban centers as a means to attract scientifically qualified workers leading to increasing industrial organization and production. Therefore, it could be concluded that industrial activity in the Saladin governorate is generally inclined towards high and medium educational levels where the high educational level was found only in districts having urban-industrial characteristics, whereas the low educational level was found in a very small number of districts.
III. The Relationship Between Educational Levels and the Service Sector Workforce
As an economic activity, the service sector plays a critical role in the economic development of Saladin governorate. Its components include education, health, administrative, commercial, and transport services, each having distinct characteristics. However, it is clear from its nature that it highly depends on scientifically qualified human capital as it needs higher cognitive, administrative, and technical abilities than those required by the agricultural and industrial economic activities.
Educational composition in the Saladin governorate varies based on differences in urbanization levels, distribution of service and educational institutions, among others. Labor with high educational level was found mostly in urban centers whereas in rural areas the labor had lower educational levels, as per Table (9). The analysis of educational level was based on the classification of low, medium, and high percentages. The results were shown in Table (10).
The results show that the general average for Intermediate Education was (42.4%), the highest among all three categories, followed by High Education with (33.2%) and Low Education with (24.4%). This is because of its specialized nature where it has a significant dependency on both high and medium educational levels in comparison with other economic activities.
Map (3): Levels of the Industrial Education Index in Saladin Governorate, 2023
Source: Prepared by the researcher based on Table (8), using ArcGIS 10.8.
Table (9): Number of Service Sector Workers by Educational Level in Saladin Governorate, 2024
|
Administrative unit |
Service workers |
Illiterate & below primary |
Primary |
intermediate |
Secondary and vocational |
Bachelor’s and diploma |
Postgraduate degrees |
|
Tikrit district |
59438 |
4814 |
7846 |
11769 |
13492 |
18664 |
2853 |
|
Al-alam district |
7524 |
897 |
988 |
1214 |
1923 |
2097 |
423 |
|
Tuz district |
24425 |
2443 |
3810 |
4543 |
5251 |
7645 |
733 |
|
Amirli district |
6635 |
564 |
903 |
1287 |
1645 |
2044 |
192 |
|
Samarra district |
62324 |
7042 |
9473 |
10720 |
13587 |
19383 |
2119 |
|
Balad district |
35932 |
4524 |
4171 |
6073 |
10420 |
9989 |
755 |
|
Al-dukuiya district |
8572 |
763 |
1200 |
1989 |
1989 |
2212 |
419 |
|
Baiji district |
20787 |
1996 |
2952 |
5238 |
4802 |
5592 |
207 |
|
Al-dujail district |
46927 |
4317 |
7649 |
8775 |
9338 |
15017 |
1831 |
|
Al- dur district |
13541 |
963 |
1993 |
2577 |
3119 |
4719 |
190 |
|
Al-Shirqat district |
49795 |
5876 |
6872 |
9660 |
11652 |
13295 |
2440 |
|
total |
335938 |
34199 |
47857 |
63845 |
77218 |
100657 |
12162 |
|
|
|
|
|
|
|
|
|
Source: Ministry of Planning, Central Statistical Organization (CSO), Workforce in Saladin Governorate by Activity, 2024, Unpublished Data.
Table (10): Educational Percentages of the Service Sector Workforce by District in Saladin Governorate, 2024
|
Administrative unit |
Low education% |
Intermediate education% |
High education% |
|
Tikrit district |
21.3 |
42.5 |
36.2 |
|
Al-alam district |
25 |
41.6 |
31.8 |
|
Tuz district |
25.6 |
40.1 |
34.3 |
|
Amirli district |
22.1 |
44.2 |
33.7 |
|
Samarra district |
26.5 |
39 |
34.5 |
|
Balad district |
24.2 |
45.9 |
29.9 |
|
Al-duluyia district |
22.9 |
46.4 |
30.7 |
|
Al-dujail district |
23.8 |
48.3 |
28.8 |
|
Baiji district |
25.5 |
38.6 |
35.8 |
|
Al-Dur district |
21.7 |
42 |
36.2 |
|
Al-Shirqat district |
25.6 |
42.8 |
31.6 |
|
Average |
24.4 |
42.4 |
33.2 |
Reference: Refer to Table (9)
In the case of the administrative unit, the maximum percentage of the category of Low Education was found in Samarra District, which reached (26.5%). Other regions that witnessed a high percentage of this category were Tuz Khurmatu and Al-Shirqat, both (25.6%), then Baiji District (25.5%). Meanwhile, the minimum percentage of Low Education was observed in Tikrit (21.3%), Ad-Dawr (21.7%), and Amirli (22.1%). It should be noted that this category increased due to the presence of basic services and service sector jobs that do not need a high level of education. In addition, there were differences in educational awareness among different administrative units.
In relation to Intermediate Education, the maximum percentage was recorded in Ad-Dujail (48.3%), followed by Ad-Dhuluiya (46.4%) and Balad (45.9%). Meanwhile, the minimum percentage was observed in Baiji (38.6%) and Samarra District (39.0%). Elevation of this category resulted from its dominance in the service sector, as most service activities are done through mid-level educated employees, including administrative and technical employees.
With regards to High Education, the maximum percentages were observed in Tikrit and Ad-Dawr (each one 36.2%), Baiji (35.8%), and Samarra District (34.5%). However, the minimum percentage was recorded in Ad-Dujail (28.8%), followed by Balad (29.9%). An increase in the percentage of this category is attributed to being urban centers that have developed educational and service facilities. Such centers include government institutions and the health and education sectors that require highly qualified personnel.
Therefore, it can be concluded that the service sector workforce of Saladin Governorate has experienced an increasing level of educational attainment, particularly the intermediate and high categories, with a lower share of the low category than other economic activities. The high level of education indicates that the service sector is a knowledge industry that depends on scientific expertise, apart from spatial differences related to urbanization and service sector facilities.
1. Coefficient of Variation (CV) for the Educational Structure of the Service Sector Workforce
The coefficient of variation, as indicated in Table (11), shows that the spatial variability in the levels of education of service sector workers in Saladin Governorate is relatively small in terms of educational categories. Values for CV ranged between (6.6%-7.5%), revealing a hig Intermediate Education showed the smallest CV value of (6.6%), which shows spatial stability and almost equal distribution in different districts, due to the fact that the service sector is mainly dependent on an intermediate-educated workforce. The Low Education category showed the next smallest CV value of (7.4%). This value indicates a small variation and a small dependency of this category, compared with other economic sectors. High Education showed the largest CV value of (7.5%) but it still remained in the low variation category. This shows that the distribution of this category was relatively equal in different districts.
This category is mainly related to the development of modern services such as education, health, and administration. These services need educated workers and their distribution is relatively equal in all districts.
CONCLUSION :
From the above discussion, it can be concluded that the spatial distribution of education categories in the service sector in Saladin Governorate is highly homogeneous, in comparison with the agricultural and industrial sectors. This is mainly due to the existence of service institutions in various districts.
Table (11): Coefficient of Variation Values for Educational Levels in the Service Sector, Saladin Governorate, 2024 level of homogeneity in the distribution of educational levels.
|
Education level |
Average |
Standard deviation |
Coefficient of variation |
|
Low education |
24.4 |
1.8 |
7.4 |
|
Intermediate education |
42.4 |
2.8 |
6.6 |
|
High education |
33.2 |
2.5 |
7.5 |
Source: Based on the application of the Coefficient of Variation formula.
2.
Education Index for the Service Sector Workforce
Using the same weighting method described in the calculation of the Agricultural Education Index, the Service Education Index was calculated using the idea of assigning weights for each education category. The outcomes of the Service Education Index were distributed equally among three categories and are presented in Table (12) and Map (4). The Service Education Index showed that there is a convergence in the education categories of the service workforce in Saladin Governorate's administrative units with low spatial variation.
Low Level: This category was confined to six districts including Ad-Dujail, Al-Alam, Balad, Al-Shirqat, Samarra, and Ad-Dhuluiya, which had education index values within the range (2.05 – 2.08). This category implies that there is a relative decrease in high education when compared with other districts, which are characterized by education percentages of (28.8% – 31.8%) as opposed to an increase in intermediate education. It also implies a dependence on service workers who are well-educated at an intermediate level without the presence of highly educated scientific knowledge.
Intermediate Level: This category was confined to two districts including Tuz Khurmatu and Baiji with education index values of (2.09) and (2.10), respectively. This level implies that there is a relatively balanced distribution among the three education categories with an increase in high education up to (34.3% – 35.8%). This level signifies a good education level among the service workforce due to an improvement in the services offered in the region.
High Level: This category was confined to three districts including Amirli, Tikrit, and Ad-Dawr with education index values within the range (2.12 – 2.15).
Table (12): Results of the Service Education Index in Saladin Governorate, 2024
|
Administrative unit |
Low education% |
Intermediate education% |
High education% |
Service education index |
|
Tikrit district |
21.3 |
42.5 |
36.2 |
2.15 |
|
Al-Alam District |
25 |
41.6 |
31.8 |
2.06 |
|
Tuz District |
25.6 |
40.1 |
34.3 |
2.09 |
|
Amrili District |
22.1 |
44.2 |
33.7 |
2.12 |
|
Samarra District |
26.5 |
39 |
34.5 |
2.08 |
|
Balad district |
24.2 |
45.9 |
29.9 |
2.06 |
|
Al-duluyia district |
22.9 |
46.4 |
30.7 |
2.08 |
|
Al-Dujail |
23.8 |
48.3 |
28.8 |
2.05 |
|
Baiji district |
25.5 |
38.6 |
35.8 |
2.1 |
|
Al-Dur district |
21.7 |
42 |
36.2 |
2.15 |
|
Al-Shirqat district |
25.6 |
42.8 |
31.6 |
2.06 |
|
Average |
24.4 |
42.4 |
33.2 |
2.1 |
Based on the use of the weighted service education formula.
This shows an extremely high level of High Education, reaching above 36% in some districts, whereas the level of Low Education falls to about (21.3% - 22.1%). This demonstrates the presence of skilled workers with high scientific qualifications that could deliver quality services, a result caused by the closeness of these districts to cities and the establishment of educational and service facilities there. Therefore, it can be stated that one of the most significant features of the service industry in Saladin Governorate is its increasing education index, accompanied by the spatial convergence of the index. This is due to the growth of modern services and their dependence on a labor force with medium and high levels of education, as the service industry differs from other economic activities in being heavily dependent on scientific qualification.
IV. Spatial Variation Among Economic Activities According to Educational Levels
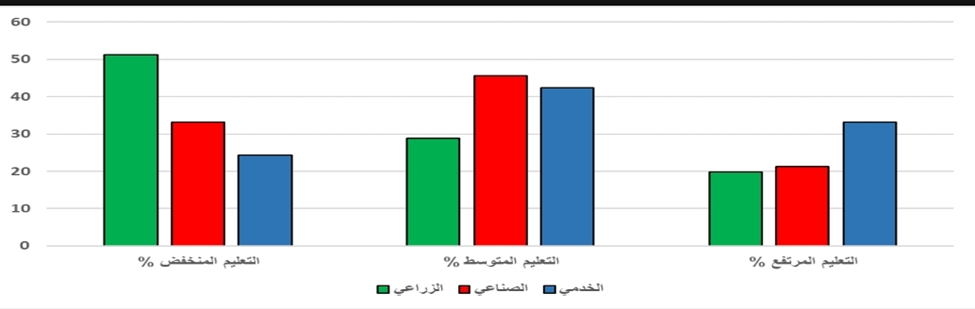
By making use of the tables showing the spatial variations in the three educational levels of the three economic activities mentioned in the previous pages, a statistical comparative analysis was conducted, aiming at a scientific explanation of the relation between the level of education and economic activity. The results shown in Table (13) and Figure (1) demonstrate a distinct variation in the educational composition of the workforce of the three economic activities in...
Map (4): Service Education Level Index in Saladin Governorate, 2023
Source: Prepared by the researcher based on Table (12), utilizing ArcGIS 10.8.
Saladin Governorate, where each economic activity exhibits an individual educational structure related to its functional role and degree of development.
For the Agricultural Sector, it can be noted that it is highly dependent on Low Education, which accounted for (51.3%); the highest value among the three sectors. Meanwhile, high education fell to (19.9%), indicating the conservative nature of agricultural practices and the dependence on actual work experience over theoretical education, in addition to the minimal use of technology in rural areas.
In the case of the Industrial Sector, there is a clear tendency towards Intermediate Education, which amounted to (45.6%); the highest value among the three sectors. Additionally, low education saw a decline in comparison to agriculture, while high education experienced a slight increase to (21.2%). This suggests that industrial processes rely on the technical labor force with moderate qualifications, forming the basis of industrial production.
Table (13): Correlation Between the Educational Structure and Economic Activity in Saladin Governorate, 2024
|
Economic Activity |
Low education% |
Intermediate education% |
High education |
Education index |
|
Agricultural |
51.3 |
28.8 |
19.9 |
1.7 |
|
industrial |
33.1 |
45.6 |
21.2 |
1.9 |
|
service |
24.4 |
42.4 |
33.2 |
2.1 |
Source: Based on the education index tables.
Meanwhile, the Service Sector recorded the highest percentage of High Education at (33.2%), the highest among the three sectors, with a clear decline in low education to (24.4%). This reflects the nature of this sector, which relies on scientific competencies and cognitive skills, particularly in the fields of education, health, administration, and modern services.
These differences become even more apparent through the Education Index, where the service sector recorded the highest value at (2.10), followed by the industrial activity at (1.90), and finally the agricultural activity at (1.70). This demonstrates a clear progression in the level of scientific qualification, moving from traditional activities toward modern economic sectors.
Figure (1): The Relationship Between Educational Level and Economic Activity in Saladin Governorate, 2023
Source: Based on Table (13).
Results::
There is a clear spatial relationship between the population's educational structure and the patterns of economic activity in Saladin Governorate, as advanced economic activities are concentrated in areas with higher educational levels.
The results show that regions dominated by Low Education tend to rely on primary activities like agriculture, whereas High Education levels are associated with commercial and service-oriented activities.
There is a significant spatial variation in education distribution within the governorate, which directly reflects the disparity of economic activities among the administrative units.
Education plays a fundamental role in directing the labor market, as educational specializations are closely linked to the nature of prevailing economic activities in each region.
There is a developmental imbalance between the governorate's regions due to unequal educational opportunities, leading to variations in the nature of economic activities.
A positive correlation exists between rising educational levels and the diversification of economic activity, where economic flexibility increases in more educated areas.
Geographical factors and infrastructure play a supporting role alongside education in determining economic activity patterns, yet they remain less influential compared to the educational structure.
Recommendations:
It is essential to enhance the educational level of the population in Saladin Governorate, particularly in areas suffering from low academic attainment, due to its direct impact on improving economic activities.
The outputs of the educational process must be linked to labor market needs by developing curricula that align with prevailing economic activities, contributing to the integration of education and economic development.
Encourage investments across various economic sectors, especially in regions with high educational levels, to utilize available human expertise and achieve greater economic diversity.
Support regions with low educational levels by implementing vocational training and qualification programs to enhance workforce skills and enable their engagement in economic activities.
Ensure the equitable distribution of educational institutions across various units to reduce spatial disparities in educational levels.
Encourage the establishment of small and medium-sized enterprises (SMEs) that align with the educational characteristics of the population.
BIBLIOGRAPHY:
Arabic References:
1. Abu Ayana, Fathi Muhammad. Economic Geography: Fundamentals and Applications. University Knowledge House, Alexandria, 2009.
2. Hussein, Abdul Razzaq Muhammad. Economic Geography. Dar Al-Maysara for Publishing and Distribution, Amman, 2014.
3. Al-Dulaimi, Qasim Muhammad Salih. Agricultural Geography. 1st ed. Dar Al-Maysara for Publishing and Distribution, Amman, 2011.
4. Foreign References:
5. UNESCO. International Standard Classification of Education (ISCED 2011). UNESCO Institute for Statistics, 2012: 26.
6. Hayami, Y. & Ruttan, V. Agricultural Development. Johns Hopkins University Press, 1985.
7. Huffman, W. E. Human Capital, Education, and Agriculture. Iowa State University, 2000.
8. Todaro, Michael P. & Smith, Stephen C. Economic Development. Pearson Education, 2015.
9. Official Reports and Data:
10. Iraqi Ministry of Planning. Iraqi Governorates Guide: Saladin. Baghdad, 2022.
11. Central Statistical Organization (CSO). Annual Statistical Data for Saladin Governorate. Baghdad, 2023.