Rational Design and Multivariate Optimization of Ketorolac and Curcumin-Loaded Nanoliposomes: A Comparative Investigation of Release Kinetics and Stability Dynamics
- Sanju , Research Scholar, Lords University, Alwar (Raj.), 301028 India
- Dr Gaurav Kumar Soni , Associate Professor Lords University, Alwar (Raj.), 301028 India
Article Information:
Abstract:
Background: In order to achieve controlled and sustained drug administration, the current study used a systematic 3² factorial design technique to generate and optimize nanoliposomal formulations of curcumin and ketorolac tromethamine. Phosphatidylcholine and cholesterol were the main lipid components used in the thin-film hydration process to create nanoliposomes1. The impact of formulation factors on drug release behavior and physicochemical properties was examined.Particle size, zeta potential, entrapment efficiency, polydispersity index (PDI), and drug content were measured for the produced formulations. The nanoscale particle size, appropriate PDI, and negative zeta potential of both ketorolac and curcumin liposomes demonstrated good stability. Because curcumin liposomes are lipophilic, they demonstrated a higher entrapment efficiency than ketorolac2.Both medications showed a sustained release pattern over 360 minutes in in vitro drug release experiments. While cholesterol had little effect, the release rate dropped as the concentration of phosphatidylcholine increased. Drug release followed the Higuchi model with super case-II transport mechanism, according to kinetic modeling, suggesting diffusion-controlled release in conjunction with lipid bilayer relaxation.The substantial impact of formulation factors was validated by statistical analysis and response surface methods, which also made it possible to optimize the formulations. Excellent agreement between predicted and experimental values was demonstrated by the optimized formulations3. Studies on stability under accelerated settings showed continuous drug release behavior and little alteration in physicochemical characteristics.All things considered, the created nanoliposomal systems showed successful drug loading, regulated drug release, and adequate stability, indicating their potential as useful carriers for both lipophilic and hydrophilic medications in cutting-edge drug delivery systems.
Keywords:
Article :
INTRODUCTION:
Systems for controlled drug delivery are made to minimize side effects and the frequency of doses while maintaining therapeutic drug concentrations for a long time. Liposomes have drawn a lot of interest among different delivery methods because of their biocompatibility, capacity to encapsulate a variety of drug compounds, and promise to offer targeted and prolonged drug release. Drug diffusion and release kinetics are significantly influenced by the structural features of liposomes, especially their phospholipid bilayer4,5.
Predicting the in-vivo performance of liposomal formulations requires an understanding of the in-vitro drug release behavior and underlying release processes. Lipid composition, vesicle size, membrane stiffness, and drug–lipid interactions are some of the parameters that affect drug release from liposomes. Specifically, cholesterol increases membrane stability and decreases permeability, while phosphatidylcholine helps build the lipid bilayer. Together, these variables dictate whether the drug release occurs through anomalous, erosion-controlled, or diffusion-controlled transport modes.
Two pharmacologically significant substances with unique physicochemical characteristics are ketorolac and curcumin. While curcumin, a lipophilic substance, is integrated into the lipid bilayer, ketorolac, which is comparatively hydrophilic, is mainly found in the watery core of liposomes. Their release patterns and kinetic behavior are greatly impacted by this variation in drug localization, which makes them perfect candidates for comparative analysis in liposomal systems6.
Stability is a crucial factor in the creation of liposomal formulations, along with release behavior. The product's effectiveness and shelf life can be greatly impacted by physical and chemical stability problems like vesicle aggregation, drug leakage, and degradation. According to ICH recommendations, accelerated stability studies are necessary to assess formulations' resilience under stress and forecast their long-term stability7.
Drug release mechanisms can be better understood by mathematically modeling drug release data using kinetic models such zero-order, first-order, Higuchi, Hixson–Crowell, and Korsmeyer–Peppas. These models aid in determining whether diffusion, dissolution, or structural relaxation processes are the main mechanisms controlling drug release8.
Thus, the goal of this work is to conduct a thorough comparative analysis of the stability, release kinetics, and in-vitro drug release of curcumin and ketorolac nanoliposomal formulations. The study's main objectives are to determine the primary release mechanisms through kinetic modeling, evaluate formulation stability under accelerated settings, and clarify how lipid composition affects release behavior. It is anticipated that the results of this study will advance knowledge of the dynamics of drug release in liposomal systems and aid in the creation of effective controlled drug delivery.
Material and Method:
Materials
Curcumin and ketorolac tromethamine were chosen as model medications for this study because of their unique physicochemical characteristics. Because of their crucial function in creating stable lipid bilayer structures, phosphatidylcholine and cholesterol were used as the main lipid components for the creation of nanoliposomal formulations. The study's remaining chemicals and reagents were all analytical grade and purchased from reliable vendors. Throughout the trials, distilled water was utilized, and all ingredients were used exactly as supplied, requiring no additional purification.
2.2 Preparation of Nanoliposomes
The thin-film hydration approach was used to create nanoliposomal formulations of curcumin and ketorolac tromethamine. To create a transparent lipid solution, precisely measured amounts of cholesterol and phosphatidylcholine were dissolved in a 2:1 v/v chloroform–methanol mixture. A rotary evaporator was then used to evaporate the organic solvent under low pressure, creating a thin, homogeneous lipid layer on the flask's inner wall.
To aid in the creation of multilamellar vesicles, the dried lipid film was then hydrated with an aqueous phase containing either curcumin or ketorolac tromethamine while being continuously stirred9. In order to minimize vesicle size and produce nanosized liposomes with better homogeneity, the resultant dispersion was subsequently subjected to probe sonication. Before being further characterized, the produced nanoliposomal suspensions were kept in suitable storage.
2.3 Experimental design
The impact of formulation variables on the drug release behavior of ketorolac and curcumin nanoliposomal formulations was methodically investigated using a full factorial design. Phosphatidylcholine (X₁) and cholesterol (X₂), each examined at three distinct levels (low, medium, and high), were chosen as the two independent variables. In order to evaluate the formulations' intermediate and extended release characteristics, the dependent responses were the percentage cumulative drug release at 240 minutes (Y₂₄₀) and 360 minutes (Y₃60)10. Nine experimental formulations (F1–F9) encompassing every possible combination of the chosen variables were created based on the factorial design (Table 2,3). This design strategy made it possible to assess the separate and combined effects of cholesterol and phosphatidylcholine on drug release. It also made it easier to optimize the liposomal formulation for prolonged and regulated drug delivery.
Table1 : Formulation Design of Ketorolac and Curcumin Liposomes (3² Factorial Design)
|
Variable |
Low (−1) |
Medium (0) |
High (+1) |
|
Phosphatidylcholine (PC) -X1 |
100 mg |
150 mg |
200 mg |
|
Cholesterol (CH) -X2 |
20 mg |
40 mg |
60 mg |
Table 2 : Complete Composition of Ketorolac Liposomes
|
Code |
PC (mg) |
CH (mg) |
Drug (mg) |
Organic Solvent (mL) |
Hydration Medium (mL) |
Tween 80 |
Sucrose |
|
K1 |
100 |
20 |
10 |
10 |
20 |
0.5% |
5% |
|
K2 |
100 |
40 |
10 |
10 |
20 |
0.5% |
5% |
|
K3 |
100 |
60 |
10 |
10 |
20 |
0.5% |
5% |
|
K4 |
150 |
20 |
10 |
10 |
20 |
0.5% |
5% |
|
K5 |
150 |
40 |
10 |
10 |
20 |
0.5% |
5% |
|
K6 |
150 |
60 |
10 |
10 |
20 |
0.5% |
5% |
|
K7 |
200 |
20 |
10 |
10 |
20 |
0.5% |
5% |
|
K8 |
200 |
40 |
10 |
10 |
20 |
0.5% |
5% |
|
K9 |
200 |
60 |
10 |
10 |
20 |
0.5% |
5% |
Table 3 : Complete Composition of Curcumin Liposomes
|
Code |
PC (mg) |
CH (mg) |
Drug (mg) |
Organic Solvent (mL) |
Hydration Medium (mL) |
Antioxidant |
Trehalose |
|
C1 |
100 |
20 |
10 |
10 |
20 |
0.02% |
5% |
|
C2 |
100 |
40 |
10 |
10 |
20 |
0.02% |
5% |
|
C3 |
100 |
60 |
10 |
10 |
20 |
0.02% |
5% |
|
C4 |
150 |
20 |
10 |
10 |
20 |
0.02% |
5% |
|
C5 |
150 |
40 |
10 |
10 |
20 |
0.02% |
5% |
|
C6 |
150 |
60 |
10 |
10 |
20 |
0.02% |
5% |
|
C7 |
200 |
20 |
10 |
10 |
20 |
0.02% |
5% |
|
C8 |
200 |
40 |
10 |
10 |
20 |
0.02% |
5% |
|
C9 |
200 |
60 |
10 |
10 |
20 |
0.02% |
5% |
Characterization of Nanoliposomes
Particle size, polydispersity index (PDI), zeta potential, entrapment efficiency, and drug content were among the important physicochemical characteristics of the produced nanoliposomal formulations of ketorolac and curcumin. Dynamic light scattering was used to measure particle size and PDI in order to assess the formulations' homogeneity and vesicle size distribution11,12. To evaluate the liposomes' surface charge and forecast their colloidal stability, zeta potential tests were performed.
Centrifugation was used to separate the unentrapped drug from the liposomal dispersion, and the free drug was then quantitatively analyzed to evaluate the entrapment efficiency. Following the proper dilution of the formulation, the drug content was determined using a recognized spectrophotometric method. To guarantee consistency, stability, and effective drug loading of the nanoliposomal systems, these criteria were assessed13.
In vitro drug release study
The produced nanoliposomal formulations were subjected to controlled experimental settings for in vitro drug release experiments. Samples were taken at pre-arranged intervals during the 360-minute research. To maintain sink conditions, a suitable volume of the release medium was gathered at each interval and replaced with new medium.
A proven spectrophotometric technique was used to measure the amount of drug released, and the cumulative percentage drug release was computed14,15. The purpose of these investigations was to assess the liposomal formulations' sustained release behavior and release profile.
Drug release kinetics
To clarify the process of drug release, the in-vitro drug release data of the nanoliposomal formulations were fitted to a number of kinetic models, including zero-order, first-order, Higuchi, Hixson–Crowell, and Korsmeyer–Peppas models. The correlation coefficient (R²) was used to assess each model's applicability; the model with the highest R² value was deemed to be the best-fit model explaining the release behavior16.
Additionally, the mechanism of drug release was described using the diffusion exponent (n) derived from the Korsmeyer–Peppas model, which indicated whether the release followed super case-II transport, non-Fickian transport, or Fickian diffusion. This kinetic research shed light on the liposomal matrix's function in regulating drug diffusion as well as the release mechanism17.
Statistical analysis
To ensure data repeatability and dependability, all tests were conducted in triplicate, and the results were expressed as mean ± standard deviation (SD). To assess the relevance of formulation factors, statistical analysis was performed using the proper tools. While analysis of variance (ANOVA) was employed to ascertain the statistical significance of the model and individual factors, regression analysis was utilized to discover the relationship between independent variables and the measured responses. Statistical significance was defined as a p-value of less than 0.05.
Stability study
The improved checkpoint nanoliposomal formulations of curcumin and ketorolac were subjected to stability investigations in compliance with ICH guideline Q1A(R2) for pharmaceutical product stability testing. For four weeks, the formulations were kept under accelerated stability conditions at 40 ± 2°C and 75 ± 5% relative humidity (RH) in airtight glass containers.
At predefined intervals (0, 1, 2, 3, and 4 weeks), samples were taken out and assessed for important physicochemical characteristics, such as particle size, entrapment effectiveness, drug content, and physical appearance18. These tests were carried out to evaluate the liposomal formulations' physical stability and to identify any possible alterations, such as vesicle aggregation, drug leakage, or degradation during storage.
Stability indicating In-vitro drug release
By comparing the in-vitro release profiles obtained at the initial time point and after four weeks of storage under accelerated settings, the impact of storage on the drug release behavior of the improved nanoliposomal formulations was assessed. To guarantee uniformity in comparison, drug release investigations were conducted under the same experimental settings19.
Any changes in the release profiles during the stability investigation were quantitatively evaluated using the similarity factor (f₂). A similarity between the release profiles was indicated by a f₂ value more than 50, indicating that the drug release properties of the formulations were not considerably impacted by storage conditions.
Chemical Stability and Degradation kinetics
By calculating the proportion of medicine remaining at predefined time intervals under accelerated storage circumstances, the chemical stability of the improved nanoliposomal formulations was assessed. This evaluation was done to track any possible medication deterioration in the liposomal system over time.
A first-order kinetic model was used to examine the degradation kinetics, and the logarithm of the proportion of medication left was plotted versus time. The slope, intercept, and correlation coefficient (R²) were computed from the resulting linear plot in order to assess the model's quality of fit and deterioration rate20.
This investigation verified that the liposomal method is appropriate for preserving medication integrity throughout storage and offered insight into the stability profile of the formulations.
Comparative evaluation of Physicochemical properties
Ketorolac and curcumin nanoliposomes were compared in terms of particle size, polydispersity index (PDI), and zeta potential in order to evaluate vesicle properties and dispersion stability. Dynamic light scattering techniques were used to assess both formulations under the same experimental conditions.
Comparative evaluation of Efficiency and Drug content
Centrifugation and spectrophotometric techniques were used to measure the drug concentration and entrapment efficiency of both formulations. The purpose of this assessment was to determine how drug physicochemical characteristics affected drug loading capacity and formulation effectiveness.
Comparative In vitro Drug release and Kinetic Analysis
The dialysis bag diffusion method was used to conduct comparative in-vitro drug release investigations of ketorolac and curcumin nanoliposomal formulations under identical experimental circumstances. To calculate the cumulative percentage drug release, samples were taken out at pre-arranged intervals and subjected to spectrophotometric analysis. The impact of formulation variables, specifically phosphatidylcholine and cholesterol, on drug release behavior was assessed, and the significance of these variables was ascertained using statistical analysis utilizing ANOVA21.
To further clarify the process of drug release, the release data of both formulations were fitted into a number of kinetic models, including zero-order, first-order, Higuchi, Hixson–Crowell, and Korsmeyer–Peppas models. The correlation coefficient (R2) was used to determine which model was best. The release process was described using the diffusion exponent (n) derived from the Korsmeyer–Peppas model. The release kinetics of curcumin and ketorolac liposomal systems were compared in order to find similarities and differences22.
RESULT AND DISCUSSION :
Physicochemical Characterizaton of Nanoliposomes
To determine their appropriateness for nanoscale drug delivery, the produced nanoliposomal formulations of curcumin and ketorolac were assessed for drug content, entrapment efficiency, zeta potential, particle size, and polydispersity index (PDI) shown in table 4.
Curcumin nanoliposomes showed somewhat higher values ranging from 148.3 nm to 247.2 nm, indicating successful generation of nanosized vesicles, while ketorolac nanoliposomes had particle sizes ranging from 142.6 nm to 245.8 nm. From F1 to F9, vesicle size gradually increased as phosphatidylcholine and cholesterol concentrations rose, resulting in thicker lipid bilayers. The PDI values for curcumin (0.218–0.318) and ketorolac (0.212–0.312) showed a somewhat narrow size distribution, indicating adequate vesicle homogeneity.
Zeta potential (Table-5) measurements showed adequate electrostatic repulsion and strong colloidal stability, ranging from −21.4 mV to −35.1 mV for ketorolac and −20.8 mV to −34.2 mV for curcumin. The magnitude of the surface charge increased with higher lipid contents.
Ketorolac and curcumin had entrapment efficiencies of 62.4–86.5% and 70.8–91.2%, respectively, with curcumin exhibiting greater entrapment since it is lipophilic. Both formulations' medication content stayed high (>94%), indicating consistent drug delivery.
Table 4 : Particle Size and PDI of Ketorolac (KTL) and Curcumin (CCM) Nanoliposomes
|
Formulation |
Particle Size (nm) of KTL |
PDI of KTL |
Particle Size (nm) of CCM |
PDI of CCM |
|
F1 |
142.6 ± 2.1 |
0.212 |
148.3 ± 2.4 |
0.218 |
|
F2 |
156.8 ± 1.9 |
0.226 |
160.7 ± 2.1 |
0.231 |
|
F3 |
168.4 ± 2.3 |
0.238 |
172.5 ± 2.6 |
0.244 |
|
F4 |
182.7 ± 2.5 |
0.251 |
185.9 ± 2.8 |
0.256 |
|
F5 |
195.3 ± 2.7 |
0.263 |
197.6 ± 3.0 |
0.269 |
|
F6 |
207.9 ± 3.1 |
0.276 |
209.4 ± 2.9 |
0.281 |
|
F7 |
219.6 ± 2.8 |
0.289 |
221.8 ± 3.1 |
0.295 |
|
F8 |
231.5 ± 3.0 |
0.298 |
233.7 ± 3.3 |
0.304 |
|
F9 |
245.8 ± 3.4 |
0.312 |
247.2 ± 3.5 |
0.318 |
Table 5 : Zeta Potential of Ketorolac and Curcumin Nanoliposomes
|
Formulation |
Zeta Potential of Ketorolac (mV) |
Zeta Potential of Curcumin (mV) |
|
F1 |
-21.4 ± 1.2 |
-20.8 ± 1.1 |
|
F2 |
-23.1 ± 1.4 |
-22.6 ± 1.3 |
|
F3 |
-24.7 ± 1.3 |
-24.1 ± 1.2 |
|
F4 |
-26.5 ± 1.5 |
-25.9 ± 1.4 |
|
F5 |
-28.2 ± 1.6 |
-27.3 ± 1.5 |
|
F6 |
-29.8 ± 1.4 |
-29.1 ± 1.3 |
|
F7 |
-31.6 ± 1.7 |
-30.7 ± 1.6 |
|
F8 |
-33.4 ± 1.5 |
-32.5 ± 1.4 |
|
F9 |
-35.1 ± 1.8 |
-34.2 ± 1.7 |
In-Vitro drug Release study
Over a 360-minute period, both ketorolac and curcumin nanoliposomal formulations demonstrated a regulated and prolonged drug release profile. At 30 minutes, there was an initial burst release (~6–7%), which was followed by a slow increase in drug release. Curcumin (Fig 2,3) formulations demonstrated 56–74% release at 240 minutes, while ketorolac formulations displayed 51–72% release. Both medications reached around 90% cumulative release at 360 minutes. Because of its lipid bilayer localization, curcumin formulations exhibited somewhat greater release at intermediate phases.
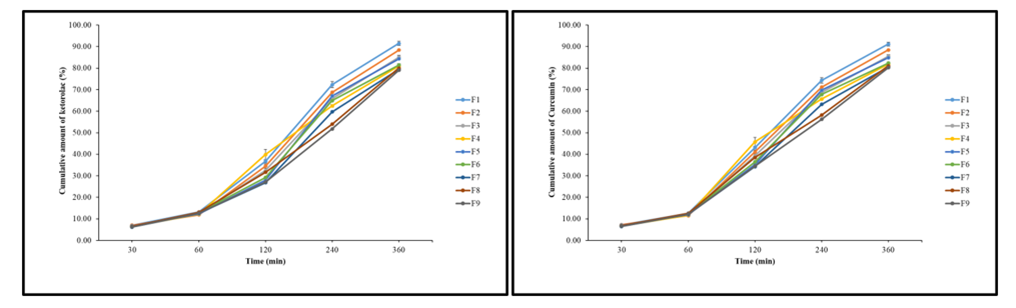
Figure 1 : In-Vitro release of Ketorolac and Curcuminfrom different formulations
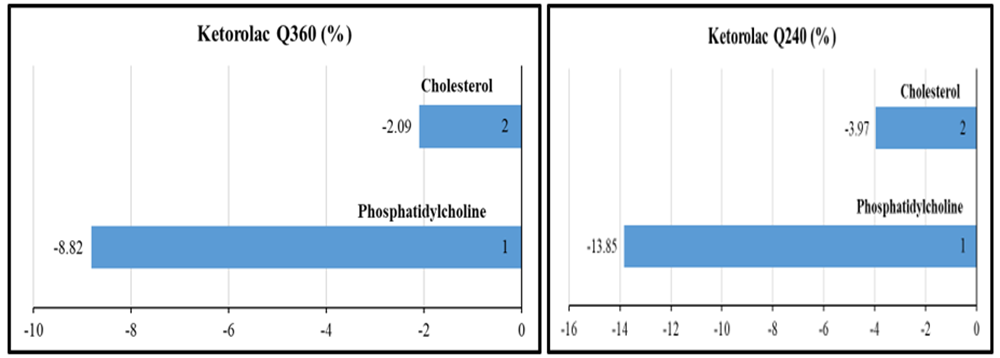
Figure 2: Main Effect of Concentration of Cholesterol and Phosphatidylcholine on In-Vitro release of Ketorolac at360 min and 240 min.
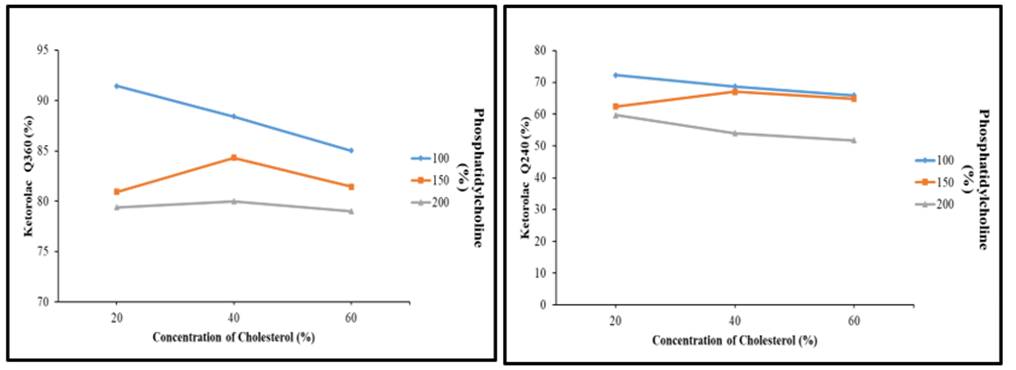
Figure 3 :Interaction between concentration of Phosphatidylcholine and Cholesterol on In-Vitro release of Ketorolac at 360 min and 240 min.
3.3 Effect of Formulation on Drug Release
By examining the impact of phosphatidylcholine and cholesterol concentrations on the cumulative drug release profile of both ketorolac and curcumin nanoliposomal formulations, the impact of formulation factors on drug release was assessed. For both systems, (Fig 4 ) it was found that raising the phosphatidylcholine concentration significantly decreased drug release. Ketorolac's cumulative drug release dropped from 88.29% to 79.47% after 360 minutes, whereas curcumin's dropped from 88.36% to 80.60%. This effect was found to be statistically significant (p < 0.05), indicating that higher phosphatidylcholine concentrations lead to the formation of a more rigid and compact lipid bilayer, which increases diffusion resistance and consequently slows drug release.
Cholesterol, on the other hand (Fig 5 ), had a relatively minor impact on drug release behavior. Ketorolac showed a drop from 83.92% to 81.83% and curcumin from 84.52% to 82.67% at 360 minutes as a result of an increase in cholesterol content. However, statistical analysis using ANOVA showed that this effect was not significant (p > 0.05), indicating that cholesterol largely contributes to membrane stability rather than significantly changing drug diffusion within the concentration range under study.
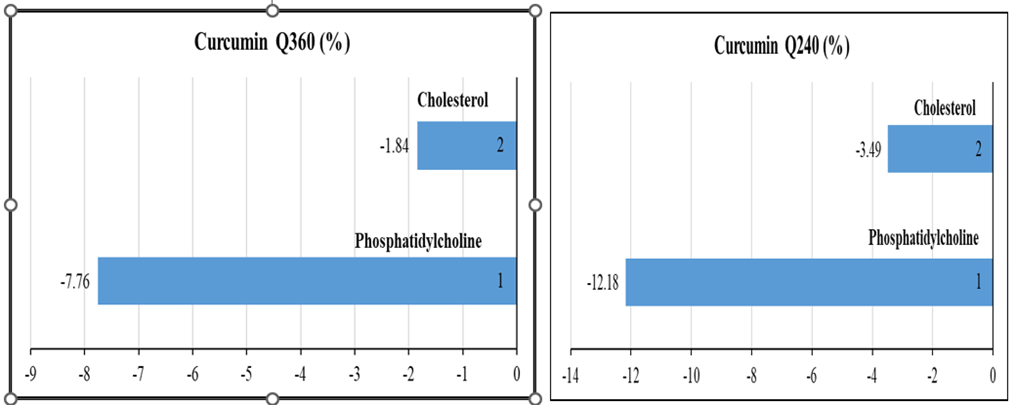
Figure 4 : Main Effect of Concentration of Cholesterol and Phosphatidylcholine on In-Vitro release of Curcumin at 360 min and 240 min.
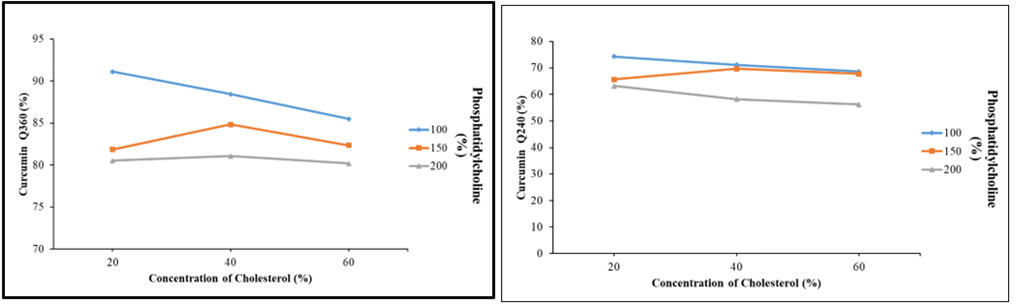
Figure 5 : Interaction between concentration of Phosphatidylcholine and Cholesterol on In-Vitro release of Curcumin at360 min and 240 min.
3.2 Drug release Kinetic
To clarify the mechanism of drug release, the in-vitro drug release data of curcumin and ketorolac nanoliposomal formulations were fitted into different kinetic models. The Higuchi model showed the highest correlation coefficients (R² = 0.99) for both medicines among the models (Table – 7,8) examined, suggesting that diffusion through the lipid matrix primarily controls the release mechanism. Diffusion exponent (n) values for ketorolac and curcumin ranged from 1.0139 to 1.0931 and 1.0266 to 1.0940, respectively, according to additional investigation using the Korsmeyer–Peppas model. These values match super case-II transport, indicating that a combination of lipid bilayer structural relaxation and diffusion controls drug release. Furthermore, a controlled and prolonged drug release profile was indicated by the improved formulation (F9), which showed a strong fit to zero-order kinetics.
Table 7 :Release Kinetics and Model Fitting of Ketorolac Liposomal Formulations
|
Release kinetics-Model Fitting |
|||||||
|
Formulation Code |
Co-relation Coefficient for the model |
Korsemeyer-Peppas |
|||||
|
0 - order R% vs T |
1 - order log R% vs T |
Highuchi R% vs T1/2 |
Hixon-Crowell (1001/3 - R%1/3) vs T |
Korsemeyer-Peppas Mt/M∞ vs T |
k |
n |
|
|
F1 |
0.9891 |
0.9234 |
0.9949 |
-0.9543 |
0.9891 |
0.0017 |
1.0860 |
|
F2 |
0.9908 |
0.9304 |
0.9940 |
-0.9588 |
0.9908 |
0.0017 |
1.0795 |
|
F3 |
0.9920 |
0.9277 |
0.9950 |
-0.9591 |
0.9920 |
0.0015 |
1.0931 |
|
F4 |
0.9801 |
0.9010 |
0.9939 |
-0.9341 |
0.9801 |
0.0018 |
1.0606 |
|
F5 |
0.9903 |
0.9445 |
0.9887 |
-0.9689 |
0.9903 |
0.0017 |
1.0648 |
|
F6 |
0.9906 |
0.9349 |
0.9923 |
-0.9635 |
0.9906 |
0.0018 |
1.0599 |
|
F7 |
0.9957 |
0.9426 |
0.9921 |
-0.9712 |
0.9957 |
0.0017 |
1.0500 |
|
F8 |
0.9973 |
0.9322 |
0.9940 |
-0.9655 |
0.9973 |
0.0021 |
1.0139 |
|
F9 |
0.9998 |
0.9474 |
0.9894 |
-0.9776 |
0.9998 |
0.0020 |
1.0186 |
Table 8 : Release Kinetics and Model Fitting of Curcumin Liposomal Formulations
|
Release kinetics-Model Fitting |
|||||||
|
Formultion Code |
Co-relation Coefficient for the model |
Korsemeyer-Peppas |
|||||
|
0 - order R% vs T |
1 - order log R% vs T |
Highuchi R% vs T1/2 |
Hixon-Crowell (1001/3 - R%1/3) vs T |
Korsemeyer-Peppas Mt/M∞ vs T |
k |
n |
|
|
F1 |
0.9784 |
0.9050 |
0.9927 |
-0.9358 |
0.9784 |
0.0018 |
1.0879 |
|
F2 |
0.9802 |
0.9096 |
0.9925 |
-0.9389 |
0.9802 |
0.0017 |
1.0831 |
|
F3 |
0.9815 |
0.9077 |
0.9940 |
-0.9394 |
0.9815 |
0.0016 |
1.0940 |
|
F4 |
0.9630 |
0.8835 |
0.9852 |
-0.9138 |
0.9630 |
0.0019 |
1.0660 |
|
F5 |
0.9841 |
0.9226 |
0.9926 |
-0.9506 |
0.9841 |
0.0018 |
1.0703 |
|
F6 |
0.9821 |
0.9139 |
0.9938 |
-0.9443 |
0.9821 |
0.0018 |
1.0654 |
|
F7 |
0.9884 |
0.9201 |
0.9959 |
-0.9512 |
0.9884 |
0.0018 |
1.0573 |
|
F8 |
0.9861 |
0.9098 |
0.9942 |
-0.9429 |
0.9861 |
0.0021 |
1.0266 |
|
F9 |
0.9930 |
0.9229 |
0.9952 |
-0.9556 |
0.9930 |
0.0020 |
1.0314 |
3.3 Statistical Analysis and Regression Modeling
The results showed a good connection between the independent factors and the observed responses when multiple regression analysis was used to assess the link between formulation characteristics and drug release behavior. The coefficient of determination (R2) for ketorolac nanoliposomes at 360 minutes was 0.9441, meaning that the model accounted for 94.41% of the variation in drug release. With a p-value of 0.0426 (p < 0.05), the model proved statistically significant. In a similar vein, the R2 value for curcumin nanoliposomes at 360 minutes was likewise 0.9441, indicating that the regression model had a strong predictive capacity and was also determined to be statistically significant.
Phosphatidylcholine had a negative effect on drug release, according to analysis of regression coefficients. This suggests that raising its concentration results in less drug diffusion because of increased lipid bilayer stiffness. On the other hand, within the examined range, cholesterol had very little effect on medication release. As shown by the small residual error between anticipated and experimental values, the generated regression models generally showed acceptable predictive accuracy, indicating their usefulness for formulation variable optimization.
3.4 Response Surface Methodology
The interaction between the formulation factors, phosphatidylcholine (X₁) and cholesterol (X₂), and their combined impact on the drug release behavior of ketorolac and curcumin nanoliposomal formulations were successfully examined using Response Surface Methodology (RSM). Three-dimensional (3D) response surface plots (Fig 6 ) and two-dimensional contour plots were used to better visualize the association between independent factors and responses after the experimental data were fitted to a second-order polynomial model. The response surface plots that were produced made it evident that there was a discernible decrease in cumulative drug release when the quantity of lipid components, especially
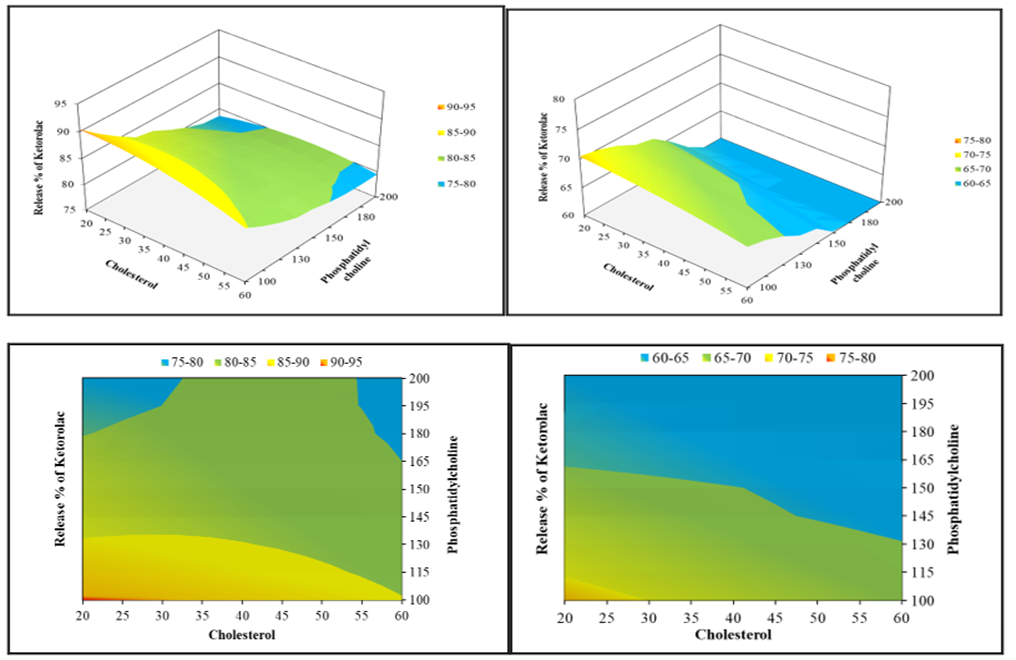
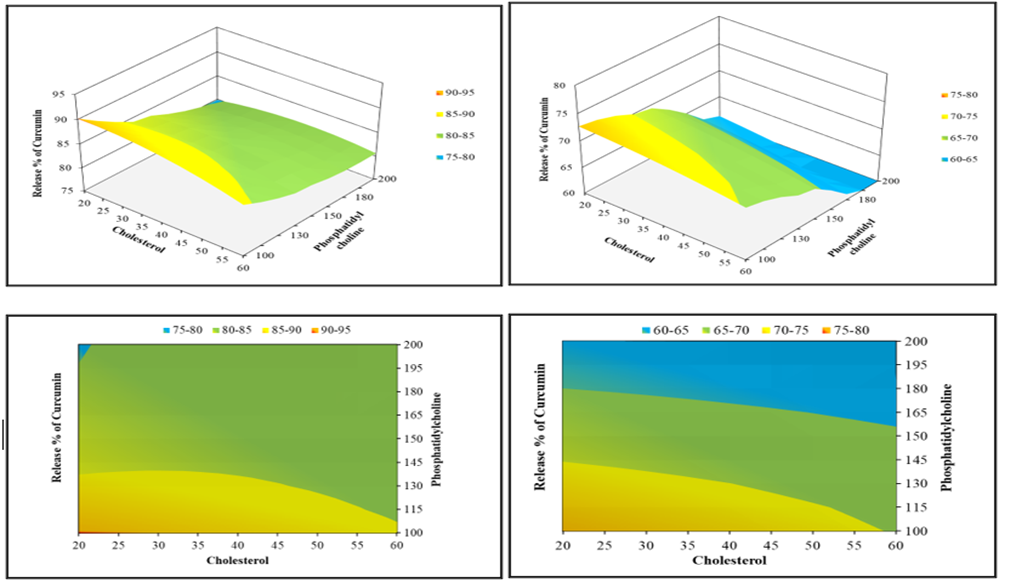
Figure 6 : Three-dimensional response surface plot showing effect of concentration of Phosphatidylcholine and Cholesterol on Release of Curcumin and Ketorolac at 360 min and 240 min.
phosphatidylcholine, increased. The development of a thicker and more rigid lipid bilayer, which raises diffusion resistance and limits the flow of drug molecules from the liposomal vesicles, is responsible for this tendency. By improving membrane stability, cholesterol also contributed to this action, though its impact was not as strong as that of phosphatidylcholine.
The contour plots made it easier to see how the factors interacted and assisted in locating areas with comparable drug release reactions. These graphical studies revealed an ideal formulation region where drug diffusion and membrane stability were balanced at moderate phosphatidylcholine and cholesterol concentrations. The ideal state for achieving regulated and prolonged medication release is represented by this optimized zone.
All things considered, RSM turned out to be a useful technique for comprehending the intricate relationships between formulation variables and for determining the ideal mix of lipid components needed to produce the intended drug release profile with the fewest possible experimental trials.
3.5 Design Space Optimization
Regression modeling and response surface analysis were used to determine the ideal ranges of formulation variables that guarantee the intended drug release behavior in the design space for ketorolac and curcumin nanoliposomal formulations. Phosphatidylcholine between 100 and 105 mg and cholesterol between 20 and 25 mg were shown to be the optimal formulation range for ketorolac liposomes (Table 9) , which offered a regulated and prolonged drug release profile. With phosphatidylcholine between 100 and 130 mg and cholesterol between 20 and 30 mg, curcumin liposomes showed a relatively wider optimum range that produced effective drug encapsulation and sustained release properties.
Table 9 : Optimized Design Space for Liposomal Formulations
|
Drug |
Phosphatidylcholine (X₁) Range |
Cholesterol (X₂) Range |
Expected Drug Release Behaviour |
|
Ketorolac |
100 – 105 mg |
20 – 25 mg |
Provides controlled and sustained drug release with stable liposomal structure |
|
Curcumin |
100 – 130 mg |
20 – 30 mg |
Ensures improved drug entrapment and sustained release from lipid bilayer |
Curcumin's lipophilic characteristic, which permits better incorporation inside the lipid bilayer and offers greater flexibility in lipid composition without appreciably altering the release profile, is responsible for the wider design space seen. Ketorolac, on the other hand, showed a somewhat smaller design space, suggesting that slight changes in lipid content would have a greater impact on its drug release behavior. All things considered, the specified design space offers a variety of formulation factors that have been scientifically proven for the creation of optimal and repeatable nanoliposomal systems.
3.8 Checkpoint Validation
To verify the predictive power and dependability of the created regression models, checkpoint formulations were created inside the optimized design space. The predicted values produced by the polynomial equations were compared with the drug release values achieved through experimentation. With percentage error levels of less than 1% for both ketorolac and curcumin formulations, the results showed outstanding agreement between anticipated and experimental data. The generated models' accuracy (Table 10) and resilience are confirmed by this strong association, suggesting that they are trustworthy instruments for forecasting drug release behavior and refining nanoliposomal compositions.
Table 10 : Checkpoint Formulation for Validation of Design Space
|
Drug |
Phosphatidylcholine (mg) |
Cholesterol (mg) |
Predicted Y240 (%) |
Experimental Y240 (%) |
Predicted Y360 (%) |
Experimental Y360 (%) |
% Error |
|
Ketorolac |
102 |
22 |
70.410 |
70.079 |
90.023 |
89.590 |
0.48 |
|
Curcumin |
115 |
25 |
72.180 |
72.106 |
87.901 |
87.289 |
0.69 |
3.9 Stability Study
Over the course of four weeks, the stability of the improved nanoliposomal formulations of curcumin and ketorolac was assessed under accelerated storage settings (40 ± 2°C and 75 ± 5% RH). The findings showed that both formulations (Table 11-12) held steady over the course of the investigation. Both ketorolac and curcumin liposomes showed a modest increase in particle size, which could be explained by slight vesicle aggregation during storage. Furthermore, a slow but negligible decline in drug content and entrapment efficiency was observed (Fig 7), indicating limited drug leakage from the lipid bilayer over time.
Notwithstanding these little differences, the formulations' physical characteristics did not significantly alter, and they continued to be consistent with no indications of phase separation or precipitation. The liposomal systems retained their performance and structural integrity under accelerated settings, as evidenced by the total changes in physicochemical parameters falling within acceptable bounds. These results attest to the developed formulations' strong durability and suitability for other medicinal uses.
Table 11 : In-Vitro release of the Ketorolac from optimized check point formulation stored under accelerated stability condition
|
Time (min) |
Cumulative amount (%) |
|
|
0 week |
4th week |
|
|
30 |
6.095 ± 0.02 |
6.492 ± 0.02 |
|
60 |
13.357 ± 0.258 |
13.754 ± 0.139 |
|
120 |
47.857 ± 0.595 |
55.794 ± 0.595 |
|
240 |
70.079 ± 0.198 |
72.063 ± 0.525 |
|
360 |
89.59 ± 0.826 |
95.013 ± 0.606 |
|
f2factor |
|
71.011 |
Table 12: In-Vitro release of the Curcumin from optimized check point formulation stored under accelerated stability condition
|
Time (min) |
Cumulative amount (%) |
|
|
0 week |
4th week |
|
|
30 |
6.262 ± 0.027 |
6.437 ± 0.027 |
|
60 |
12.877 ± 0.129 |
13.08 ± 0.152 |
|
120 |
63.438 ± 0.349 |
66.928 ± 0.349 |
|
240 |
72.106 ± 0.267 |
73.851 ± 0.267 |
|
360 |
87.289 ± 0.363 |
90.78 ± 0.363 |
|
f2factor |
|
72.179 |
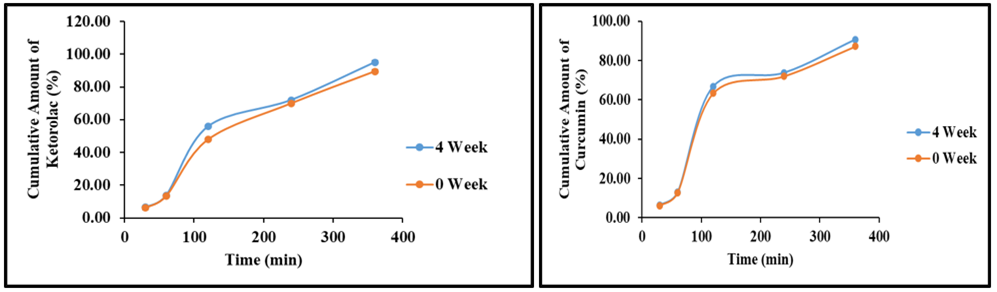
Figure 7 : In-Vitro release of the Ketorolac and Curcumin from optimized check point formulation stored under accelerated stability condition
3.10 Chemical Stability and Degradation Kinetic
Under accelerated storage settings, the improved ketorolac and curcumin nanoliposomal formulations' chemical stability was assessed, and kinetic modeling was used to examine the degradation behavior. The linear association found between the logarithm of the proportion of medication left and time revealed that both formulations followed first-order degradation kinetics. A extremely slow rate of drug degradation was indicated by the computed slope for both formulations, which was roughly −0.0005. Additionally, the correlation coefficient (R2 = 0.92) indicated that the first-order kinetic model suited the experimental data quite well (Table – 13-14, Fig 8). These results suggest that under accelerated settings, the liposomal system degrades both curcumin and ketorolac in a regulated and predictable way. The liposomal formulation's capacity to safeguard the medication and preserve its chemical stability during storage is further supported by the low rate of degradation.
Table 13 : Chemical stability data of the developed Ketorolac Liposomes in check point formulation at accelerated stability condition
|
Time (week) |
% Drug remaining (mean ± S.D.) |
Log % drug remaining (mean ± S.D.) |
95% |
|
|
UCI |
LCI |
|||
|
0 |
99.633 ± 0.379 |
1.998 ± 0.002 |
2.000 |
1.997 |
|
1 |
98.4 ± 0.3 |
1.993 ± 0.001 |
1.994 |
1.991 |
|
2 |
98.5 ± 0.361 |
1.993 ± 0.002 |
1.995 |
1.992 |
|
3 |
97.533 ± 0.153 |
1.989 ± 0.001 |
1.990 |
1.988 |
|
4 |
96.4 ± 0.436 |
1.984 ± 0.002 |
1.986 |
1.982 |
|
Slope |
-0.0005 |
-0.0005 |
-0.0005 |
-0.0005 |
|
Intercept |
99.56 |
1.9981 |
1.9997 |
1.9965 |
|
R2 |
0.9247 |
0.9247 |
0.926 |
0.9046 |
Table 14: Chemical stability data of the developed Curcumin Liposomes in check point formulation at accelerated stability condition
|
Time (week) |
% Drug remaining (mean ± S.D.) |
Log % drug remaining (mean ± S.D.) |
95% |
|
|
UCI |
LCI |
|||
|
0 |
100.633 ± 0.379 |
2.003 ± 0.002 |
2.005 |
2.001 |
|
1 |
99.4 ± 0.3 |
1.997 ± 0.001 |
1.999 |
1.996 |
|
2 |
99.5 ± 0.361 |
1.998 ± 0.002 |
2.000 |
1.996 |
|
3 |
98.533 ± 0.153 |
1.994 ± 0.001 |
1.994 |
1.993 |
|
4 |
97.4 ± 0.436 |
1.989 ± 0.002 |
1.991 |
1.986 |
|
Slope |
-0.0005 |
-0.0005 |
-0.0005 |
-0.0005 |
|
Intercept |
100.57 |
2.0025 |
2.0041 |
2.0008 |
|
R2 |
0.9247 |
0.9247 |
0.926 |
0.9046 |
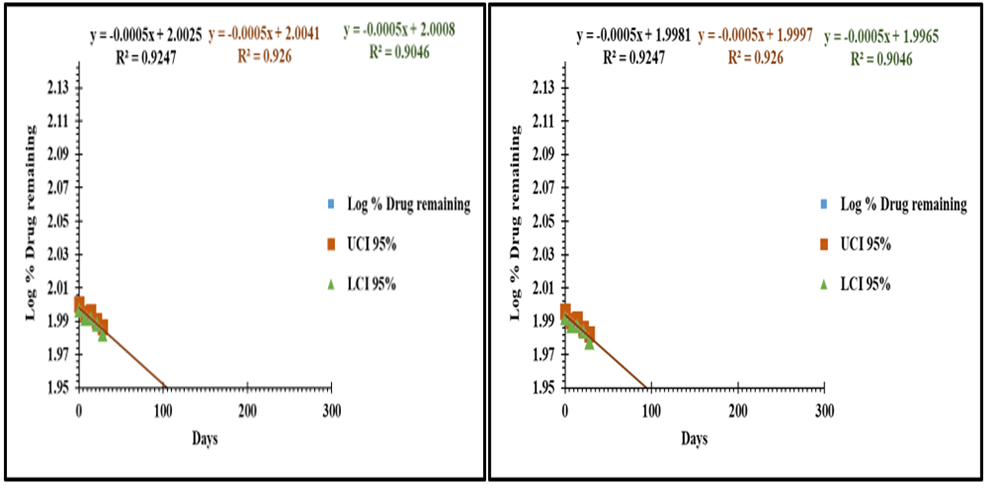
Figure 8 : First order degradation of Ketorolac and Curcumin liposome of check point formulation at accelerated storage condition
3.11 Comparative Evaluation of physicochemical Properties
Similar general patterns in vesicle features were found when the physicochemical parameters of ketorolac and curcumin nanoliposomal formulations were compared. Because curcumin is lipophilic, which makes it easier for it to be incorporated into the lipid bilayer, curcumin-loaded liposomes showed significantly bigger particle sizes and greater entrapment efficiency. Ketorolac liposomes, on the other hand, displayed comparatively smaller vesicle sizes and poorer entrapment efficiency. This is probably because the drug's hydrophilic nature restricts its integration into the lipid matrix.
Despite these variations, all formulations showed identical zeta potential ranges, indicating sufficient surface charge and colloidal stability, and comparable polydispersity index (PDI) values, indicating uniform particle size distribution. Overall, the findings imply that both nanoliposomal systems have advantageous physicochemical properties appropriate for reliable and efficient drug delivery.
3.12 Comparative Drug release and Kinetics
Both ketorolac and curcumin nanoliposomal formulations showed a sustained drug release profile during the study period, according to a comparison of their drug release and kinetic behavior. Diffusion through the lipid matrix was the main mechanism controlling drug release, according to kinetic modeling, which showed that the release data for both medicines best fit the Higuchi model. Additionally, both formulations followed super case-II transport, according to research using the Korsmeyer–Peppas model, indicating that drug release was regulated by a mix of diffusion and lipid bilayer structural relaxation.
For both ketorolac and curcumin liposomes, F9 was found to be the best formulation out of all of them since it showed the best release characteristics and better control over drug diffusion. These results demonstrate the effectiveness of the designed nanoliposomal systems in delivering both medicines in a controlled and sustained manner with similar kinetic characteristics.
3.13 Discussion in Relation to Existing literature
The effective development of ketorolac and curcumin nanoliposomal formulations with desired physicochemical and release characteristics is confirmed by the current study's results, which are in good agreement with previously published findings on liposomal drug delivery systems.
The PDI values (0.21–0.31) and particle size range (≈140–247 nm) found in this work are within the acceptable nanoscale limits documented in the literature, suggesting stable and homogenous vesicular systems. Similarly, the zeta potential values (−20 to −35 mV) suggest sufficient electrostatic stability, especially for formulations showing values close to −30 mV, and are compatible with published data for phosphatidylcholine-based liposomes.
Because lipophilic medications like curcumin have a greater affinity for the lipid bilayer than more hydrophilic medications like ketorolac, the entrapment efficiency results are consistent with known patterns. Consistent with earlier published research, high drug content values (>94%) further validate consistent medication distribution and effective formulation technique.
Lipid bilayers function as diffusion barriers in the literature, which is consistent with the sustained drug release pattern shown for both formulations. The current results corroborate the commonly documented reduction in drug release with increasing phosphatidylcholine concentration and the stabilizing impact of cholesterol.
Drug release is controlled by a combination of diffusion and bilayer relaxation processes, according to kinetic study demonstrating Higuchi diffusion and super case-II transport, which is consistent with previous research on liposomal systems. Furthermore, the observed homogeneous vesicle structure and spherical morphology are consistent with documented features of stable liposomal formulations.
Overall, the current work supports previous research and shows that liposomal systems are efficient carriers for hydrophilic and lipophilic medications, offering better encapsulation and regulated drug release.
CONCLUSION:
This case reports a rare and complex presentation of a neonate with a giant congenital melanocytic nevus in bathing-trunk distribution coexisting with a large pedunculated low-flow vascular malformation. Despite normal antenatal scans, the postnatal emergence and progressive enlargement of the mass required timely diagnostic evaluation and multidisciplinary care. Imaging with Doppler ultrasound and MRI played a pivotal role by confirming the superficial nature of the lesion and excluding deeper structural involvement, thereby enabling safe surgical excision. Early surgery prevented potential complications such as ulceration, infection, or haemorrhage and resulted in an excellent short-term outcome. Given the lifelong risk of melanoma and the psychosocial impact associated with GCMN, long-term dermatological and neurological follow-up is essential. This case underscores the need for vigilance in examining newborns, even after normal antenatal imaging, and highlights the importance of coordinated management in rare congenital presentations.
BIBLIOGRAPHY:
1. Immordino ML, Dosio F, Cattel L. Stealth liposomes: review of basic science and clinical applications. Int J Nanomedicine. 2006;1(3):297–315.
2. Patel HM. Serum opsonins and liposomes: their interaction and opsonophagocytosis. Crit Rev Ther Drug Carrier Syst. 1992;9(1):39–90.
3. Jain NK. Controlled and novel drug delivery. CBS Publishers. 2002.
4. Aulton ME, Taylor KMG. Aulton’s pharmaceutics: the design and manufacture of medicines. 5th ed. Elsevier. 2018.
5. Higuchi T. Mechanism of sustained-action medication. J Pharm Sci. 1963;52(12):1145–1149.
6. Korsmeyer RW, Gurny R, Doelker E, et al. Mechanisms of solute release from porous hydrophilic polymers. Int J Pharm. 1983;15(1):25–35.
7. Costa P, Sousa Lobo JM. Modeling and comparison of dissolution profiles. Eur J Pharm Sci. 2001;13(2):123–133.
8. ICH. Stability testing of new drug substances and products Q1A(R2). International Conference on Harmonisation. 2003.
9. Montgomery DC. Design and analysis of experiments. 8th ed. Wiley. 2013.
10. Myers RH, Montgomery DC, Anderson-Cook CM. Response surface methodology: process and product optimization. Wiley. 2016.
11. Shah VP, Tsong Y, Sathe P, Liu JP. In vitro dissolution profile comparison—similarity factor f2. Pharm Res. 1998;15(6):889–896.
12. Yadav AV, Murthy MS, Shete AS, Sakhare SS. Stability aspects of liposomes. Int J Pharm Sci Res. 2011;2(3):493–500.
13. Anand P, Kunnumakkara AB, Newman RA, Aggarwal BB. Bioavailability of curcumin: problems and promises. Mol Pharm. 2007;4(6):807–818.
14. Rainsford KD. Anti-inflammatory drugs in the 21st century. Subcell Biochem. 2007;42:3–27.
15. Bangham AD, Standish MM, Watkins JC. Diffusion of univalent ions across the lamellae of swollen phospholipids. J Mol Biol. 1965;13(1):238–252.
16. Gregoriadis G. Liposome technology: liposome preparation and related techniques. CRC Press. 2006.
17. Torchilin VP. Recent advances with liposomes as pharmaceutical carriers. Nat Rev Drug Discov. 2005;4(2):145–160.
18. Akbarzadeh A, Rezaei-Sadabady R, Davaran S, et al. Liposome: classification, preparation, and applications. Nanoscale Res Lett. 2013;8:102.
19. Bozzuto G, Molinari A. Liposomes as nanomedical devices. Int J Nanomedicine. 2015;10:975–999.
20. Allen TM, Cullis PR. Liposomal drug delivery systems: from concept to clinical applications. Adv Drug Deliv Rev. 2013;65(1):36–48.
21. Mozafari MR. Nanoliposomes: preparation and analysis. Methods Mol Biol. 2010;605:29–50.
22. Sharma A, Sharma US. Liposomes in drug delivery: progress and limitations. Int J Pharm. 1997;154(2):123–140.