Comparative Phytochemical Analysis of Uttarakhand's Finger Millet (Eleusine coracana L.) Varieties
- Amitesh Das , School of Agricultural Sciences, Department of Seed Science & Technology, SGRR University, Patel Nagar, Dehradun, Uttarakhand, 248001, India.
- Anita Trivedi , School of Agricultural Sciences, Department of Seed Science & Technology, SGRR University, Patel Nagar, Dehradun, Uttarakhand, 248001, India.
- Paarthiban K , School of Agricultural Sciences, Department of Agronomy, SGRR University, Patel Nagar, Dehradun, Uttarakhand, 248001, India.
- Vinay Chamoli , Department of Agriculture, JB Institute of Technology, Dehradun, Uttarakhand, India.
- Girish Chandra Tiwari , School of Agricultural Sciences, Department of Seed Science & Technology, SGRR University, Patel Nagar, Dehradun, Uttarakhand, 248001, India.
- Sobha , School of Agricultural Sciences, Department of Seed Science & Technology, SGRR University, Patel Nagar, Dehradun, Uttarakhand, 248001, India.
Article Information:
Abstract:
The hardy pseudocereal finger millet (Eleusine coracana L.) is widely grown in Asia and Africa and is prized for its numerous nutritional and medicinal uses. Although its proximate composition has been the subject of numerous studies, little is known about the comparative phytochemical profiles of various Indian cultivars. This research quantitatively evaluated eight finger millet varieties (V1–V8) from Uttarakhand for key bioactive compounds such as tannins, flavonoids, steroids, saponins, and glycosides, using spectrophotometric assays with standard calibration curves. The method's reliability was guaranteed by the strong linearity of the regression equations produced from tannic acid, quercetin, diosgenin, and securidaside (R2 > 0.99). Varietal differences were significant: V2 exhibited the highest flavonoid concentration (0.4411 mg/g), whereas V6 had the highest amounts of tannin (0.1829 mg/g), steroid (0.2292 mg/g), and glycoside (0.3990 mg/g). The levels of saponin remained relatively stable, with V7 showing a slight advantage at 0.1803 mg/g. These differences suggest that the buildup of secondary metabolites is shaped by both genetic background and environmental adaptation. The study provides the first comprehensive varietal comparison of phytochemicals in Uttarakhand finger millet and identifies V2 and V6 as promising candidates for nutraceutical and functional food applications.A methodological framework for varietal selection based on bioactive potential is also established by the findings.
Keywords:
Article :
INTRODUCTION :
Congenital melanocytic nevi (CMN) are pigmented Finger millet (Eleusine coracana L.), a pseudocereal that can withstand climate challenges, is cultivated widely across Africa and Asia, with India being one of its growing regions. In these regions, it is essential to guaranteeing food and nutritional security. Besides its excellent macronutrient composition, finger millet is abundant in phytochemicals associated with anti-inflammatory, anti-cancer, antioxidant, and antimicrobial effects, such as alkaloids, glycosides, tannins, flavonoids, and saponins (Owheruo et al. 2019; Pandey et al. 2023). Previous studies have highlighted the nutritional and pharmacological benefits of finger millet (Devi et al. 2014; Kalsi and Sharma, 2023). However, there is limited knowledge regarding the quantitative differences in phytochemicals among specific Indian varieties, particularly those cultivated under Uttarakhand's unique agro-climatic conditions. The identification of cultivars with exceptional nutraceutical potential and the direction of their application in functional food formulations and herbal medicine depend on the precise quantification of these bioactive compounds. For this kind of analysis, spectrophotometric assays offer a dependable and repeatable method that makes it possible to compare several compounds using common calibration curves (Rani et al, 2024).
Therefore, comparing and quantifying the phytochemical makeup of eight finger millet cultivars from Uttarakhand was the specific objective of this work. In order to establish a scientific foundation for varietal selection in plant-based therapies, crop improvement initiatives, and nutraceutical development, the study will identify cultivars that possess greater concentrations of important bioactive compounds.
Material And Methods:
Study area
The study was conducted at SGRR University’s Department of Seed Science and Technology, which is part of the School of Agricultural Sciences. It focused on a region located at approximately 30.305262° N, 78.030803° E in Patel Nagar, Dehradun, Uttarakhand, India (postal code: 248001).
Sample Preparation
Depending on the kind of molecule, standard solutions of phytochemicals were made at concentrations between 20 and 100 mg/µg.The following Finger millet varieties’ phytochemicals were analysed:
Varieties and Phytochemicals Analysed:
|
S. No. |
Varieties |
Symbol Used |
|
1. |
PRM 1 |
V1 |
|
2. |
PRM 2 |
V2 |
|
3. |
VL 352 |
V3 |
|
4. |
GPU 48 |
V4 |
|
5. |
Nainital |
V5 |
|
6. |
Kanatal |
V6 |
|
7. |
Gopeshwar |
V7 |
|
8. |
Barkot |
V8 |
Phytochemicals Analysed:
- Tannins– Measured at 760 nm
- Flavonoids– Measured at 510 nm
- Steroids– Measured at 780 nm
- Saponin – Measured at 430 nm
- Glycosides – Measured at 495 nm
Statistical Methodology
Spectrophotometric quantification was carried out by dissolving each compound in appropriate solvent systems. Absorbance was recorded using a UV-V is spectrophotometer at respective λ max values. Plotting concentration versus absorbance allowed for the construction of calibration curves.
Calibration Curve: y = 0.0135x – 0.749
Here:
• y = absorbance measured by the spectrophotometer
• x = concentration of the compound (mg or µg/mL, depending on the units used)
• 0.0135 = the line’s slope, indicating the change in absorbance for each unit of concentration
• -0.749 = y-intercept, which indicates the absorbance value at a concentration of zero
Experimental Procedure
i. Assessment of Flavonoid content
Standards of quercetin (20–100 µg/ml) were prepared. After mixing 1 ml of the sample/standard with 1 ml of a 2% AlCl₃ solution in methanol, the mixture was incubated for 10 minutes. Absorbance measurements were taken at a wavelength of 510 nm. Subsequent to calibration, TFC was determined using the formula (C×V)/(m) and expressed in mg QE/g.
ii. Assessment of Saponin content
Standards of diosgenin (20–100 µg/ml) were made in methanol. Vanillin acetic acid reagent (8%) and perchloric acid were combined with one illilitre of the sample or standard. After 15 minutes of incubation at 60 °C, the mixture was cooled and diluted with acetic acid. At 430 nm, absorbance was measured. A diosgenin calibration curve was created, and the total saponin content was measured as mg diosgenin equivalents (DE)/g extract.
iii. Assessment of Tannin content
Distilled water was used to create tannic acid standards (20–100 µg/ml). One illilitre of Folin Ciocalteu reagent (diluted 1:10 with water) was combined with one illilitre of sample or standard. Two illilitre of a 7.5% Na2CO3 solution were added after five minutes. The mixture’s absorbance at 760 nm was measured after 30 minutes of room temperature incubation. Tannic acid was used to generate a calibration curve, and milligrams of tannic acid equivalents (TAE) per gram of extract were used to indicate the total tannin concentration.
iv. Assessment of Steroids content
Diosgenin standards (20–100 µg/ml) were prepared in methanol. One illilitre of the standard or sample was mixed with one illilitre of acetic anhydride and one illilitre of chloroform. Carefully, 1 milliliter of strong illilitr acid was added. The mixture was incubated for half an hour at room temperature. Measurements of absorbance were made at 780 nm. The total steroid concentration was expressed as mg of diosgenin equivalents (DE) per gram of extract after a calibration curve was created using diosgenin.
v. Assessment of Glycoside content
Securidaside standards (20–100 µg/ml) were created using methanol. A One illilitre of the sample/standard, one illilitre of glacial acetic acid, and one illilitre of a 2% FeCl₃ solution were mixed together. After ten minutes of heating to 70 °C, the mixture was left to cool to room temperature. At 495 nm, the absorbance measurement was made.A calibration curve for securidaside was created, with the total glycoside content represented as mg securidaside equivalents (SE)/g extract.
2.7 Graph preparation formula
A calibration curve was created using standards, and the total phytochemical content was reported as mg equivalents (DE/TAE/SE)/g extract.
Formula: Flavonoids/Saponin/tannin/Steroids/Glycosides (mg/g) = C×V
M
Where:
• C = concentration as determined from the calibration curve (µg/mL)
• V = extract volume (in mL)
• M = mass of the sample (g)
Results & Discussion::
The current study offers a thorough quantitative analysis of several seed samples' main phytochemicals, including tannins, flavonoids, steroids, saponins, and glycosides. Using spectrophotometric techniques and standard calibration curves, we determined the content of these bioactive compounds, which are well-known for their antibacterial, antioxidant, and therapeutic properties.
Tannin:
Finger millet genotypes' tannin content was calculated using spectrophotometry at 760 nm. The method's dependability for quantification was confirmed by the calibration curve, which showed a linear relationship between concentration and absorbance using standard tannic acid concentrations (20–100 μg/ml) (Table 2; Fig. 1).
The eight kinds' corrected tannin values ranged from 0.1703 to 0.1829 mg/g, with very little variation (see Table 1). V3 (0.1703 mg/g) and V2 (0.1752 mg/g) had the lowest tannin concentration. On the other hand, V4 (0.1821 mg/g), V5 (0.1818 mg/g), and V6 (0.1829 mg/g) showed greater values. V7 (0.1800 mg/g), V8 (0.1799 mg/g), and V1 (0.1814 mg/g).These findings suggest that there aren't many genotypic variations in tannin accumulation because the tannin content of the varieties under study was comparatively constant with only slight variation.
Table 1. Tannin Content
|
Sample |
Read 1 |
Read 2 |
Average Absorbance |
Estimated Concentration (μg /ml) |
Dilution Factor |
Corrected mg/g |
|
|
V1 |
0.5358 |
0.5406 |
0.5382 |
45.44 |
4 |
0.1814 |
|
|
V2 |
0.5003 |
0.5344 |
0.5174 |
43.85 |
4 |
0.1752 |
|
|
V3 |
0.4760 |
0.5254 |
0.5007 |
42.74 |
4 |
0.1703 |
|
|
V4 |
0.5395 |
0.5419 |
0.5407 |
45.76 |
4 |
0.1821 |
|
|
V5 |
0.5407 |
0.5385 |
0.5396 |
45.48 |
4 |
0.1818 |
|
|
V6 |
0.5476 |
0.5390 |
0.5433 |
45.74 |
4 |
0.1829 |
|
|
V7 |
0.5312 |
0.5357 |
0.5335 |
45.14 |
4 |
0.1800 |
|
|
V8 |
0.5220 |
0.5443 |
0.5332 |
45.12 |
4 |
0.1799 |
|
Table 2. Tannin Concentration
|
S. No |
Concentration (Tannins A) |
Wavelength(760nm) |
|
1 |
20 μg |
0.1932 |
|
2 |
40 μg |
0.4596 |
|
3 |
60 μg |
0.7392 |
|
4 |
80 μg |
1.0301 |
|
5 |
100 μg |
1.2603 |
Regression Line Equation:
Y = 0.0135X – 0.0749
Here:
Y = Absorbance
X = X is the tannin concentration in milligrams.
Coefficient of Determination: R2 = 0.9988
Regression Equation:
Concentration = (Absorbance + 0.0749)/0.0135
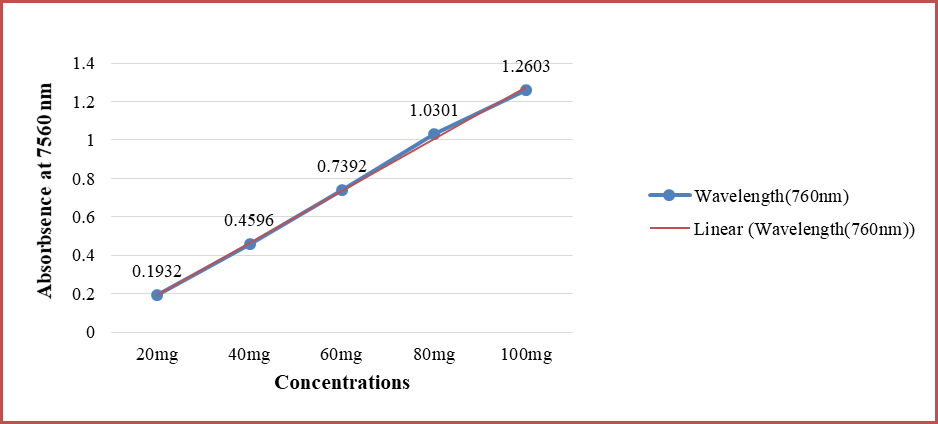
Fig 1. calibration graph of Tannin A content
Tannins are polyphenolic substances with antibacterial and antioxidant properties.The calibration curve for tannins, based on tannic acid standards, showed a high coefficient of determination (R² = 0.9988). This means there is excellent linearity between absorbance and concentration. Sample V6 had the highest corrected tannin content at 0.1829 mg/gram, indicating its potential as a rich source of tannins. These results agree with earlier studies that reported significant tannin content in different plant extracts.
Flavonoids
The flavonoid content in finger millet varieties was measured at 510 nm. A robust linear connection between concentration and absorbance was shown by the calibration curve made from standard flavonoid concentrations (20–100 μg/ml) (Table 4, Fig. 2). This confirmed the reliability of the estimation. Among the genotypes, the flavonoid content varied more widely than that of tannins, ranging from 0.2163 to 0.4411 mg/g (Table 3). The highest flavonoid concentration was found in V2 at 0.4411 mg/g, which was almost double the lowest value seen in V1 at 0.2163 mg/g. V5 (0.2537 mg/g), V7 (0.2489 mg/g), V8 (0.2460 mg/g), and V6 (0.2396 mg/g) showed moderate levels, whereas V3 (0.2295 mg/g) and V4 (0.2283 mg/g) had lower concentrations in comparison. Overall, the results show that flavonoid content had more variation between genotypes. V2 stood out as the variety with the highest flavonoid levels among those tested.
Table 3. Flavonoids Content
|
SAMPLE |
READ 1 |
READ 2 |
AVERAGE ABSORBANCE |
FLAVONOID CONCENTERATION (μg/ml) |
DILUTION FACTOR |
CORRECTED mg/g |
|
V1 |
0.5005 |
0.5774 |
0.5389 |
43.26 |
5 |
0.2163 |
|
V2 |
0.9455 |
0.9972 |
0.9714 |
88.22 |
5 |
0.4411 |
|
V3 |
0.5589 |
0.5689 |
0.5639 |
45.89 |
5 |
0.2295 |
|
V4 |
0.5585 |
0.5610 |
0.5598 |
45.65 |
5 |
0.2283 |
|
V5 |
0.5849 |
0.6337 |
0.6093 |
50.74 |
5 |
0.2537 |
|
V6 |
0.5680 |
0.5968 |
0.5824 |
47.91 |
5 |
0.2396 |
|
V7 |
0.5762 |
0.6248 |
0.6005 |
49.77 |
5 |
0.2489 |
|
V8 |
0.5756 |
0.6148 |
0.5952 |
49.20 |
5 |
0.2460 |
Table: 4 Flavonoids Concentration
|
S.NO |
CONCENTRATION |
WAVELENGTH (510nm) |
|
1 |
20 μg |
0.2997 |
|
2 |
40 μg |
0.4469 |
|
3 |
60 μg |
0.6248 |
|
4 |
80 μg |
0.8818 |
|
5 |
100 μg |
1.0155 |
Regression Line Equation
Y = 0.0095 X + 0.1273
Y = Absorbance
X = Concentration of Flavonoid in μg
Coefficient of Determination
R2 = 0.9960 Regression equation
Concentration = (Absorbance - 0.1273)/0.0095
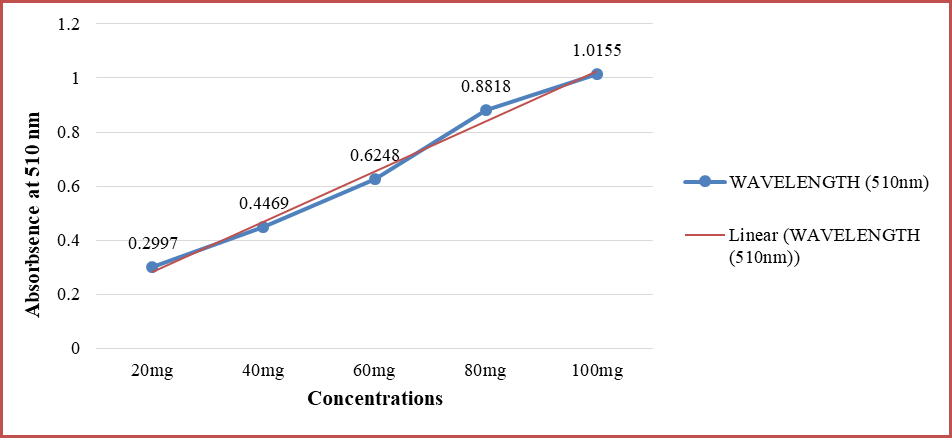
Fig 2. Content calibration graph of Flavonoids A
Flavonoids, recognized for their antioxidant and anti-inflammatory qualities, were measured using a calibration curve based on quercetin standards. The equation Y = 0.0095X + 0.1273 gave an R² of 0.9960, which shows the method is reliable. Sample V2 had the highest corrected flavonoid content at 0.4411 mg/gram. This matches findings by Hayat et al. (2020), who noted different flavonoid concentrations in various plant extracts.
Steroids
Using a spectrophotometer set to 780 nm, the steroid levels in different varieties of finger millet were assessed. With steroid concentrations ranging from 20 to 100 μg/ml, the standard calibration curve showed a clear increase in absorbance with concentration (Table 6; Fig. 3). This confirms the reliability of the quantification. Among the genotypes, the corrected steroid content varied significantly, ranging from 0.1026 to 0.2292 mg/g (Table 5). The highest concentration was found in V6, at 0.2292 mg/g, closely followed by V5 at 0.2063 mg/g. V8 (0.1539 mg/g), V2 (0.1478 mg/g), V7 (0.1476 mg/g), and V3 (0.1417 mg/g) recorded moderate levels.The lowest steroid content was found in V4 at 0.1026 mg/g. V1 also showed a relatively low value at 0.1265 mg/g. These findings suggest that there is a significant difference in steroid accumulation among the genotypes. V6 and V5 are the richest sources, while V4 is the poorest of the varieties studied.
Table 5. Steroids Content
|
SAMPLE |
READ 1 |
READ 2 |
AVERAGE ABSORBANCE |
STEROID ESTIMATED CONCENTERATION (μg/ml) |
DILUTION FACTOR |
CORRECTED mg/g |
|
V1 |
0.5987 |
0.5805 |
0.5896 |
31.62 |
4 |
0.1265 |
|
V2 |
0.6790 |
0.6617 |
0.6704 |
36.96 |
4 |
0.1478 |
|
V3 |
0.6540 |
0.6402 |
0.6471 |
35.42 |
4 |
0.1417 |
|
V4 |
0.4991 |
0.5000 |
0.4996 |
25.65 |
4 |
0.1026 |
|
V5 |
0.9950 |
0.8471 |
0.8911 |
51.58 |
4 |
0.2063 |
|
V6 |
0.9833 |
0.9664 |
0.9773 |
57.29 |
4 |
0.2292 |
|
V7 |
0.6661 |
0.6729 |
0.6695 |
36.91 |
4 |
0.1476 |
|
V8 |
0.6813 |
0.7048 |
0.6930 |
38.47 |
4 |
0.1539 |
Table 6: Steroid Concentration
|
S.NO |
CONCENTRATION (Steroids) |
WAVELENGTH (780nm) |
|
1 |
20 μg |
0.3907 |
|
2 |
40 μg |
0.7492 |
|
3 |
60 μg |
0.9923 |
|
4 |
80 μg |
1.357 |
|
5 |
100 μg |
1.5943 |
Regression Line Equation
Y = 0.0151 X + 0.1122
Y = Absorbance
X = Steroid Concentration in
Coefficient of Determination
R2 = 0.9951
Regression equation
Concentration = (Absorbance - 0.1122)/0.0151
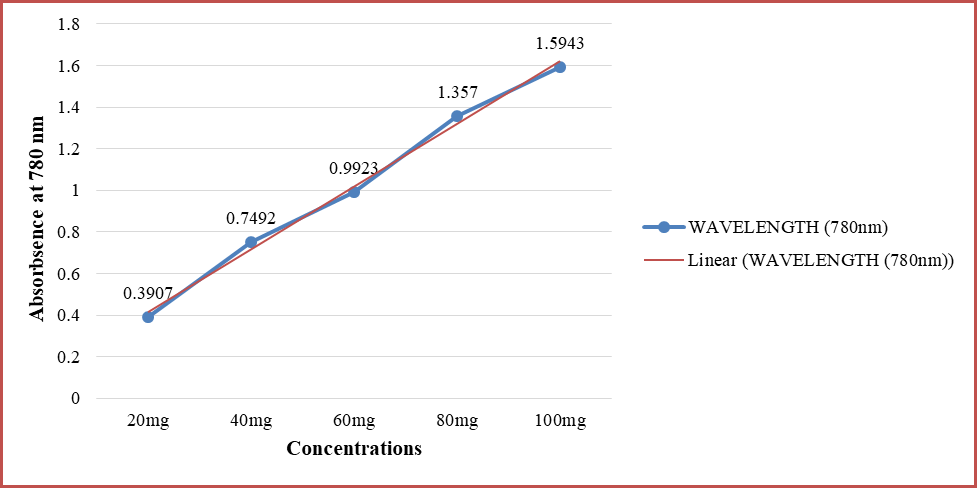
Fig 3. Content calibration graph of Steroid A
Steroids are important for many biological processes and medical uses. The calibration curve for steroids, based on diosgenin standards, showed a straight-line relationship with an R² of 0.9951. Sample V6 had the highest corrected steroid content at 0.2292 mg per gram. These findings match studies that report significant steroid content in plant extracts.
Saponin
Finger millet types' saponin content was tested at 430 nm. A linear relationship between concentration and absorbance was demonstrated by the standard curve made using varying saponin concentrations (20–100 μg/ml) (Table 8; Fig. 4). This indicates that the method is reliable. The corrected saponin content varied among the genotypes, ranging from 0.1676 to 0.1803 mg/g (Table 7). V7 exhibited the highest concentration at 0.1803 mg/g, with V6 at 0.1783 mg/g and V4 at 0.1782 mg/g coming in close behind. Values of moderate magnitude were detected in V3 (0.1752 mg/g) and V8 (0.1754 mg/g). Levels detected in V2 (0.1684 mg/g), V5 (0.1683 mg/g), and V1 (0.1676 mg/g) were comparatively lower. Overall, the saponin levels exhibited limited variation among the tested varieties. There were only minor differences between the genotypes. V7 stood out as the highest in saponin levels.
Table 7. Saponin Content
|
SAMPLE |
READ 1 |
READ 2 |
AVERAGE ABSORBANCE |
SAPONINS (μg/ml) |
DILUTION FACTOR |
CORRECTED mg/g |
|
V1 |
0.3705 |
0.3680 |
0.3692 |
83.81 |
2 |
0.1676 |
|
V2 |
0.3661 |
0.3751 |
0.3706 |
84.20 |
2 |
0.1684 |
|
V3 |
0.3802 |
0.3848 |
0.3825 |
87.61 |
2 |
0.1752 |
|
V4 |
0.3869 |
0.3889 |
0.3879 |
89.14 |
2 |
0.1782 |
|
V5 |
0.3740 |
0.3671 |
0.3706 |
84.19 |
2 |
0.1683 |
|
V6 |
0.3914 |
0.3845 |
0.3880 |
89.16 |
2 |
0.1783 |
|
V7 |
0.3960 |
0.3872 |
0.3916 |
90.19 |
2 |
0.1803 |
|
V8 |
0.3792 |
0.3865 |
0.3829 |
87.70 |
2 |
0.1754 |
Table 8: Saponin Concentration
|
S.NO |
Concentration |
Wavelength (430nm) |
|
1 |
20 µg |
0.1359 |
|
2 |
40 µg |
0.2278 |
|
3 |
60 µg |
0.2994 |
|
4 |
80 µg |
0.3514 |
|
5 |
100 µg |
0.4287 |
Regression Line Equation
Y = 0.0035 X + 0.0759
Y = Absorbance
X = Concentration of Saponin in ug
Coefficient of Determination
R2 = 0.9920
Regression equation
Concentration = (Absorbance - 0.0759) /0.0035
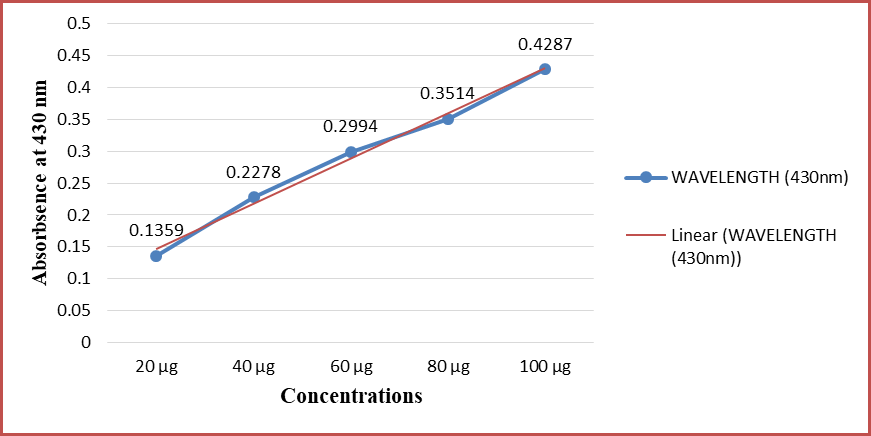
Fig 4. Content calibration graph of Saponin
Saponins have significant foaming properties and biological activities. The calibration curve for saponins, based on diosgenin standards, showed strong linearity with an R² of 0.9920. Sample V7 had the highest corrected saponin content at 0.1803 mg/gram. This is in line with the findings of Dikamu et al. (2025), who found that different seed extracts had variable saponin levels.
Glycoside
The calibration curve derived from standard glycoside concentrations (20–100 μg/ml) demonstrated a distinct linear relationship between absorbance and concentration (Table 10; Fig. 5), thereby confirming the assay's reliability. As shown in Table 9, the corrected glycoside content differed considerably across varieties, with values between 0.2049 and 0.3990 mg/g. The maximum value was recorded in V6 (0.3990 mg/g), with V5 coming next (0.3640 mg/g). V4 registered the lowest value at 0.2049 mg/g. V8 (0.2835 mg/g), V2 (0.2743 mg/g), V7 (0.2739 mg/g) und V3 (0.2648 mg/g) while V1 (0.2414 mg/g) also remained on the lower side. These results show that glycoside content had the most variation among the phytochemicals studied. V6 was the richest source, while V4 was the poorest.
Table 9. Glycoside Content
|
SAMPLE |
READ-1 OD |
READ-2 OD |
AVG OD |
GLYCOSIDE (μg/ml) |
DILUTION FACTOR |
CORRECTED mg/g |
|
V₁ |
0.5776 |
0.6016 |
0.5896 |
60.36 |
4 |
0.2414 |
|
V₂ |
0.6568 |
0.6840 |
0.6704 |
68.57 |
4 |
0.2743 |
|
V₃ |
0.6310 |
0.6632 |
0.6471 |
66.21 |
4 |
0.2648 |
|
V₄ |
0.4865 |
0.5127 |
0.4996 |
51.22 |
4 |
0.2049 |
|
V₅ |
0.8732 |
0.9090 |
0.8911 |
91.00 |
4 |
0.3640 |
|
V₆ |
0.9571 |
0.9975 |
0.9773 |
99.76 |
4 |
0.3990 |
|
V₇ |
0.6548 |
0.6842 |
0.6695 |
68.48 |
4 |
0.2739 |
|
V₈ |
0.6784 |
0.7076 |
0.6930 |
70.874 |
4 |
0.2835 |
Table 10: Glycoside Concentration
|
S.NO |
CONCENTRATION (Glycoside) |
WAVELENGTH (495nm) |
|
1 |
20 µg |
0.1914 |
|
2 |
40 µg |
0.3865 |
|
3 |
60 µg |
0.5736 |
|
4 |
80 µg |
0.8198 |
|
5 |
100 µg |
0.9588 |
Regression Line Equation
y = 0.0098x - 0.0044
• y = absorbance
• x = concentration in μg
• R² = 0.9950 (indicating excellent linearity)
Concentration = (Absorbance - 0.0044)/0.0098
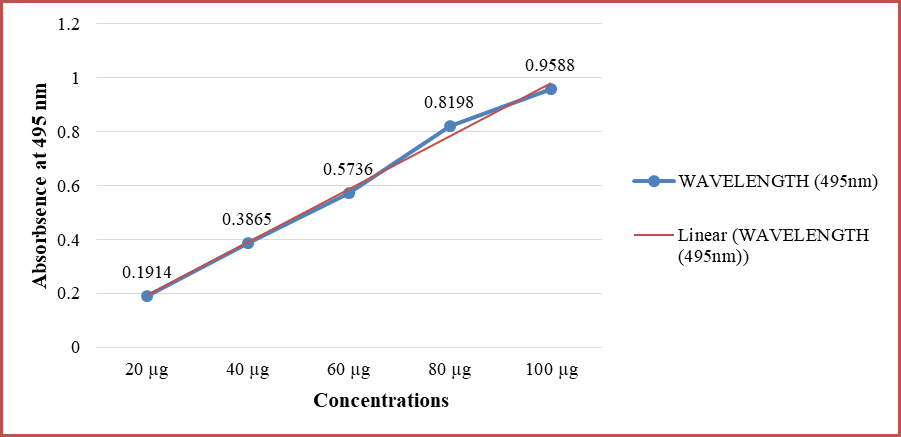
Fig 8. Content calibration graph of Glycoside
Glycosides are important due to their drug effects and medical uses. The calibration curve for glycosides, based on standard compounds, showed a strong linear relationship with an R² of 0.9950. Sample V6 had the highest corrected glycoside content at 0.3990 mg/gram. These results confirm previous studies that highlight the presence of glycosides in different seed species.
CONCLUSION :
The current study focuses on the variety of phytochemicals found in eight finger millet (Eleusine coracana L.) varieties. It specifically emphasizes tannins, flavonoids, steroids, saponins, and glycosides, which were measured using spectrophotometric methods. The results showed clear differences among the varieties. V6 was notable for being the most abundant source of glycosides (0.3990 mg/g), steroids (0.2292 mg/g), and tannins (0.1829 mg/g).In contrast, V2 had the highest concentration of flavonoids (0.4411 mg/g). Saponin levels were fairly consistent across the samples, with V7 having a slight edge. These variations likely arise from genetic factors, environmental conditions, and how the plants regulate their metabolism to produce secondary metabolites. The findings highlight the nutritional and therapeutic value of finger millet, especially V2 and V6, as good options for creating functional foods, nutraceuticals, and plant-based
medicines. Their rich phytochemical profiles suggest potential uses in preventing oxidative stress, inflammation, infections, and lifestyle-related health issues. Additionally, the strong correlation of the calibration curves (R² > 0.99) confirms the reliability and consistency of the spectrophotometric methods used. Overall, this research lays the groundwork for selecting specific varieties in breeding programs and for developing value-added products, while also opening doors for future studies into the bioactive properties of finger millet.
Acknowledgment
This research was supported by a grant from the School of Agricultural Sciences, Department of Seed Science and Technology, SGRR University, Patel Nagar, Dehradun, Uttarakhand, 248001, India, and TaqGene Training & Research Institute (TGTRi) in Dehradun, Uttarakhand.
Conflicts of Interest
The authors state that they have no conflict of interest.
Ethical Clearance
Not applicable for this study.
Financial Grant
This research was supported by the author’s personal financial contribution.
Declaration
This manuscript was prepared with help from Grammarly to improve language and correct grammar only. All content has been reviewed and approved by the authors.
BIBLIOGRAPHY:
1) Abioye, V. F., & Oluwole, O. A. (2022). Varietal and processing influences on nutritional and phytochemical characteristics of finger millet. Journal of Cereal Science, 99, 103242. https://doi.org/10.1016/j.jcs.2022.103242.
2) AOAC International. (2016). Official Methods of Analysis (20th ed.). AOAC. (Standard reference for proximate and phytochemical analytical procedures). Retrieved from https://www.aoac.org/official-methods-of-analysis/?utm
3) Bhatt, D. (2019). Screening and biological activities of various bioactive compounds in finger millet [Eleusine coracana (L.) Gaertn.] genotypes collected from various hilly regions of Uttarakhand (Master’s thesis, G.B. Pant University of Agriculture and Technology, Pantnagar, Uttarakhand). KrishiKosh. https://krishikosh.egranth.ac.in/items/340cedd6-0457-4a06-86be-ae77b6c50fca.
4) Bhosle, P. (2024). A review of India’s nutritional powerhouses: millets, composition and health implications. Preprints. https://doi.org/10.20944/preprints202401.0253.v1.
5) Brand-Williams, W., Cuvelier, M. E., & Berset, C. (1995). Use of a free radical method to evaluate antioxidant activity. LWT — Food Science and Technology, 28(1), 25–30. https://doi.org/10.1016/S0023-6438(95)80008-5.
6) Chandna, R., & Nand, R. (2016). Mineral composition and antinutritional factors of Indian finger millet cultivars. Indian Journal of Agricultural Biochemistry, 29(1), 19–27.
7) Chandra, S., & Shahidi, F. (2016). Phenolic chemistry and antioxidant capacities in millets: a comparative study. Journal of Food Science and Technology, 53(6), 2806–2818.
8) Chandrasekara, A., & Shahidi, F. (2012). Content of insoluble-bound phenolics in cereal grains and their contribution to antioxidant capacity. Journal of Agricultural and Food Chemistry, 60(23), 5954–5960. https://doi.org/10.1021/jf300157h.
9) Chang, C., Yang, M., Wen, H., & Chern, J. (2002). Estimation of total flavonoid content in propolis by two complementary colorimetric methods. Journal of Food and Drug Analysis, 10(3), 178–182.
10) Chaudhary, A., Martolia, J., & Painuly, N. (2024). Phytochemical evaluation of Eleusine coracana extract for its antimicrobial activity. Educational Administration: Theory and Practice, 30(6), 3245–3252.
11) Chauhan, A., & Lohani, P. (2022). Characterization of physiological and biochemical response during drought stress in finger millet collected from hills of Uttarakhand. Current Journal of Applied Science and Technology, 41(30), 22–33. https://doi.org/10.9734/cjast/2022/v41i3031802
12) Devi, P. B., Vijayabharathi, R., Sathyabama, S., Malleshi, N. G., & Priyadarisini, V. B. (2014). Health benefits of finger millet (Eleusine coracana L.) polyphenols and dietary fibre: A review. Journal of Food Science and Technology, 51(12), 3653–3665. https://doi.org/10.1007/s13197-012-0897-7.
13) Dikamu, M., Ezez, D., Birhanu, H., & Mamo, A. (2025). Analysis of phytochemical constituents using GC–MS, evaluation of antioxidants and antibacterial activities of Maerua oblongifolia root bark extracts. Applied Sciences, 7, 417.
14) FAO. (2018). The Contribution of Millets to Sustainable Food Systems and Nutrition. Food and Agriculture Organization of the United Nations. (Background on millets and nutritional relevance). Retrieved from https://www.fao.org/fileadmin/user_upload/bodies/CL_160/MY336_13/MY336_CL_160_13_Rev1_en.pdf?utm
15) Gupta, A., & Pandey, R. (2009). On-farm evaluation of finger millet varieties in hill environments. Tropical Agriculture Research and Extension, 12(4), 1–10. (Regional varietal evaluation).
16) Harborne, J. B. (1998). Phytochemical methods: A guide to modern techniques of plant analysis. Springer Science and Business Media, 978-0-412-57260-9.
17) Hayat, J. (2020). Phytochemical screening, polyphenols, flavonoids and antioxidant activities of Oulad Daoud Zkhanin. PMC, 6(11), https://doi.org/10.1016/j.heliyon.2020.e05609.
18) Hithamani, G., & Srinivasan, K. (2014). Effect of domestic processing on the polyphenol content and bioaccessibility in finger millet (Eleusine coracana) and pearl millet (Pennisetum glaucum). Food Chemistry, 164, 55–62. https://doi.org/10.1016/j.foodchem.2014.04.007.
19) Jeena, A. S., Chaudhary, D., & Rohit, R. (2022). Revealing genetic diversity in finger millet (Eleusine coracana L. Gaertn.) germplasm collected from Uttarakhand hills. Electronic Journal of Plant Breeding, 13(2), 633–642. https://doi.org/10.37992/2022.1302.079.
20) Joshi, D., Bhatt, J. C., Hooda, K. S., & Gupta, A. (2012). Management of finger millet (Eleusine coracana) blast under field conditions by plant extracts. The Indian Journal of Agricultural Sciences, 82(3), 263–266.
21) Kalsi, R., & Sharma, A. (2023). Exploration of nutritional, pharmacological and therapeutic properties of Eleusine coracana: a review. Journal of Medicinal Plants Research, 17(8), 345–360.
22) Kaur, S., Singh, R., & Kaur, H. (2024). Finger millet (Eleusine coracana L.): agronomy, nutritional attributes and potential applications — a review. Journal of Cereal Science and Nutrition, 14(2), 87–102. (Review).
23) Krishikosh Repository. (n.d.). Phytochemical analysis and biological screening of finger millet (Eleusine coracana L.) seeds — M.Phil./Ph.D. thesis (India). KrishiKosh, Indian Agricultural Research Repository. Retrieved from https://krishikosh.egranth.ac.in.
24) Kumar, A., Paliwal, A., Rawat, L., Kumar, P., & Chaudhary, S. (2019). Performance of high yielding varieties of finger millet (Eleusine coracana) under different fertility levels in Garhwal region of Uttarakhand. Journal of Pharmacognosy and Phytochemistry, 8(2), 1260–1261.
25) Kumar, A., Paliwal, A., Rawat, L., Kumar, P., & Chaudhary, S. (2019). Performance of high yielding varieties of finger millet (Eleusine coracana) under different fertility levels in Garhwal region of Uttarakhand. Journal of Pharmacognosy and Phytochemistry, 8(2), 377–380.
26) Kumar, A., Paliwal, A., Singh, S. B., Sukanya, T. S., & Kishore, A. (2022). Productivity and economics of intercropping of finger millet (Eleusine coracana) and amaranth (Amaranthus spp.) in rainfed hills of Uttarakhand. International Journal of Bio-resource and Stress Management, 13(3), 327–332.
27) Nakarani, U. M., Kaul, A., & Bhandari, A. (2021). Nutritional and phytochemical profiling of nutracereal finger millet genotypes. Food Chemistry, 345, 128688. https://doi.org/10.1016/j.foodchem.2020.128688.
28) Navyashree, N., & Srinivasan, K. (2022). White finger millet (KMR-340) — comparative phytochemical study. Food Chemistry, 375, 131861. https://doi.org/10.1016/j.foodchem.2021.131861.
29) Nyaradi, A., Vittal, R., & Radhakrishnan, S. (2017). Effects of agronomy and environment on phytochemical profiles of finger millet: a meta-analysis. Plant Foods for Human Nutrition, 72(3), 197–206.
30) Ofosu, F. K., & Addo, M. (2020). Bioactivity-guided isolation of antioxidants from finger millet: implications for diabetes and cardiovascular health. Journal of Functional Foods, 64, 103666. https://doi.org/10.1016/j.jff.2019.103666.
31) Ofosu, F. K., Ayernor, G. S., & Simpson, B. J. (2020). Phenolic profile, antioxidant, and antidiabetic potential of finger millet extracts. Antioxidants, 9(9), 761. https://doi.org/10.3390/antiox9090761.
32) Ojha, I., & Singh, P. (2024). Identification of blast-resistant finger millet accessions: implications for stable phytochemical production. Crop Protection, 170, 106011. https://doi.org/10.1016/j.cropro.2024.106011.
33) Owheruo, J. O., Ifesan, B. O. T., & Kolawole, A. O. (2019). Physicochemical properties of malted finger millet (Eleusine coracana) and pearl millet (Pennisetum glaucum). Food Science and Nutrition, 7(2), 476–482.
34) Pandey, K. B., & Rizvi, S. I. (2009). Plant polyphenols as dietary antioxidants in human health and disease. Oxidative Medicine and Cellular Longevity, 2(5), 270–278. https://doi.org/10.4161/oxim.2.5.9498.
35) Pandey, S. N., Kaur, G., & Yadav, S. K. (2023). Phytochemical evaluation of Eleusine coracana extract and its antimicrobial potential. KUEY Journal of Science and Technology, 30(6), 5719–5729.
36) Rani, R., Rani, M., & Rani, S. (2024). Nurturing health through millet-derived nutraceuticals. Journal of Functional Foods, 12(3), 45–59.
37) Re, R., Pellegrini, N., Proteggente, A., Pannala, A., Yang, M., & Rice-Evans, C. (1999). Antioxidant activity applying an improved ABTS radical cation decolorization assay. Free Radical Biology and Medicine, 26(9–10), 1231–1237. https://doi.org/10.1016/S0891-5849(98)00315-3
38) Sharma, N., Bandyopadhyay, B. B., Chand, S., Pandey, P. K., Baskheti, D. C., Malik, A., & Chaudhary, R. (2022). Determining selection criteria in finger millet (Eleusine coracana) genotypes using multivariate analysis. The Indian Journal of Agricultural Sciences, 92(6), 755–758.
39) Shobana, S., & Malleshi, N. G. (2013). Finger millet (Ragi, Eleusine coracana L.): A review of its nutritional and health benefits. Food Research International, 51(1), 1–10. https://doi.org/10.1016/j.foodres.2013.05.004.
40) Singh, J., & Joshi, A. (2024). The nutritive gems of Uttarakhand: Barnyard and finger millet. Agriculture & Food E-Newsletter, 06, 341-342.
41) Singleton, V. L., Orthofer, R., & Lamuela-Raventós, R. M. (1999). Analysis of total phenols and other oxidation substrates and antioxidants by means of Folin–Ciocalteu reagent. Methods in Enzymology, 299, 152–178. https://doi.org/10.1016/S0076-6879(99)99017-1.
42) Singleton, V. L., Orthofer, R., & Lamuela-Raventós, R. M. (1999). Analysis of total phenols and other oxidation substrates and antioxidants by means of Folin–Ciocalteu reagent. In R. L. Packer (Ed.), Methods in Enzymology, 299, 152–178.
43) Swain, T., & Hillis, W. E. (1959). The phenolic constituents of Prunus domestica. I. The quantitative analysis of phenolic constituents. Journal of the Science of Food and Agriculture, 10(1), 63–68. (Classic method reference for tannin estimation).
44) Takaidza, S. (2018). Analysis of the phytochemical contents and antioxidant activities of medicinal plants. Journal of Chinese Traditional Medicine, 38, 272-279.
45) Teklu, D., & Gebre, M. (2021). Genotype × environment interactions in millet: implications for phytochemical stability. Crop Science, 61(5), 3450–3462.
46) Teklu, D., and Wondimu, T. (2020). Influence of genotype on tannin and mineral profiles in finger millet. Frontiers in Nutrition, 7, 129. https://doi.org/10.3389/fnut.2020.00129
47) Teklu, D., Ketema, K., & Tadesse, B. (2024). Genotype effects on nutritional and anti-nutritional factors in improved finger millet varieties. Scientific Reports, 14(1), 487. https://doi.org/10.1038/s41598-024-48749-3.
48) Trease, G. E., & Evans, W. C. (2002). Pharmacognosy (16th ed.). Saunders Publishers. 978-0-7020-2933-2.
49) Vagdevi, H. S., & Rao, P. (2022). Finger millet processing and implications for nutraceutical value. International Journal of Food Science and Technology, 57(10), 4302–4314.
50) Xiang, J., & Swamy, G. (2018). Ten phenolic compounds identified in finger millet: significance for antioxidant properties. Journal of Cereal Chemistry, 95(4), 647–656.
51) Xiang, J., Xia, T., Xu, M., &Tang, W. (2019). Profile of phenolic compounds and antioxidant activity of finger millet (Eleusine coracana) varieties. Food Chemistry, 298, 125050. https://doi.org/10.1016/j.foodchem.2019.125050.