COMPARISON OF POST-OPERATIVE PULMONARY COMPLICATIONS WITH CONTINUOUS LOW TIDAL VOLUME VENTILATION VERSUS NO VENTILATION DURING CARDIOPULMONARY BYPASS SURGERY
- Anam Arshad , Cardiac perfusionist Punjab institute of cardiology, jail road Lahore.
- Bushra Begum , Col Rtd CMH Sargodha Punjab
- Aymen Nawaz , Resident Gynae/obstetrics CMH Sargodha
- Javaria Arshad , Nursing officer mayo hospital
- Muhammad Bilal Hussain , Fatima Memorial Hospital Lahore
- saleem Ahmed , Associate Professor community medicine UCMD, The University of Lahore.
Article Information:
Abstract:
Background: Postoperative pulmonary complications remain a major concern following cardiopulmonary bypass (CPB) in cardiac surgery. The role of intraoperative ventilation strategies during CPB continues to be debated, particularly the effectiveness of low tidal volume ventilation compared to no ventilation Objective: To compare postoperative pulmonary complications between continuous low tidal volume ventilation and no ventilation during CPB in patients undergoing on-pump cardiac surgery. Methods: This comparative cross-sectional study was conducted at the Punjab Institute of Cardiology, Lahore, Pakistan. A total of 70 patients undergoing elective on-pump cardiac surgery were enrolled after obtaining informed written consent. Patients were divided into two groups: those receiving continuous low tidal volume ventilation during CPB and those with no ventilation. Data were collected using a semi-structured questionnaire and analyzed using SPSS version 25. Postoperative pulmonary outcomes, including pleural effusion, atelectasis, and oxygen saturation levels, were assessed over the first three postoperative days. Results: The mean age of participants was 51.34 ± 11.54 years, with 55% males and 45% females. The incidence of pleural effusion (p = 0.016) and atelectasis (p = 0.012) was significantly higher in the no-ventilation group. Pleural effusion remained significantly elevated on the second and third postoperative days, while atelectasis was significantly more frequent on the first and second postoperative days in the non-ventilated group. Additionally, a significant improvement in oxygen saturation was observed on the second postoperative day in patients receiving low tidal volume ventilation (p = 0.039). Conclusion: Continuous low tidal volume ventilation during CPB improves postoperative oxygenation and reduces pulmonary complications compared to no ventilation. This strategy appears to be a safer and more effective approach for optimizing respiratory outcomes in patients undergoing cardiac surgery
Keywords:
Article :
INTRODUCTION:
Postoperative pulmonary complications (PPCs) are more common with increasing mortality and delayed postoperative clinical stays after cardiopulmonary bypass (CPB) surgery. The death rate related with PPCs is 10% to 20% after a major cardiovascular surgical procedure.1 currently about 25% of the patients develop postoperative respiratory complications following cardiothoracic surgical procedure. The phrenic nerve injury occurrence can fluctuate from 1% to 60%, may influence postoperative recuperation and increment PPC occurrence by directly influencing diaphragm function.2
In 1979, Gale and coworkers indicated that atelectasis was the most recurrent complication after cardiac surgery.3 Atelectasis is observed as a primary driver of post-CPB lung injury and a connection between the level of atelectasis and intrapulmonary shunt has been accounted. Results explained that ventilation keeping air in alveoli protects pulmonary parenchyma from ischemic insult.4
Persistent ventilation with a low flow volume during CPB seems to diminish extravascular lung water and certain proinflammatory and anti-inflammatory mediator levels. Whether ventilation during CPB further develops a patient's clinical results and oxygenation status stays inexplicit.5 Most common issues of post-surgery are ventilator-acquired pneumonia (VAP) and it is considered a major cause of mortality. Occurrence of VAP mainly depends on lung breakdown and atelectasis during extracorporeal circulation responsible for reactive syndrome in and after bypass surgery. Lung complications after cardiac surgery seem to be more recurrent when no mechanical ventilation has kept during CPB.6
In cardiovascular surgery respiratory system failure (RF) is a typical problem extending worldwide rate of 20–25%. Its clinical demonstration goes from a mild respiratory failure to acute respiratory distress syndrome (ARDS) needing lengthy mechanical ventilation (MV) and intensive care unit (ICU) stay. Pulmonic dysfunction not just extended mechanical ventilation, escalated care in ICU, absolute length of hospitalization but, however, it likewise increments treatment costs.7,8
In Meta-analysis, it has been reported from trials that by applying low tidal volume, the low frequency ventilation could reduce bypass related lung injury by decreasing inflammatory reactions and some negative immune markers such as interleukin-10 and TNF-α.9 A protective strategy for ventilation, consisting of low tidal volumes and plateau pressures and application of Positive End Expiratory Pressure (PEEP) has gained widespread acceptance in ICU after large studies showed an associated reduction in morbidity and mortality in patients with acute lung injury after CPB operations.10
In Pakistan few studies have been conducted to see post-operative pulmonary complications with low tidal volume ventilation versus no ventilation and the results of these studies are not consistent. So, the present study was planned to evaluate the effect of continued lung ventilation (low frequency and low tidal volume) during cardiopulmonary bypass surgery and development of postoperative pulmonary complications in a group of patients in a tertiary care health establishment.
MATERIAL AND METHODS:
This analytical cross-sectional study was conducted in the Department of Cardiac Surgery at the Punjab Institute of Cardiology (PIC), Lahore, Pakistan. PIC is a state-run tertiary care center that receives referrals from across Punjab and other provinces for advanced cardiac care. The study was carried out over a period of nine months following approval from the Institutional Review Board of the Faculty of Allied Health Sciences, University of Lahore.
Sample Size and Sampling Technique
A total sample of 70 patients was calculated based on the expected proportion of postoperative pulmonary complications, specifically atelectasis (76% in Group A and 40% in Group B), with a power of 80%, a margin of error of 5%, and a 95% confidence level.¹¹ Patients were allocated into two groups: 35 patients receiving low tidal volume ventilation during CPB and 35 patients receiving no ventilation. A non-probability purposive sampling technique was used for participant recruitment.
Patients aged 18–70 years of either gender undergoing elective coronary artery bypass grafting (CABG) or valvular surgery were included after obtaining written informed consent.
Exclusion criteria included patients with left ventricular failure (ejection fraction ≤30%), redo or emergency surgeries, significant pulmonary disease (e.g., chronic obstructive pulmonary disease), obesity (BMI >35 kg/m²), renal impairment, and pregnancy.
Data were collected using a semi-structured questionnaire divided into two sections. The first section included socio-demographic and clinical variables such as age, gender, comorbidities, lifestyle factors, and dietary habits, obtained through patient interviews and medical records.
The second section included perioperative and postoperative clinical parameters retrieved from patient records, including arterial blood gases (ABGs), PaO₂/FiO₂ ratio, alveolar-arterial (A–a) gradient, arterial oxygen saturation, and chest X-ray findings. Postoperative pulmonary complications assessed included pleural effusion, atelectasis, and pneumonia over a follow-up period of three days.
Participants were randomly allocated into two groups using the lottery method:
Ventilation Group: Patients received low tidal volume ventilation during CPB with a tidal volume of 3–4 mL/kg, respiratory rate of 5 breaths/min, inspiratory-to-expiratory (I:E) ratio of 1:2, and positive end-expiratory pressure (PEEP) of 5 cmH₂O.
No Ventilation Group: Patients did not receive mechanical ventilation during CPB.
Baseline vital signs were recorded prior to surgery. Postoperatively, all patients were monitored in the intensive care unit (ICU) for three days to assess the development of pulmonary complications. Daily clinical parameters, including temperature, PaO₂, FiO₂, ventilation mode, arterial oxygen saturation, and hemoglobin levels, were recorded
To minimize variability, all patients were managed by the same anesthesia team, and surgical procedures were performed by the same cardiac surgeon. Data were documented using a standardized proforma.
Data were entered and analyzed using SPSS version 25.0. Quantitative variables, such as age, were expressed as mean ± standard deviation, while qualitative variables were presented as frequencies and percentages. Group comparisons were performed using the independent samples t-test for continuous variables and the Chi-square test for categorical variables. A p-value ≤0.05 was considered statistically significant.
RESULTS:
The total study population was 70 patients for cardiopulmonary bypass (CPB) operation. They were randomly divided into two groups: 35 patients in group A (Low tidal volume ventilation/ ventilation group) and 35 patients in group B (No-ventilation group).
Table 1. Descriptive statistics of age, pre-op ejection fraction, cross clamp time, and bypass time in minutes of study population. Mean and SD are shown
|
Variable |
Minimum |
Maximum |
Mean ± SD |
|
Age of patients (years) |
20 |
75 |
51.34 ± 11.546 |
|
Pre-op Ejection fraction (%) |
35 |
65 |
50.92 ± 9.510 |
|
Cross clamp time (minutes) |
14 |
90 |
49.68 ± 18.87 |
|
Bypass time (minutes) |
37 |
170 |
99.75 ± 29.32 |
Table 1 shows the average age of patients as 51.34±11.546 years. The mean pre-op ejection fraction was 50.92±9.510. Mean aortic cross clamp time was 49.68±18.87 minutes with minimum recorded time 14 minutes and maximum 90 minutes during CPB. The mean total bypass time was 99.75±29.32 minutes with minimum 37 minutes and maximum 170 minutes.
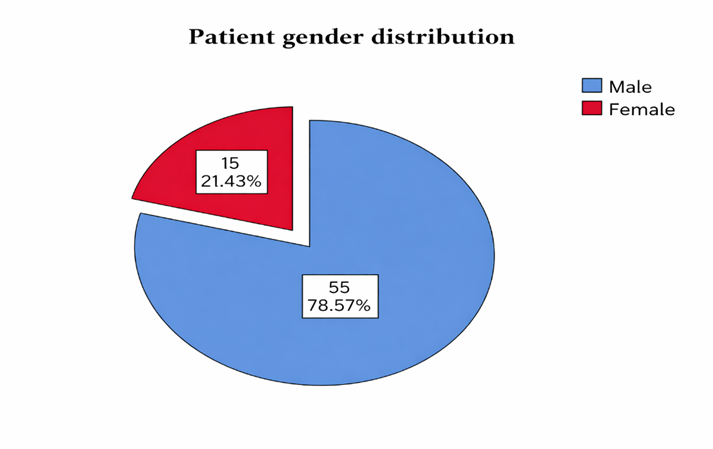
Figure 1. Gender of the patients
Figure 1 describes that the proportion of male participants was higher, 78.57% (n=55) as compared to their female counterparts, 21.43% (n=15) in the study population.
Table 2. Descriptive distribution of demographic and procedural variables of the patients. Frequencies and percentages are shown.
|
Demographic Variables |
Low Tidal Ventilation Group n (%) |
No Ventilation Group n (%) |
Total N (%) |
|
Gender of patients |
|||
|
Male |
31 (44.29) |
24 (34.29) |
55 (65.28) |
|
Female |
4 (5.71) |
11 (15.71) |
15 (21.42) |
|
Cigarette smoking |
|||
|
Yes |
11 (15.71) |
8 (11.43) |
19 (27.10) |
|
No |
24 (34.29) |
27 (38.57) |
51 (72.90) |
|
Diabetes mellitus |
|||
|
Yes |
12 (17.14) |
16 (22.86) |
28 (40.00) |
|
No |
23 (32.86) |
19 (27.14) |
42 (60.00) |
|
Hypertension |
|||
|
Yes |
17 (24.29) |
19 (27.14) |
36 (51.40) |
|
No |
18 (25.71) |
16 (22.86) |
34 (48.60) |
|
Type of procedure |
|||
|
CABG |
30 (42.86) |
31 (44.29) |
61 (87.10) |
|
MVR |
5 (7.14) |
1 (1.43) |
6 (8.60) |
|
DVR |
0 (0.00) |
3 (4.29) |
3 (4.30) |
Tables 2 reflects the descriptive distribution of demographic variables related with pattern of ventilation. Of the 19 (27.1%) patients with history of cigarette smoking 11(15.71%) received Tables 2 reflects the descriptive distribution of demographic variables related with pattern of ventilation. Of the 19 (27.1%) patients with history of cigarette smoking 11(15.71%) received low tidal ventilation while 8 (11.43%) with no ventilation. Of the 28 (40.0%) patients with diabetes mellitus 12 (17.14) were in ventilated group while 16 (22.86%) in no ventilation group. Coronary artery bypass grafting (CABG) was done in 61 (87.1%) patients from which 30 (42.86%) received low tidal ventilation during bypass procedure while 31(44.29%) with no ventilation. Double valve replacement (DVR) was done in 6(8.6%), 5 (7.14%) given low ventilation and 1 (1.43%) without.
Table 3. Descriptive distribution of different categories of clinical variables. Frequencies and percentages are indicated.
|
Clinical Variables |
Low Tidal Ventilation Group n (%) |
No Ventilation Group n (%) |
Total N (%) |
|
Total ventilation time |
|||
|
5–10 hours |
2 (5.71) |
4 (11.42) |
6 (8.57) |
|
11–15 hours |
23 (65.71) |
22 (62.85) |
45 (64.28) |
|
>16 hours |
10 (28.57) |
9 (25.71) |
19 (27.14) |
|
ICU stay |
|||
|
4–6 days |
25 (71.40) |
23 (65.70) |
48 (68.60) |
|
7–9 days |
9 (25.70) |
10 (28.60) |
19 (27.10) |
|
>9 days |
1 (2.90) |
2 (5.71) |
3 (4.30) |
|
Length of hospital stay |
|||
|
4–6 days |
11 (15.71) |
6 (8.57) |
17 (24.28) |
|
7–9 days |
19 (27.14) |
22 (31.43) |
41 (58.57) |
|
10–15 days |
5 (7.14) |
7 (10.00) |
12 (17.14) |
|
PaO₂/FiO₂ ratio after 4 hours of CPB (mmHg) |
|||
|
150–350 |
11 (31.42) |
14 (40.00) |
25 (35.71) |
|
351–550 |
24 (68.57) |
21 (60.00) |
45 (64.29) |
|
551–750 |
0 (0.00) |
0 (0.00) |
0 (0.00) |
|
A–a gradient after 4 hours of CPB (mmHg) |
|||
|
10–100 |
22 (62.86) |
21 (60.00) |
43 (61.42) |
|
101–160 |
9 (25.71) |
9 (25.71) |
18 (25.71) |
|
161–220 |
4 (11.42) |
5 (14.28) |
9 (12.85) |
|
Arterial blood oxygen saturation at post-op day 3 |
|||
|
93–95 |
1 (1.43) |
1 (1.43) |
2 (2.86) |
|
96–98 |
24 (34.29) |
32 (45.71) |
56 (80.00) |
|
99–100 |
10 (14.29) |
2 (2.86) |
12 (17.15) |
Table 3 Depicts that during 5-10 hrs of total ventilation time only 2(2.86%) patients in low ventilation and 4 (5.71%) patients were found in no ventilation group. During 11-15 hours of mechanical ventilation time 23(32.86%) patients were seen in low ventilation group while 22(31.43%) in no ventilation. More than 16 hours of ventilation, 10 (14.29%) patients with low tidal ventilation during bypass and 9 (12.86%) patients were found in no ventilation. In 10-100 mmhg A-a gradient after intubation showed 16(22.85%), in 101-160 mmhg only 11 (15.71%) and in 161-220 mmhg 8(11.43%) were observed in low tidal ventilation. On the other hand no ventilation group showed 15(21.42%) in 10-110 mmhg, 11(15.71%) in 101-160 mmhg and 9(12.85%) in 161-220 mmhg a-a gradient. Length of hospital stay during 4-6 days seen in 11(15.71%) patients in low ventilation while only 6(8.57%) in no ventilation.7-9 days of stay showed 19(27.14%), 22(31.43%) in low and no ventilation respectively.More than 9 days of hospital stay were observed in 5(7.14%) in low ventilation while 7(10.0%) patients in no ventilation.
Table 4. Bivariate analysis of development of pleural effusion and atelectasis against pattern of ventilation (low tidal ventilation vs no ventilation) value of Chi-square test and p-value are shown
|
Clinical Variable |
Low Tidal Ventilation n (%) |
No Ventilation n (%) |
Chi-square |
P-value |
|
Pleural effusion development |
||||
|
Yes |
14 (40.0) |
24 (68.6) |
5.757 |
0.016 |
|
No |
21 (60.0) |
11 (31.4) |
||
|
Pleural effusion development post-op day 1 |
||||
|
Yes |
12 (17.14) |
19 (27.14) |
2.837 |
0.092 |
|
No |
23 (32.86) |
16 (22.86) |
||
|
Pleural effusion development post-op day 2 |
||||
|
Yes |
13 (31.10) |
24 (68.6) |
6.937 |
0.008 |
|
No |
22 (62.90) |
11 (31.4) |
||
|
Pleural effusion development post-op day 3 |
||||
|
Yes |
6 (8.57) |
16 (22.86) |
6.629 |
0.010 |
|
No |
29 (41.43) |
19 (27.14) |
||
|
Atelectasis development |
||||
|
Yes |
4 (11.43) |
13 (37.14) |
6.293 |
0.012 |
|
No |
31 (88.6) |
22 (62.90) |
||
|
Atelectasis development post-op day 1 |
||||
|
Yes |
4 (11.43) |
13 (18.57) |
6.293 |
0.012 |
|
No |
31 (44.29) |
22 (31.43) |
||
|
Atelectasis development post-op day 2 |
||||
|
Yes |
5 (14.31) |
12 (34.20) |
3.807 |
0.051 |
|
No |
30 (85.70) |
23 (65.71) |
||
|
Atelectasis development post-op day 3 |
||||
|
Yes |
2 (2.86) |
4 (5.71) |
0.729 |
0.393 |
|
No |
33 (47.14) |
31 (44.29) |
Association of developing pleural effusion in no ventilation group as compared to low tidal ventilation group. Out of 38 patients 14(40.0%) developed pleural effusion with low tidal ventilation while 24(68.6%) developed with no ventilation group (Chi-square = 5.757, P-value: 0.016). In low tidal ventilation group significantly, less number of patients, i.e. 13(31.10%) developed pleural effusion at second post-operative day in ICU as compared to no ventilation group where 24(68.6%) showed this disease (Chi-square =6.937, P-value=0.008). Similar results were found for day 3 (Chi-square=6.629, P-value: 0.010) for the development of pleural effusion in two groups studied.
A significant association was observed between atelectasis development with no ventilation (Chi-square =6.293, P-value = 0.012). In low tidal ventilation group a smaller number of patients, i.e. only four (11.43%) developed atelectasis at first post-operative day in ICU as compared to no ventilation group where 13 (18.57%) showed this disease (Chi-square =6.293, P-value=0.012).
DISCUSSION :
This is one of the few studies conducted to compare the pulmonary complications in non-ventilated and low tidal ventilated patients during cardiopulmonary bypass surgery. Although the sample size was small and duration of study was short, but the results are valid and quite comparable with other national and international studies.
The present study showed that the average age of patients was 51.34±11.546 years. The average age of ventilated patients was 49.285±12.162 years and non-ventilated group 53.40±10.674 years. Higher mean age has been reported by Davoudi et al. from Iran, i.e. 59.8±12.2 years in ventilated group and 57.4±14.4 years in non-ventilated group.12 In another study completed by Al Jaaly et al. in the UK showed even higher mean age of participants as 65.39±12.9 years in low tidal volume group and 62.86±10.08 years in conventional management group during CPB.13 This difference is most probably due to higher population age presentation with cardiac disease in Iran and even more advance in the UK.12 Or it may be due to higher average population ages in Iran and UK.13
The present study presented the gender difference as males 78.57% and females 21.43%. This result is consistent with another study conducted by Naveed et al. at Multan, Pakistan, showing percentage of males 76.59% and females 23.4% during cardiopulmonary bypass operation.15 This gender difference highlights more incidences of cardiac diseases among males than females as shown in some other studies.14, 15
The current study showed significant development of pleural effusion and atelectasis without ventilation group with p-value=0.016 and 0.012 respectively. Another study of similar design conducted by Zamani et al. in Iran revealed that the amount for positive post-op pulmonary complications were less in lung protective ventilation group, (two cases in ventilated group versus nine cases in conventional group developed lung complications, P-value=0.02).16
Although the present study showed a significant development of pleural effusion and atelectasis complications with no ventilation during bypass surgery. While in another study by Furqan et al. the frequency of development of lung atelectasis among non-ventilation group was significantly higher against ventilated group.11 In contrast, there was another study by Ahmed et al. found insignificant difference of occurrence of pulmonic atelectasis, edema and pleural effusion between groups of ventilation and no ventilation.21
The current research demonstrates a reduction in the post-operative pulmonary dysfunction with low tidal ventilation strategy. The results are consistent with another study of similar nature performed by Wrigge et al. in 2005 which determined the effects of ventilation on CABG surgery that the lung protective ventilation techniques differed between two groups and resulted substantial reduction in release of systemic and pulmonary inflammatory cytokines in protective ventilation group versus control group.17
The present study revealed no significant difference between cross clamp time and bypass time with pattern of ventilation. Results of this study are consistent with another study of similar nature conducted by Furqan et al. stating that bypass duration and cross-clamp period were same in both groups.11 That study also indicated that longer CPB time was a leading hazardous aspect leading to PPCs.18,19
The results of present study showed insignificant association between total ICU stay in days and low tidal ventilation strategy, (P-value =0.371). Maximum number of patients n=25 (71.40%) in the present study were discharged from the intensive care unit after 4-6 days stay. Individuals with cardiac surgery denote a distinctive population of the critically ill because their requirement for intensive care subsequent to surgery is immediately anticipated. These cases are also exclusive because most of them spend a short duration of time in the ICU and after a somewhat short stay they are discharged from the hospital. However, certain cardiac surgery subjects experience substantial postoperative complications and lengthy period in the intensive care unit in hospital.20
Present study reported insignificant result in total ventilation time in both groups with P-value= 0.736. Low tidal ventilation group showed 11-15 hours of total ventilation after induction. The current study results are inconsistent with another study conducted by Dasgupta et al. in India which highlighted smaller ventilation time with P = 0.057 among three group i.e. no ventilation, low tidal ventilation, and CPAP group. This also revealed low tidal ventilation following CPB was associated improved after surgery oxygenation and lung functions with continuous positive pressure ventilation. The present study also revealed oxygen saturation at second post-operative day was high in low tidal ventilation group. 99-100% arterial oxygen saturation was recorded among 10 (14.29%) patients with low tidal ventilation as compared to no ventilation group showed only two patients (2.86%) with 99-100% saturation at ABGs report and by pulse oxymeter.22
The present study also resulted insignificant association of PaO2/FiO2 ratio and A-a gradient after induction, one hour and four hours after cardiopulmonary bypass. The same has been endorsed by another study completed in Egypt by Hussain et al. In that study, there was non-significant decrease in static and active lung passivity and P/F ratio after surgery, with non-significant rise in (A-a) gradient in one hour after surgery of 3 groups (Group-1, P= Pressure‑controlled ventilation, Group-2, V= Volume‑controlled ventilation, and Group-3, C= Control group with no ventilation) in accordance with the mode of ventilation. The ventilation intervention showed improvement as compared to the control group but still non-significant.23
CONCLUSIONS:
The study concluded that the low tidal volume in mechanically ventilated patients undergoing cardiopulmonary bypass surgical treatment is effective and safer method. During CPB, low tidal volume ventilation improved post-bypass oxygenation and lung mechanics. For post-operative pulmonary complications low tidal volume ventilation during CPB is superior to non-ventilation.
Recommendations
The present study clearly shows that post-operative pulmonary complications are far less by using continuous low tidal volume ventilation as compared to no ventilation during cardiopulmonary bypass surgery. So, low tidal volume ventilation is recommended during cardiopulmonary bypass surgery in the light of present research work.
Limitations
This study has several limitations that should be considered while interpreting the findings. First, the sample size was relatively small, which may limit the statistical power and generalizability of the results. Second, the study was conducted at a single tertiary care center, which may not reflect practices and outcomes in other institutions or regions. Third, the follow-up period was limited to the first three postoperative days; therefore, late-onset pulmonary complications could not be assessed. Additionally, the use of non-probability purposive sampling may introduce selection bias. Finally, potential confounding variables such as intraoperative fluid management, anesthetic variations, and postoperative physiotherapy were not fully controlled, which may have influenced the outcomes
REFERENCES:
1. Park SH. Perioperative lung-protective ventilation strategy reduces postoperative pulmonary complications. Korean J Anesthesiol. 2016;69(1):3-7.
2. https://doi.org/10.4097/kjae.2016.69.1.3
3. Andrejaitiene J, Sirvinskas E, Bolys R. The influence of cardiopulmonary bypass on respiratory dysfunction. Medicina. 2004;40(Suppl 1):7-12.
4. Claxton BA, Morgan P, McKeague H, Mulpur A, Berridge J. Alveolar recruitment strategy improves oxygenation. Anesthesia. 2003;58(2):111-116.
5. https://doi.org/10.1046/j.1365-2044.2003.02982.x
6. Imura H, Caputo M, Lim K, et al. Pulmonary injury after cardiopulmonary bypass. J Thorac Cardiovasc Surg. 2009;137(6):1530-1537.
7. https://doi.org/10.1016/j.jtcvs.2008.12.013
8. Wang YC, Huang CH, Tu YK. Ventilation during CPB: meta-analysis. J Cardiothorac Vasc Anesth. 2018;32(2):748-759.
9. https://doi.org/10.1053/j.jvca.2017.09.029
10. Nguyen LS, Merzoug M, Estagnasie P, et al. MECANO trial protocol. Trials. 2017;18:582.
11. https://doi.org/10.1186/s13063-017-2310-2
12. Ji Q, Mei Y, Wang X, et al. Risk factors for pulmonary complications. Int J Med Sci. 2013;10(11):1578-1583.
13. https://doi.org/10.7150/ijms.6827
14. Levy JH, Tanaka KA. Inflammatory response to cardiopulmonary bypass. Ann Thorac Surg. 2003;75(2):S715-S720.
15. https://doi.org/10.1016/S0003-4975(02)04648-
16. Chi D, Chen C, Shi Y, et al. Ventilation meta-analysis. Medicine. 2017;96(12):e6685.
17. https://doi.org/10.1097/MD.0000000000006685
18. Amato MB, Barbas CS, Medeiros DM, et al. Protective ventilation strategy. N Engl J Med. 1998;338(6):347-354.
19. https://doi.org/10.1056/NEJM199802053380602
20. Wrigge H, Uhlig U, Baumgarten G, et al. Ventilation strategies and inflammation. Intensive Care Med. 2005;31(10):1379-1387.
21. https://doi.org/10.1007/s00134-005-2740-1
22. Zamani MM, Najafi A, Sehat S, et al. Lung protective ventilation study. J Cardiothorac Res. 2017;9(4):221-228.
23. https://doi.org/10.15171/jcvtr.2017.38
24. Davoudi M, Farhanchi A, Moradi A, et al. Low tidal volume ventilation study. Tehran Heart Center J. 2010;5(3):128-131.
25. Al Jaaly E, Zakkar M, Fiorentino F, Angelini GD. Pulmonary protection strategies. Oxid Med Cell Longev. 2015.
26. https://doi.org/10.1155/2015/676204
27. Naveed A, Azam H, Murtaza HG, et al. Pulmonary complications after CPB. Pak J Med Sci. 2017;33(4):993-996.
28. https://doi.org/10.12669/pjms.334.12829
29. Hussain NS, Metry AA, Nakhla GM, et al. Ventilation modes comparison. Anesth Essays Res. 2019;13(2):236-242.
30. https://doi.org/10.4103/aer.AER_186_18
31. Bignami E, Saglietti F, Di Lullo A. Mechanical ventilation management. Ann Transl Med. 2018;6(19):380.
32. https://doi.org/10.21037/atm.2018.08.20
33. Dasgupta CS, Kar SK, Ganguly T, Goswami A. Ventilation strategies during CPB. 2015.