Determining the Effectiveness of STRONGkids Screening Tool in Predicting Malnutrition Risk in Hospitalized Children
- Sadiq Amin , PGR-4, Department of pediatrics, MTI - Khyber Teaching Hospital Peshawar, Pakistan
- Hira Tahir , PGR-4, Department of pediatrics, MTI - Khyber Teaching Hospital Peshawar, Pakistan
- Sulaiman Shah , PGR-4, Department of pediatrics, MTI - Khyber Teaching Hospital Peshawar, Pakistan
- Sumaira , PGR-4, Department of pediatrics, MTI - Khyber Teaching Hospital Peshawar, Pakistan
- Shah Fahad , PGR-4, Department of pediatrics, MTI - Khyber Teaching Hospital Peshawar, Pakistan
- Arshia Munir , Associate Professor, Department of pediatrics, MTI - Khyber Teaching Hospital Peshawar, Pakistan
Article Information:
Abstract:
Background: Malnutrition in hospitalized children is a major clinical issue that may have adverse consequences on development, immunity, and illness recovery. Risk of nutrition should be identified early to avoid complications and enhance patient outcomes. Nutritional screening instruments like the Screening Tool of Risk of Impaired Nutritional Status and Growth (STRONGkids) offers a feasible way of screening children at risk of malnutrition in hospital wards. Aim: The central question of this research concerned the overall diagnostic accuracy of the STRONGkids screening tool in identifying that malnutrition is a risk factor among hospitalized children based on the use of weight to height Z scores as the reference standard. Methodology: The research was a cross sectional validation study that was undertaken in the Department of Pediatrics at Khyber Teaching Hospital, Peshawar from August 2025 to October 2025. Non probability consecutive sampling was used to enroll 271 hospitalized children aged 1 month and up to 18 years. Anthropometric data and demographic information such as weight and height were taken. The STRONGkids screening tool was used to determine the nutritional risk and compared with the weight to height Z scores. A two by two contingency table was used to calculate sensitivity, specificity, positive predictive value, negative predictive value, and the diagnostic accuracy. Findings: Malnutrition (moderate and severe forms) was 29.5%. As a screening tool, it was found that the STRONGkids had a sensitivity of 72.5 and specificity of 53.4 when used to screen malnutrition. The positive predictive value was 39.5 and the negative predictive value was 82.3. The screening tool had a diagnostic accuracy of 59 in total. Conclusion: The STRONGkids screening tool revealed a moderate level of diagnostic accuracy in revealing malnutrition risk in hospitalized children. Regular utilization of this tool can assist in early identification of nutritional risks and enable health practitioners to start early nutritional interventions.
Keywords:
Article :
INTRODUCTION :
Malnutrition is one of the greatest public health issues that affect children globally. It is referred to as the condition caused by the lack of proportions in the nutritional intake and needs of the body, which causes the deficiency of growth, distortion of the body composition, and deteriorations of physiological functioning. Malnutrition in children has especially grave outcomes since proper nutrition requires healthy physiological development, brain maturation, immune activity, and healthy condition. Early undernutrition has some long-term negative consequences, such as poor psychological growth, academic success, high likelihood of falling ill, and mortality (1).
Malnutrition is a significant problem that is experienced by millions of children around the world especially in the low and middle-income countries. The international health estimates indicate that a significant percentage of children below the age of five years are subsequently underweight, stunted or wasting owing to poor nutrition. These are the circumstances that cause a lot of morbidity and mortality among children. Malnutrition not only has an impact on physical growth but has some long-term economic implications in the sense that malnutrition lowers productivity to the extent of raising both household and national health care expenses (2). As such, malnutrition identification and treatment are still urgent points of pediatric care.
Growth following is often considered as one of the best predictors of nutritional status of the child. Anthropometric data as weight, height, body mass index is usually used to assess patterns of growth and identify pictures of nutritional deficiencies. The growth standards of the World Health Organization (WHO) give a set of standard reference values where clinicians determine whether a child is within the normal range of its growth parameters. The wasting, stunting, and underweight conditions of malnutrition are commonly determined by use of indicators such as weight-for-height, height-for-age, and weight-for-age Z-scores (3).
Children admitted to hospitals comprise one of the most vulnerable groups at the risk of malnutrition. Under acute illnesses, the sufferer may have reduced appetite, gastrointestinal problems including vomiting, or diarrhea, increased metabolic needs and long periods of starvation between diagnostic or therapeutic interventions. These can also lead to poor nutrition when staying in the hospital. Moreover, both predisposing nutritional deficiencies and internal chronic diseases and infections may add weight to the condition, making a child more vulnerable to developing or aggravating malnutrition in the course of the hospitalization period (4).
A number of studies that have been carried out in various locations have indicated a high rate of malnutrition in hospitalized pediatrics. It has been estimated that it is now common ranging between 19% and 80 percent depending on the healthcare environment, the population of the patients, and parameters of diagnoses. The prevalence of this wide variation points to the complexity of nutritional evaluation in clinical practice and the necessity to have effective screening instruments that would help to detect children at risk of malnutrition at an early stage of hospitalization (5).
The nutritional risk has to be detected early enough to be able to initiate the earliest possible nutritional interventions to avoid the complications of malnutrition. Ignorance of malnutrition among hospitalized children may result in poor recovery, delay in discharge, high costs of morbidity, and high costs in the health facilities. Thus, the nutritional screening method conducted on a systematic level when hospitalising a child has been suggested as a valuable aspect of clinical attention that is paid to the child (6).
To support the early recognition of children who are likely to be affected by malnutrition, various nutritional screening instruments have been created as used in pediatric hospital environments. These tools are to be used with the purpose to offer a quick and viable approach to the recognition of patients that need additional nutritional evaluation or intervention. Some of the most popular nutritional screening instruments that are used by the pediatric population include Pediatric Yorkhill Malnutrition Score (PYMS), Screening Tool for the Assessment of Malnutrition in Pediatrics (STAMP), and the Screening Tool of Risk of impaired Nutritional Status and Growth (STRONGkids) (7).
STRONGkids screening tool has received a lot of attention owing to its simplicity and ease of use in the clinical practice. The instrument measures four primary elements that include subjective clinical evaluation, patient has a high-risk disease, reduced nutritional consumption and recent weight reduction or inadequate weight gain. A score is given to each component, with the aggregate score classifying the children as low risk, moderate risk and high risk to malnutrition. STRONGkids tool may be filled in relatively fast without complex measurements and special equipment, therefore, this option is specifically applicable to the hectic hospital setting (8).
Past studies have considered the diagnostic accuracy of the STRONGkids screening instrument across other groups. Validation research has demonstrated that the tool is useful in screening children who have a risk of developing malnutrition although sensitivity and specificity depend on the clinical setting. There are studies that have indicated moderate sensitivity and rather high specificity whereas others have indicated good predictive value in the identification of children who need additional nutritional assessment (9).
As an example, a cross-sectional study carried out at a hospital in Ghana of hospitalized children indicated that the STRONGkids screening tool to predict malnutrition risk had a sensitivity value of around 70 and specificity of 43.3% when compared to anthropometric measurements (10). In the same vein, other researchers have indicated that the nutritional risk children can also be readily identified by the help of STRONGkids which can help healthcare providers to prioritize nutritional interventions of vulnerable patients (11).
Although there is more and more adoption of STRONGkids in different parts of the world, little evidence exists on the diagnostic use as it applies to most developing states. The differences in the patterns of disease, nutritional status, health care system, and socio-economic status could affect the effectiveness of screening tools among different populations. Thus, local validation studies are required to define whether the STRONGkids screening tool can be successful in revealing the risk of malnutrition in certain healthcare settings (12).
Malnutrition is an epidemic among children in Pakistan and other third world nations. Nutritional conditions of many of the hospitalized children can already be vulnerable at the time when the child is admitted to the hospital and it can even become worse throughout hospitalization unless proper interventions are taken. Malnutrition risk screening can be an important element of patient outcomes since healthcare professionals can take necessary measures to provide nutritional support on time (13).
Z-scores of weight-height and weight-height are anthropometric indicators which have been largely accepted as reliable in the diagnosis of acute malnutrition. Nevertheless, these measurements are not always sufficient to determine the influence of children who are likely to develop malnutrition during hospitalization. Anthropometric assessment can be supplemented with the help of screening tools like STRONGkids to detect the risk factors related to the deterioration of nutrition (14).
This is why, it is necessary to compare diagnostic accuracy of the Wonderfulkids screening tool with anthropometric indicators to clarify the necessity of its introduction into clinical practice. By evaluating the sensitivity, specificity, and predictive values of this screening tool, one will be able to decide whether the given screening tool can be regarded as a helpful technique to help identify nutritional risks as an early sign of compromised health among children in hospital (15).
The current work is expected to establish the correctness and reliability of the diagnostic value of the STRONGkids screening tool on predicting malnutrition risk among hospitalized children as the comparison of the results of the screening tool with the gold standard weight-for-height Z-scores. The results of this paper will play a role in the current literature and serve as local evidence on whether or not the use of the STRONGkids can be used as a viable screening media in the nutrition assessment of the pediatric patients.
METHODOLOGY:
Study Design
The aim of the study was to establish the diagnostic validity of the STRONGkids screening tool with regard to detecting the risk of malnutrition in a hospitalized child, which is a cross sectional validation study. A cross sectional design was deemed suitable since it would enable simultaneous evaluation of the screening test and the reference standard within a specified population. Strong kids screening score was correlated with anthropometric measurement through weight to height Z scores, which was the gold standard of identifying malnutrition.
Study Setting and Duration
The study was done in the Department of Pediatrics at Khyber Teaching Hospital, Peshawar from August 2025 to October 2025. It is a large hospital that serves both urban and rural communities and is a tertiary care hospital that accepts children with diverse but serious medical conditions. The study was conducted in this context whereby a variety of pediatric population was reached. The research was done in a span of six months following the approval of the research synopsis by college of physicians and surgeons Pakistan (CPSP) and the hospital ethics review committee.
Sample Size and Methodology.
The study involving 271 patients took place. A sensitivity and specificity sample size calculator was used when determining the sample size, where sensitivity and specificity of the STRONGkids screening tool have been previously reported to be 70 percent and 43.3 percent respectively. It was also calculated taking a malnutrition prevalence rate of 30 percent, confidence interval of 95 percent and absolute precision of 10 percent. The method of sampling was a non-probability consecutive sampling. The recruitment of all the eligible children that were admitted to the pediatric ward at the time of the study that met the inclusion criteria was continued until the sample size reached the desired level.
Study Population
The whole group that was used as a study population was all children aged between one month of age and up to eighteen years old who had been admitted to the pediatric ward and had stayed at least twenty four hours at the hospital. Both female and male patients were covered. Children who had been transferred/referred to the intensive care unit, who were discharged prior to the normal completion of their treatment, and those simply diagnosed with cerebral palsy or growth disorders were excluded so as to have minimal effects on the anthropometric measurements and nutritional assessment.
Data Collection Procedure
The parents or guardians of the participating children provided informed consent in writing. The strive and clinical information at the baseline such as age, gender, place of residence, period of hospitalization, weight and height were put into a prepared data collection paper. Standard procedures were used to measure anthropometric measures. In children below two years, weight and length were assessed by weighing them using a tared weighing scale and measuring them with an infantometer respectively. The weight and height of children above two years were taken with the help of calibrated weighing scale and stadiometer respectively. Anthropometric measurements were conducted, then each patient was subjected to the STRONGkids screening tool to determine the risk of malnutrition. Depending on the overall score, the patients were divided into low risk, moderate risk, and high risk.
Data Analysis
Data gathered were put in and analyzed under SPSS 23. Mean and standard deviation or median and interquantile range were used to summarize quantitative variables including age, weight, height and time of being in hospital based on the distribution of data. Such qualitative variables as gender, residential status, and risk categories of malnutrition were reported in frequencies and percentages. The results of the screening tool based on weight comparisons and height based on weight Z scores were used to calculate the diagnostic accuracy of the STRONGkids screening tool in a two by two contingency table. Sensitivity, specificity, positive predictive value, negative predictive value, and diagnostic overall were computed. The stratification analysis was done to adjust potential confounding variables, including age, gender, residential status, and length of stay in the hospital.
RESULTS:
Demographic Characteristics of Study Participants
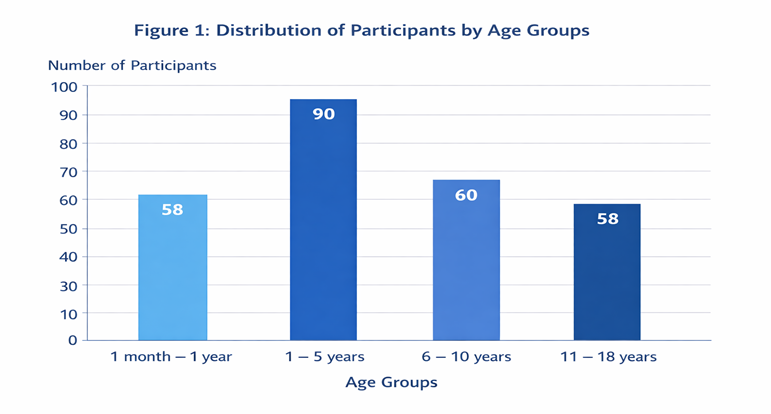
The study enrolled 271 children who were hospitalized and who fit the inclusion criteria. Table 1 presents the summary of the baseline demographics of the participants. The age distribution was based on the fact that the largest proportion of the study population was occupied by the age group of 1-5 year olds. Children under 1 month and 1 year old were of equal proportion, and children under 11 years and over 18 years were of similar proportion as well. Intermediate proportions were made of children between 6 and 10 years. Visual representation of the distribution of participants by age groups is shown in Figure 1 where there is more concentration towards the early childhood age bracket.
Table 1 Demographic Characteristics of Study Participants (n = 271)
|
Variable |
Category |
Frequency (n) |
Percentage (%) |
|
Age Group |
1 month – 1 year |
58 |
21.4 |
|
|
1 – 5 years |
92 |
33.9 |
|
|
6 – 10 years |
63 |
23.2 |
|
|
11 – 18 years |
58 |
21.4 |
|
Gender |
Male |
156 |
57.6 |
|
|
Female |
115 |
42.4 |
|
Residence |
Urban |
117 |
43.2 |
|
|
Rural |
154 |
56.8 |
|
Duration of Hospitalization |
1–3 days |
102 |
37.6 |
|
|
4–7 days |
119 |
43.9 |
|
|
>7 days |
50 |
18.5 |
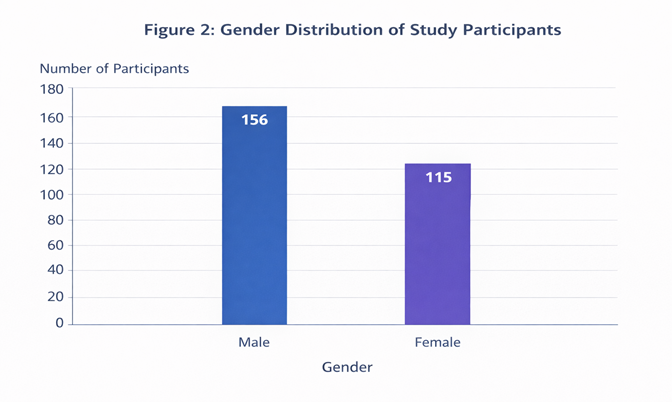
Gender distribution showed that the male population was a little higher than the females in the population under study. The number of males enrolled was over fifty percent and the proportion of females was a little less. The pattern of gender distribution is represented in Figure 2. Businesswise, the residential status indicated that more children belonged to rural than the urban location. The period of hospitalization was different among all participants and the majority of the children were in hospital stay of 4 to 7 days after which those with a short hospital stay.
Anthropometric Measurements of Participants
Table 2 has a summary of the anthropometric features of the study population. The average age, weight, height, and weight of z score of the hospitalized children indicate that there is a high variation in the nutrition and growth cycles of the children. The weight to height Z score values indicated a severe malnutrition to normal nutritional condition.
Table 2 Anthropometric Measurements of Participants
|
Variable |
Mean ± SD |
Minimum |
Maximum |
|
Age (years) |
6.2 ± 4.8 |
0.1 |
17.9 |
|
Weight (kg) |
18.7 ± 9.6 |
3.1 |
54.5 |
|
Height (cm) |
102.4 ± 32.5 |
49 |
168 |
|
Weight-for-Height Z Score |
-1.25 ± 1.43 |
-4.2 |
1.8 |
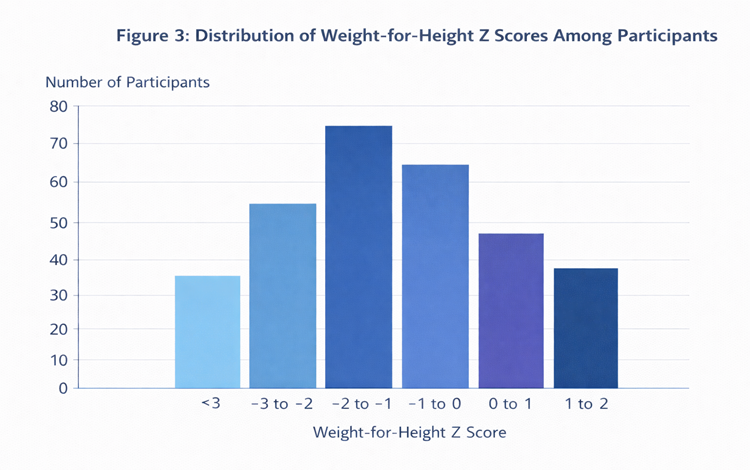
Figure 3 shows the distribution of height Z scores weight against height of the participants. The figure reveals that most children fell within the range of -2 to 0 in terms of Z scores, and very many children fell within the range of the borderline and slightly impaired nutritional range. There was a smaller number of participants with a Z score smaller than -3 which is the sign of a severe malnutrition, and a moderate number of participants with a normal range of the Z score.
STRONGkids Screening Score Distribution
Table 3 shows the data on the distribution of the scores obtained in the screening ofSTRONGkids among the participants. Based on the scoring system of the STRONGkids low, moderate and high-risk group was assigned to children based on malnutrition. The results established that close to 50% of the children were labeled moderate risks of malnutrition. A lesser percentage of children were included in the category low risk, with a significant percentage including the category of high risk.
Table 3 Distribution of STRONGkids Scores
|
STRONGkids Score Category |
Frequency (n) |
Percentage (%) |
|
Low Risk (Score = 0) |
83 |
30.6 |
|
Moderate Risk (Score 1–3) |
135 |
49.8 |
|
High Risk (Score 4–5) |
53 |
19.6 |
|
Total |
271 |
100 |
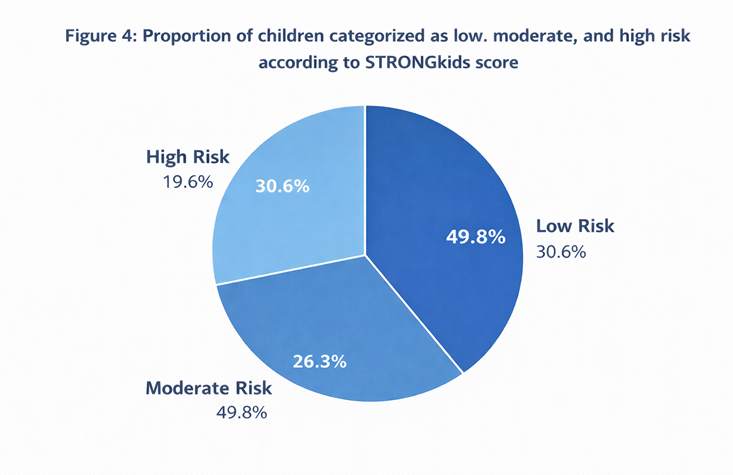
Figure 4 represents the ratio of children with low, middle, and high risks based on the score of STRONGkids. The graphical representation is indicative of the fact that moderate risk was the biggest portion of the population implying that a good number of the children who ended up in the hospital with nutritional deterioration had some identifiable risk factors that could have predisposed them.
Prevalence of Malnutrition Based on Weight for Height Z Score
The results of a nutritional status of the participants according to the WHO weight to height Z score criteria is given in Table 4. The outcomes show that most children fell under the normal nutrition status. Nonetheless, significant numbers of children were found to have moderate malnutrition, and smaller ones to have severe malnutrition.
Table 4 Nutritional Status Based on Weight-for-Height Z Score
|
Nutritional Status |
Frequency (n) |
Percentage (%) |
|
Normal |
191 |
70.5 |
|
Moderate Malnutrition (-2 to -3 SD) |
57 |
21.0 |
|
Severe Malnutrition (< -3 SD) |
23 |
8.5 |
|
Total |
271 |
100 |
Prevalence of malnutrition (moderate + severe) = 29.5%
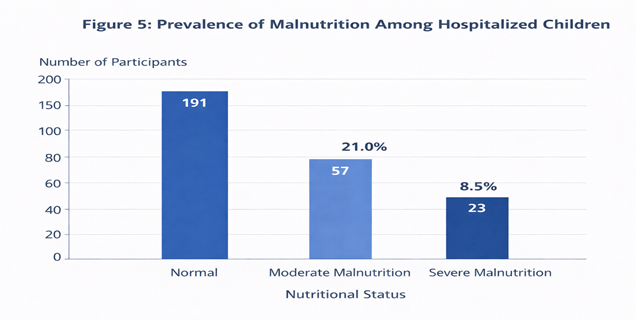
The total malnutrition rate represented a large part of both moderate and severe forms of malnutrition as a whole among hospitalized pediatrics. Figure 5 gives the graphical presentation of the cases of the prevalence of malnutrition among hospitalized children, which gives a clear picture of how the normal nutritional status, moderate malnutrition, and severe malnutrition was distributed in the group of children studied.
Comparison of STRONGkids Screening Results with Weight for Height Z Scores
Table 5 displays the correlation between results of STRONGkids screening and anthropometric diagnosing based on weight on height Z scores. The cross tabulation will show the true positive, false positive, true negative, and false negative cases would be found by the STRONGkids screening tool depending on the anthropometric gold standard.
Table 5 Cross-Tabulation of STRONGkids Screening Tool with WFH Z-Score
|
STRONGkids Result |
Malnutrition Present |
Malnutrition Absent |
Total |
|
STRONGkids Positive |
58 |
89 |
147 |
|
STRONGkids Negative |
22 |
102 |
124 |
|
Total |
80 |
191 |
271 |
Where
TP = 58, FP = 89, FN = 22, TN = 102
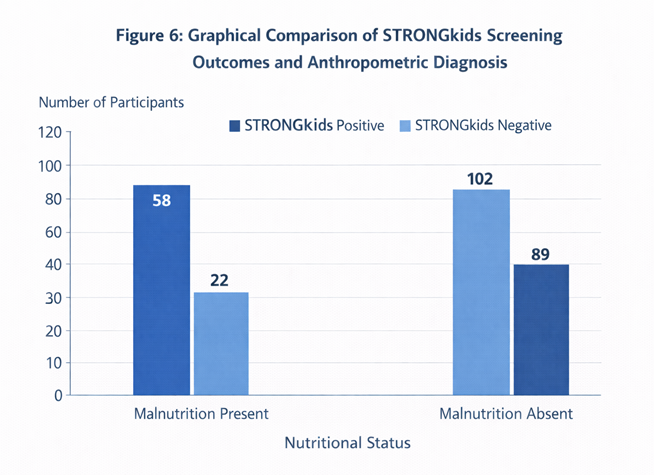
Figure 6 is a graphical analysis of outcomes on the screening of the STRONGkids and anthropometric diagnosis. The number shows the proportions of the positive and negative results of STRONGkids in children with and without malnutrition, which can be used as a graphical explanation of the performance of this screening tool in determining the risk of malnutrition.
Diagnostic Accuracy of STRONGkids Screening Tool
Table 6 summarizes the diagnostic capabilities of the STRONGkids screening tool. The determined measures are the sensitivity, specificity, positive predictive value, negative predictive value, and the overall diagnostics. According to the findings, the reported results were that the STRONGkids tool represented an intermediate sensitivity tool in predicting children with malnutrition and an intermediate specificity tool in predicting children not with malnutrition.
Table 6 Diagnostic Performance of STRONGkids Screening Tool
|
Diagnostic Measure |
Value (%) |
|
Sensitivity |
72.5 |
|
Specificity |
53.4 |
|
Positive Predictive Value (PPV) |
39.5 |
|
Negative Predictive Value (NPV) |
82.3 |
|
Diagnostic Accuracy |
59.0 |
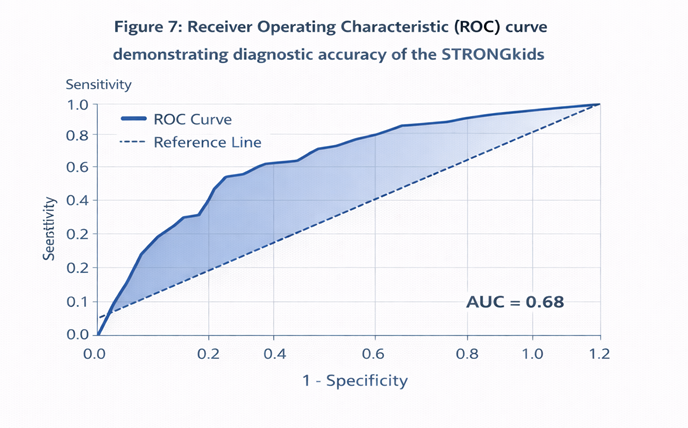
The ROC curve of diagnostic accuracy of the STRONGkids screening tool is presented in Figure 7. ROC curve shows the relationship between specificity and sensitivity in relation to diverse threshold values and gives visual evaluation of the screening tool discriminatory power.
Stratified Analysis of Diagnostic Accuracy
The stratified analysis was conducted to measure the effects of the possible confounding variables based on the age group, gender, and residential status. Table 7 gives the results of stratified analysis by the age groups. These results indicate that the diagnostic ability of the STRONGkids tool is fairly similar in various age groups.
Table 7 Stratified Analysis by Age Groups
|
Age Group |
Sensitivity (%) |
Specificity (%) |
PPV (%) |
NPV (%) |
|
1 month – 1 year |
69.2 |
52.3 |
41.7 |
77.8 |
|
1 – 5 years |
73.5 |
54.9 |
40.6 |
84.3 |
|
6 – 10 years |
74.1 |
55.1 |
38.2 |
85.6 |
|
11 – 18 years |
71.8 |
51.7 |
36.9 |
82.4 |
Likewise, the stratified diagnostic accuracy based on sex is based on Table 8. The findings reveal that the sensitivity and specificity scores of male and female subjects are similar, which implies that the screening instrument can be used to conduct similar performance on both male and female species.
Table 8 Stratified Diagnostic Accuracy by Gender
|
Gender |
Sensitivity (%) |
Specificity (%) |
PPV (%) |
NPV (%) |
|
Male (n = 156) |
71.4 |
54.8 |
40.3 |
81.6 |
|
Female (n = 115) |
73.9 |
51.9 |
38.4 |
83.1 |
Table 9 provides stratified analysis on the basis of residential status. The results suggest a minor difference between the diagnostic indicators in children living in urban and rural districts; still, there was rather stable screening performance.
Table 9 Stratified Diagnostic Accuracy by Residential Status
|
Residence |
Sensitivity (%) |
Specificity (%) |
PPV (%) |
NPV (%) |
|
Urban (n = 117) |
70.6 |
55.3 |
41.2 |
80.7 |
|
Rural (n = 154) |
73.8 |
52.1 |
38.1 |
83.5 |
A comparative graphical presentation of diagnostic accuracy of the stratified groups in figure 8, one can see the diversity in sensitivity and specificity among the demographics subgroups and also verify that the STRONGkids screening tool is useful in diagnosing malnutrition risk in hospitalized children.
DISCUSSION :
The current study assessed the diagnostic quality of the STRONGkids screening tool in detecting the risk of malnutrition in hospitalized children by comparing the findings with weight to height Z scores as an anthropometric reference tool. The results showed that a significant part of the hospitalized children was either moderately or severely malnourished. This point of observation shows the continued clinical burden of pediatric malnutrition and underscores the need for systematic nutritional screening on the occasion of hospital admission. Children who are hospitalized are also prone to nutritional depletion because of metabolic needs associated with the illness and lack of appetite and poor dieting during hospital hospitalization. This observation has also been claimed in earlier studies where a nutritional assessment on children admitted to pediatric wards found a significant percentage of children at risk of malnutrition (16).
STRONGkids scoring patterns demonstrated in the current study that a significant fraction of the children fell into moderate category of nutritional risk whereas smaller but statistically significant fraction fell into high risk category. These data correspond to the idea that a lot of the hospitalized children might be below the anthropometric parameters of malnutrition, however, they have at risk factors that can predispose them to the deterioration of their nutrition. Other past researches have also indicated that nutritional screening tools often give mean moderate risk groups which should be monitored and provided with early nutritional care (17). Rapid identification of these patients will contribute to the avoidance of the increased impairment of nutrition condition during hospitalization.
Comparison with Previous Studies
The performance analysis of the diagnostic results showed moderate levels of specificity and sensitivity of the STRONGkids screening tool in diagnosing malnutrition. The sensitivity which is experienced in this research shows that the screening tool could identify a significant percentage of children that were malnourished according to anthropometric measurements. Similar results have been documented in other pediatrics. Indicatively, a multicenter assessment instituted in pediatric hospitals established moderate sensitivity in nutritional screening instruments of identifying children at nutritional risk which issues are indicative of the ability of nutritional screening instruments to detect potential patients who need additional nutritional evaluation (18).
The degree of specificity witnessed in the current study was comparatively moderate and this means that not all children who were classified as at risk according to STRONGkids were found to be malnourished according to anthropometric measures. This has also been reported amongst other validation studies in which nutritional screening tools showed high sensitivity and low specificity. This is not surprising since screening instruments are meant to detect possible risk and not decide whether one has malnutrition (19). Thus, the at-risk children should have a follow-up nutritional screening to determine their nutritional conditions.
The analysis of the receiver operating characteristic curves also revealed a moderate level of diagnostic accuracy of the STRONGkids tool. Other clinical studies developed to gauge the usefulness of pediatric nutritional screening instruments have provided similar diagnostic performance levels. Studies carried in hospital based populations of children have found out that the screening instruments would give a sound initial determination of nutritional risk, particularly to be used alongside anthropometric measurements and clinical assessment (20).
Clinical and Public Health Implications
Pediatric healthcare practice has significant implications for the results of this study. By establishing regular nutritional screening with STRONGkids during hospital inpatients, it can be easier to identify the children with a need of nutrition early. Malnutrition causes complications, inclusion of delayed recovery, high risk of infections, and long stay in hospitals, which can be slowed down by early nutritional intervention. Incorporation of nutritional screening into the normal routine in paediatric care can thus affect clinical outcomes and also yield better healthcare delivery (21).
Furthermore, the fact that a simple and quick screening tool like STRONGkids can be applied might be particularly useful in those medical facilities that are resource-strained yet nutritional assessment cannot always be detailed in such cases. The tool is feasible as it utilizes less training and can be easily implemented by healthcare providers in practice, and thus it is an effective tool to use during the routine screening in the busy environments of the hospital.
Study Limitations
Although valuable findings were achieved, there are limitations that one should consider the results of this study. First, the research focused on one tertiary care hospital, and this could be a limitation to the application of the results to other hospitals or groups. Second, the cross sectional design of the study permitted diagnostic accuracy but failed to measure long term clinical outcome of nutritional interventions. Third, the STRONGkids tool contains the aspects of a subjective clinical evaluation that can potentially introduce the observer related variability. Multicenter research directed at the effectiveness of nutrition screening instruments among children needs to be continued with future multicenter research involving larger samples and longitudinal follow-ups, to further prove their effectiveness.
CONCLUSION :
To conclude, the current study revealed that malnutrition is a worrisome issue among hospitalized children and that STRONGkids screening tool is capable of a medium-level diagnostic accuracy when it comes to identifying the children at risk of malnutrition. The device seems to be an effective and convenient way of early screening of nutritional risks in child hospitals. The orderly adoption of the screening of the patients at the hospital admission through the use of STRONGkids could be used to enable the health professionals to be able to detect the potentially vulnerable patients and implement timely nutritional interventions. The measures would help to enhance the clinical results and improve the control of pediatric malnutrition.
BIBLIOGRAPHY:
1. Pereira DS, Silva VM, Luz GD, Silva FM, Dalle Molle R. Nutrition risk prevalence and screening tools’ validity in pediatric patients: a systematic review. JPEN J Parenter Enteral Nutr. 2023;47(2):184-206.
2. World Health Organization, UNICEF, World Bank Group. Levels and trends in child malnutrition: UNICEF/WHO/World Bank Group joint child malnutrition estimates 2024 edition. Geneva: World Health Organization; 2024.
3. de Onis M, Branca F. Childhood stunting: a global perspective and future directions. Lancet Glob Health. 2023;11(5):e693-e703.
4. Becker P, Carney LN, Corkins MR, Monczka J, Smith E, Smith SE, et al. Consensus criteria for diagnosing pediatric malnutrition: update from the Academy of Nutrition and Dietetics and ASPEN. JPEN J Parenter Enteral Nutr. 2021;45(1):17-28.
5. Huysentruyt K, Vandenplas Y, De Schepper J. Nutritional screening in hospitalized children: evaluation of STRONGkids and other screening tools. Nutrients. 2021;13(6):1860.
6. Gambra-Arzoz M, Alonso-Cadenas JA, Jiménez-Legido M, et al. Nutritional risk screening and clinical outcomes in hospitalized pediatric patients. Nutr Clin Pract. 2022;37(2):344-352.
7. Joosten KF, Hulst JM. Malnutrition in pediatric hospital patients: current issues and screening approaches. Curr Opin Clin Nutr Metab Care. 2022;25(3):189-195.
8. Hulst JM, Zwart H, Hop WC, Joosten KF. Evaluation and clinical application of the STRONGkids nutritional risk screening tool in pediatric practice. Clin Nutr ESPEN. 2021;43:128-134.
9. Malekiantaghi A, Malek A, Yousefi F, et al. Evaluation of malnutrition risk in hospitalized children using PYMS, STAMP and STRONGkids screening tools. BMC Nutr. 2022;8:33.
10. Anku EK, Adu-Amoah HG, Ainouson-Quampah J. Validity of STRONGkids as a nutritional screening tool among hospitalized children. Health Sci Investig J. 2023;4(1):428-434.
11. Sayed S, El-Shabrawi MH, Abdelmonaem E, et al. Nutritional screening tools versus anthropometric measurements in children. Pediatr Gastroenterol Hepatol Nutr. 2023;26(4):213-223.
12. Malekiantaghi A, Malek A, Yousefi F, et al. Evaluation of malnutrition risk in hospitalized children using PYMS, STAMP and STRONGkids screening tools and comparison with anthropometric indices: a cross-sectional study. BMC Nutr. 2022;8:33.
13. World Health Organization, UNICEF, World Bank Group. Levels and trends in child malnutrition: UNICEF/WHO/World Bank Group joint child malnutrition estimates 2023 edition. Geneva: World Health Organization; 2023.
14. Suryawan A, Jalaludin MY, Poh BK, et al. Malnutrition in early life and its neurodevelopmental consequences. Nutr Res Rev. 2022;35(1):136-149.
15. Carvalho-Salemi J, Phillips W, Vega MW, et al. Malnutrition among hospitalized children in the United States. J Acad Nutr Diet. 2023;123(1):109-116.
16. Becker P, Carney LN, Corkins MR, Monczka J, Smith E, Smith SE, et al. Consensus criteria for diagnosing pediatric malnutrition: update from the Academy of Nutrition and Dietetics and ASPEN. JPEN J Parenter Enteral Nutr. 2021;45(1):17-28.
17. Joosten KF, Hulst JM. Nutritional screening tools for hospitalized children: methodological considerations. Curr Opin Clin Nutr Metab Care. 2014;17(3):231-236.
18. Hulst JM, Zwart H, Hop WC, Joosten KF. Dutch national survey to test the STRONGkids nutritional risk screening tool in hospitalized children. Clin Nutr. 2010;29(1):106-111.
19. McCarthy H, Dixon M, Crabtree I, Eaton-Evans MJ, McNulty H. The development and evaluation of the Screening Tool for the Assessment of Malnutrition in Paediatrics (STAMP). Clin Nutr. 2012;31(3):347-352.
20. Huysentruyt K, Devreker T, Dejonckheere J, De Schepper J, Vandenplas Y. Accuracy of nutritional screening tools in hospitalized children. Eur J Pediatr. 2015;174(8):1025-1032
21. Pawellek I, Dokoupil K, Koletzko B. Prevalence of malnutrition in pediatric hospital patients. Clin Nutr. 2008;27(1):72-76.