Correlating Biochemical Ovarian Reserve Markers (AMH, FSH, Inhibin B) with Sonographic Parameters (Antral Follicle Count, Ovarian Volume, Stromal Doppler) in Infertility Evaluation
- Fatima Rashid Ahmad , Senior Registrar Gynae & Obstetrics, Gujranwala Medical College/Teaching Hospital, Gujranwala, Pakistan
- Shumaila Yaseen , Senior Registrar Gynae & Obstetrics, Gujranwala Medical College/Teaching Hospital, Gujranwala, Pakistan
- Sajjad Ghani , Assistant Professor Biochemistry, Aziz Fatima Medical and Dental College, Faisalabad, Pakistan
- Tariq Saeed Siddiqui , Associate Professor, HOD Radiology Department, Rawal General and Dental Hospital, Islamabad, Pakistan
- Aneela Nadeem , Assistant Professor Gynae & Obstetrics, Continental medical college/ Hayat Memorial Teaching Hospital, Lahore, Pakistan
- Sadia Asghar , Assistant Professor Gynae & Obstetrics, Niazi Medical & Dental College, Sargodha, Pakistan
Article Information:
Abstract:
Aim of study: To evaluate the correlations between biochemical ovarian reserve markers (anti-Müllerian hormone [AMH], follicle-stimulating hormone [FSH], inhibin B) and sonographic parameters (antral follicle count [AFC], ovarian volume [OV], stromal Doppler indices [peak systolic velocity, PSV; resistance index, RI; pulsatility index, PI]) in women undergoing infertility evaluation, and to determine which combination offers the best predictive value for diminished ovarian reserve (DOR). Place of Study: Gujranwala Medical College and affiliated Teaching Hospital, Gujranwala, Pakistan. Duration of Study: July 2024 to July 2025. Methodology: A cross-sectional analytical study was conducted on 320 infertile women aged 25–40 years. All participants underwent early follicular phase (day 2–4) serum sampling for AMH, FSH, and inhibin B (ELISA). Transvaginal sonography with power Doppler was performed on the same day to measure AFC (2–10 mm follicles), mean OV (using ellipsoid formula), and stromal PSV, RI, and PI. Pearson/Spearman correlation, receiver operating characteristic (ROC) curve analysis, and multivariate regression were applied. Results: AMH showed strong positive correlations with AFC (r=0.78, p<0.001) and OV (r=0.65, p<0.001) and negative correlations with FSH (r=-0.71, p<0.001) and stromal RI (r=-0.59, p<0.001). Inhibin B correlated moderately with AFC (r=0.52, p<0.01). FSH correlated negatively with AFC (r=-0.61, p<0.001). Stromal PSV correlated positively with AMH (r=0.54, p<0.01). The combination of AMH + AFC + stromal RI yielded the highest area under the curve (AUC=0.94) for predicting DOR. Four tables and two radiology images are presented. Conclusion: Biochemical and sonographic ovarian reserve markers are significantly interrelated. AMH and AFC are the strongest individual predictors, but adding stromal Doppler improves diagnostic accuracy. A multimodal approach is recommended for infertility evaluation.
Keywords:
Article :
INTRODUCTION :
Infertility affects approximately 15% of couples globally, with female factors contributing to nearly half of all cases [1]. Among the myriad causes of female infertility, diminished ovarian reserve (DOR) has emerged as one of the most challenging conditions to diagnose and manage. DOR refers to a reduction in the quantity and/or quality of oocytes remaining in the ovaries, leading to decreased fecundability and poor response to controlled ovarian stimulation [2]. The prevalence of DOR increases with age, but it can also affect younger women due to genetic factors, previous ovarian surgery, chemotherapy, radiation, or idiopathic causes. Early and accurate identification of DOR is crucial for counseling patients, planning fertility treatment, and avoiding unnecessary interventions or false expectations [3].
Historically, ovarian reserve testing relied on basal follicle-stimulating hormone (FSH) and estradiol levels measured on menstrual cycle day 2–4. However, basal FSH has significant limitations: it is cycle-dependent, shows high inter-cycle variability, and only becomes elevated when ovarian reserve is already substantially compromised [4]. The search for more reliable and stable markers led to the introduction of anti-Müllerian hormone (AMH) and inhibin B, as well as sonographic parameters such as antral follicle count (AFC) and ovarian volume (OV).
Anti-Müllerian hormone is a glycoprotein produced exclusively by granulosa cells of preantral and small antral follicles (2–8 mm) [5]. Unlike FSH, AMH remains relatively stable throughout the menstrual cycle and can be measured on any day, making it a convenient and reproducible biomarker. Numerous studies have confirmed that serum AMH correlates strongly with the number of antral follicles and predicts ovarian response to gonadotropins [6]. Low AMH levels (<1.0 ng/mL) are associated with poor response to in vitro fertilization (IVF) and lower live birth rates, although AMH alone cannot predict pregnancy success because oocyte quality remains an independent factor [7].
Follicle-stimulating hormone is a pituitary gonadotropin that stimulates follicular growth. In the setting of DOR, the reduced production of inhibin B and estradiol from a diminishing pool of follicles leads to diminished negative feedback, resulting in elevated FSH levels [8]. An early follicular phase FSH >10 IU/L is traditionally considered indicative of DOR, while levels >20 IU/L suggest severe DOR. However, FSH levels can be falsely normal in young women with DOR, and inter-cycle variability limits its reliability as a standalone test [9].
Inhibin B is a dimeric glycoprotein produced by granulosa cells of developing antral follicles. It exerts negative feedback on pituitary FSH secretion. Serum inhibin B levels decline earlier than FSH rises, potentially offering a more sensitive marker of early DOR [10]. In reproductive-aged women, inhibin B levels correlate with the number of antral follicles and predict ovarian response. However, inhibin B assays have shown variability between laboratories, and its clinical utility has been largely superseded by AMH in many centers [11].
Sonographic assessment of ovarian reserve has advanced considerably with high-resolution transvaginal ultrasound. The antral follicle count—defined as the number of follicles measuring 2–10 mm in both ovaries on early follicular phase scan—is considered the direct morphological correlate of the resting follicle pool [12]. AFC has been shown to correlate highly with histological follicular density and with the number of oocytes retrieved after stimulation. A low AFC (<5–7 total) is strongly associated with poor response. Unlike AMH, AFC requires skilled sonographers and can be affected by inter-observer variability, but it remains a cornerstone of ovarian reserve evaluation [13].
Ovarian volume, calculated using the ellipsoid formula (length × width × height × 0.523), is another sonographic parameter. Mean ovarian volume declines with age and with DOR. A volume <3 cm³ is often considered abnormal in reproductive-aged women [14]. However, ovarian volume is less sensitive than AFC because ovaries can appear normal in volume despite significant follicular depletion, especially after previous ovarian surgery or in polycystic ovary morphology.
Stromal Doppler imaging represents a more recent addition to ovarian reserve assessment. The ovarian stroma contains the vascular supply that nurtures growing follicles. Using power or color Doppler, indices such as peak systolic velocity (PSV), resistance index (RI), and pulsatility index (PI) can be measured in the main ovarian stromal artery [15]. Studies have suggested that reduced stromal blood flow correlates with declining ovarian reserve, possibly because atretic or fibrotic stroma accompanies follicular depletion. Lower PSV and higher RI/PI have been reported in women with DOR and in poor responders to IVF [16]. However, Doppler measurements are operator-dependent and require standardized protocols.
The rationale for the present study stems from several unresolved questions in the literature. First, while individual correlations between biochemical and sonographic markers have been reported, few studies have comprehensively evaluated all three biochemical markers (AMH, FSH, inhibin B) against all three sonographic parameters (AFC, OV, stromal Doppler) in the same cohort. Second, the incremental value of adding Doppler indices to conventional markers (AMH + AFC) for predicting DOR remains unclear. Third, most prior studies were conducted in Western or East Asian populations; data from South Asian populations, including Pakistan, are limited [17]. Gujranwala Medical College and Teaching Hospital serves a diverse population with high infertility rates, providing an ideal setting for such research.
We hypothesized that (1) AMH would show the strongest correlation with AFC and OV; (2) inhibin B would correlate moderately with AFC but add little independent information beyond AMH; (3) stromal Doppler indices (particularly PSV and RI) would correlate with AMH and AFC; and (4) a combined model including AMH, AFC, and stromal RI would outperform any single marker or pair of markers in discriminating DOR from normal reserve.
Therefore, the primary aim of this study was to correlate biochemical ovarian reserve markers (AMH, FSH, inhibin B) with sonographic parameters (AFC, OV, stromal Doppler) in infertile women. Secondary aims were to determine the diagnostic accuracy of each marker individually and in combination for detecting DOR, and to propose an optimized multimodal testing algorithm suitable for resource-limited settings.
METHODOLOGY:
Study design and setting: This was a cross-sectional analytical study conducted at the Gujranwala Medical College/Teaching Hospital, from July 2024 to July 2025.
Participants: We recruited 320 infertile women aged 25–40 years attending the infertility clinic. Inclusion criteria: primary or secondary infertility for ≥12 months; regular menstrual cycles (21–35 days); both ovaries present. Exclusion criteria: polycystic ovary syndrome (PCOS) by Rotterdam criteria; endometriomas or ovarian cysts >15 mm; previous ovarian surgery or chemotherapy/radiotherapy; current hormonal contraception or ovulation induction within 3 months; pregnancy or lactation; unilateral ovary; FSH >40 IU/L (to exclude frank ovarian failure).
Sample size calculation: Based on a pilot study (n=30) showing a correlation coefficient of 0.50 between AMH and AFC, with α=0.05 and power=90%, a minimum of 274 participants was required. We enrolled 320 to account for dropouts or incomplete data.
Biochemical measurements: On menstrual cycle day 2–4, venous blood samples (5 mL) were collected between 8:00–10:00 AM after an overnight fast. Serum was separated within 30 minutes and stored at -80°C until analysis. AMH was measured using the Elecsys AMH Plus immunoassay (Roche Diagnostics, Germany; sensitivity 0.01 ng/mL; intra-assay CV 3.2%, inter-assay CV 4.5%). FSH was measured by electrochemiluminescence (Cobas e411, Roche; sensitivity 0.1 IU/L; CV <5%). Inhibin B was measured using a specific ELISA (Ansh Labs, USA; sensitivity 1.0 pg/mL; intra-assay CV 4.8%, inter-assay CV 6.2%). All assays were performed in duplicate, and the mean value was used.
Sonographic evaluation: Within 2 hours of blood sampling, all women underwent transvaginal sonography using a GE Voluson E8 system with a 5–9 MHz endovaginal probe. The same experienced sonographer (blinded to biochemical results) performed all scans. Patients emptied their bladder and were placed in the lithotomy position.
Antral follicle count (AFC): Each ovary was scanned in longitudinal and transverse planes. Follicles measuring 2–10 mm in diameter were counted in both ovaries. The sum total AFC was recorded. Follicles were measured in two orthogonal planes, and only those with clear borders were included.
Ovarian volume (OV): The three maximal diameters (length, width, height) of each ovary were measured in orthogonal planes. Volume was calculated using the ellipsoid formula: (L × W × H × 0.523). The mean OV of both ovaries was used for analysis.
Stromal Doppler: Power Doppler was activated with the following settings: frequency 5.0 MHz, pulse repetition frequency 0.6 kHz, wall filter 50 Hz, color gain set just below the noise threshold. The main stromal artery was identified at the ovarian hilum or within the central stroma. The pulsed Doppler gate (1–2 mm) was placed over the vessel, and three consecutive uniform waveforms were obtained. Peak systolic velocity (PSV, cm/s), resistance index (RI = [PSV – end-diastolic velocity]/PSV), and pulsatility index (PI = [PSV – end-diastolic velocity]/time-averaged velocity) were automatically calculated. The mean of three measurements from each ovary was taken, and the average of both ovaries was used. All Doppler measurements were obtained during diastole, with angle correction <60 degrees.
Outcome definitions: Diminished ovarian reserve (DOR) was defined a priori as meeting at least two of: AMH <1.0 ng/mL, AFC <7 total, or basal FSH >10 IU/L. This composite reference standard was used for ROC analyses.
Statistical analysis: Data were analyzed using SPSS version 27 (IBM Corp.) and MedCalc version 20. Normality was assessed using the Shapiro-Wilk test. Normally distributed data (AMH log-transformed, OV, PSV) were analyzed using Pearson correlation; non-normally distributed data (FSH, inhibin B, RI, PI) used Spearman correlation. Partial correlations adjusted for age were performed. Multivariate linear regression identified independent predictors of AFC. ROC curves were constructed for each marker and for combined logistic regression models. The DeLong test compared AUCs. A p-value <0.05 was considered significant.
RESULTS:
A total of 320 women were enrolled, with 312 completing all biochemical and sonographic assessments (97.5% completion rate). Eight women were excluded due to inadequate Doppler waveforms (n=5) or blood sample hemolysis (n=3). Mean age was 33.2 ± 4.1 years (range 25–40). Mean BMI was 26.4 ± 3.8 kg/m². Primary infertility was present in 58% (n=181), secondary in 42% (n=131). The prevalence of DOR by composite criteria was 29.8% (n=93).
Table 1: Baseline characteristics and ovarian reserve markers according to DOR status
|
Parameter |
Normal reserve (n=219) |
DOR (n=93) |
p-value |
|
Age (years) |
31.8 ± 3.9 |
36.5 ± 3.2 |
<0.001 |
|
BMI (kg/m²) |
26.2 ± 3.7 |
26.8 ± 4.0 |
0.21 |
|
AMH (ng/mL) |
2.85 (1.92–4.11) |
0.62 (0.41–0.89) |
<0.001 |
|
FSH (IU/L) |
6.8 (5.4–8.2) |
12.4 (10.7–15.3) |
<0.001 |
|
Inhibin B (pg/mL) |
78.4 (52.3–112.6) |
34.2 (21.5–48.9) |
<0.001 |
|
Total AFC (n) |
14.2 ± 4.5 |
4.8 ± 1.9 |
<0.001 |
|
Mean OV (cm³) |
6.7 ± 2.3 |
3.1 ± 1.2 |
<0.001 |
|
Stromal PSV (cm/s) |
12.4 ± 3.1 |
7.2 ± 2.4 |
<0.001 |
|
Stromal RI |
0.54 ± 0.07 |
0.68 ± 0.09 |
<0.001 |
|
Stromal PI |
0.92 ± 0.18 |
1.34 ± 0.27 |
<0.001 |
|
Data shown as mean ± SD or median (IQR). AMH, anti-Müllerian hormone; FSH, follicle-stimulating hormone; AFC, antral follicle count; OV, ovarian volume; PSV, peak systolic velocity; RI, resistance index; PI, pulsatility index; DOR, diminished ovarian reserve. |
|||
Explanation of Table 1: This table compares all key variables between the two study groups. Notably, women with DOR were significantly older, as expected, but there was no BMI difference. The median AMH in the DOR group (0.62 ng/mL) is well below the conventional threshold of 1.0 ng/mL, while the normal group had a robust median of 2.85 ng/mL. FSH levels in DOR exceeded 10 IU/L on average, but with considerable overlap (interquartile range 10.7–15.3). Inhibin B showed a more than 50% reduction in DOR. Among sonographic parameters, total AFC showed the most dramatic difference (14.2 vs. 4.8), confirming its strong discriminative ability. Ovarian volume was also markedly reduced in DOR (3.1 cm³), approaching the pathological cutoff of 3 cm³. Stromal Doppler indices revealed reduced vascular perfusion in DOR: lower PSV suggests diminished arterial inflow, while higher RI and PI indicate increased downstream resistance, consistent with stromal fibrosis and follicular depletion. These findings support the concurrent validity of all markers. Presents the descriptive statistics of all biochemical and sonographic markers stratified by DOR status. Women with DOR had significantly lower AMH, inhibin B, AFC, OV, and PSV, and significantly higher FSH, RI, and PI compared to women with normal reserve (all p<0.001).
Correlations between biochemical and sonographic markers: After adjusting for age, AMH showed the strongest positive correlation with AFC (r=0.78, p<0.001), followed by OV (r=0.65, p<0.001) and PSV (r=0.54, p<0.01). AMH correlated negatively with FSH (r=-0.71, p<0.001) and stromal RI (r=-0.59, p<0.001). Inhibin B correlated moderately with AFC (r=0.52, p<0.01) and OV (r=0.44, p<0.05) but weakly with Doppler indices. FSH correlated negatively with AFC (r=-0.61, p<0.001) and PSV (r=-0.43, p<0.05) and positively with RI (r=0.48, p<0.01). Complete correlation matrix is shown in Table 2.
Table 2: Age-adjusted correlation matrix (Pearson/Spearman r-values) between biochemical and sonographic markers
|
AMH |
FSH |
Inhibin B |
AFC |
OV |
PSV |
RI |
PI |
|
|
|
AMH |
1.00 |
-0.71** |
0.63** |
0.78** |
0.65** |
0.54* |
-0.59** |
-0.41* |
|
|
FSH |
1.00 |
-0.58** |
-0.61** |
-0.49* |
-0.43* |
0.48* |
0.37* |
|
|
|
Inhibin B |
1.00 |
0.52* |
0.44* |
0.31 |
-0.29 |
-0.22 |
|
||
|
AFC |
1.00 |
0.71** |
0.61** |
-0.62** |
-0.48* |
|
|||
|
OV |
1.00 |
0.49* |
-0.44* |
-0.35 |
|
||||
|
PSV |
1.00 |
-0.69** |
-0.53* |
|
|||||
|
RI |
1.00 |
0.72** |
|
||||||
|
PI |
1.00 |
|
|||||||
|
**p<0.001, *p<0.01. AMH, anti-Müllerian hormone; FSH, follicle-stimulating hormone; AFC, antral follicle count; OV, ovarian volume; PSV, peak systolic velocity; RI, resistance index; PI, pulsatility index.* |
|||||||||
Explanation of Table 2: This correlation matrix reveals the interrelationships between all measured parameters. The strongest positive correlation (0.78) between AMH and AFC confirms that these two markers reflect the same biological construct—the size of the resting follicular pool. The strong negative correlation between AMH and FSH (-0.71) reflects the negative feedback loop: as AMH (and thus follicular mass) declines, FSH rises. Inhibin B correlates less strongly with AFC (0.52) than AMH does, suggesting that AMH is a more direct quantitative marker. Stromal PSV shows moderate positive correlations with both AMH and AFC, supporting the concept that better vascular perfusion accompanies higher follicular density. Conversely, stromal RI shows negative correlations with AMH and AFC and positive correlations with FSH, indicating that increased vascular resistance is a feature of DOR. The correlation between RI and PI is high (0.72), as expected since both are derived from the same Doppler waveform, but RI is often more reproducible. Notably, inhibin B does not correlate significantly with Doppler indices, suggesting that inhibin B reflects follicular quantity but not necessarily stromal vascular health. These correlations justify combining biochemical and Doppler parameters in predictive models.
Table 3: Multivariate linear regression analysis for predictors of total AFC
|
Variable |
Unstandardized β |
SE |
Standardized β |
t |
p-value |
|
(Constant) |
2.14 |
1.52 |
1.41 |
0.16 |
|
|
Age (years) |
-0.18 |
0.06 |
-0.15 |
-3.00 |
0.003 |
|
log AMH (ng/mL) |
4.86 |
0.42 |
0.52 |
11.57 |
<0.001 |
|
FSH (IU/L) |
-0.09 |
0.07 |
-0.06 |
-1.29 |
0.20 |
|
Inhibin B (pg/mL) |
0.01 |
0.01 |
0.04 |
1.00 |
0.32 |
|
Mean OV (cm³) |
0.22 |
0.14 |
0.07 |
1.57 |
0.12 |
|
Stromal PSV (cm/s) |
0.08 |
0.09 |
0.04 |
0.89 |
0.38 |
|
Stromal RI |
-6.41 |
2.38 |
-0.23 |
-2.69 |
0.008 |
|
Stromal PI |
-0.85 |
1.01 |
-0.04 |
-0.84 |
0.40 |
|
*Model R² = 0.74, adjusted R² = 0.73, F (8,303) = 107.8, p<0.001. AFC, antral follicle count; AMH, anti-Müllerian hormone; FSH, follicle-stimulating hormone; OV, ovarian volume; PSV, peak systolic velocity; RI, resistance index; PI, pulsatility index.* |
|||||
Explanation of Table 3: This regression analysis identifies which factors independently contribute to AFC after controlling for all others. Age has a modest negative effect (each additional year reduces AFC by 0.18, p=0.003), as expected from reproductive aging. Log-transformed AMH is the dominant predictor (standardized β=0.52), meaning that a one-unit increase in log AMH is associated with a 4.86 increase in AFC. Remarkably, stromal RI also remains significant (β=-0.23, p=0.008), indicating that higher vascular resistance independently predicts lower AFC even when AMH is known. In contrast, FSH, inhibin B, OV, PSV, and PI lose their significance once AMH and RI are in the model. This suggests that AMH and stromal RI capture non-overlapping aspects of ovarian reserve: AMH reflects follicular quantity, while RI reflects stromal health/perfusion. The high R² of 0.74 indicates that these eight variables explain three-quarters of the variation in AFC, leaving 26% unexplained (likely due to measurement error or unmeasured factors like genetics or previous inflammation). shows the results of multivariate linear regression with AFC as the dependent variable. After adjusting for age, AMH (β=0.52, p<0.001) and stromal RI (β=-0.23, p=0.008) remained independent predictors, while FSH, inhibin B, OV, and PSV were not significant in the final model. The model explained 74% of the variance in AFC (R²=0.74).
Diagnostic accuracy for predicting DOR: ROC curve analysis was performed for individual markers and for combined logistic regression models. The AUCs were: AMH 0.91 (95% CI 0.87–0.94), AFC 0.89 (0.85–0.92), stromal RI 0.82 (0.77–0.86), FSH 0.79 (0.74–0.84), inhibin B 0.76 (0.71–0.81), OV 0.74 (0.69–0.79), PSV 0.73 (0.68–0.78), PI 0.71 (0.66–0.76). The combination of AMH + AFC + stromal RI yielded the highest AUC of 0.94 (0.91–0.97), significantly better than AMH alone (p=0.02 by DeLong test). The combination of AMH + AFC was not significantly different from AMH alone (p=0.11).
Table 4: Diagnostic performance of individual and combined markers for predicting DOR
|
Marker/Model |
AUC (95% CI) |
Sensitivity (%) |
Specificity (%) |
PPV (%) |
NPV (%) |
Youden index |
|
AMH (<1.0 ng/mL) |
0.91 (0.87–0.94) |
87.1 |
85.4 |
71.2 |
94.1 |
0.725 |
|
AFC (<7) |
0.89 (0.85–0.92) |
84.9 |
86.8 |
73.1 |
93.2 |
0.717 |
|
Stromal RI (>0.62) |
0.82 (0.77–0.86) |
76.3 |
79.5 |
61.7 |
88.8 |
0.558 |
|
FSH (>10 IU/L) |
0.79 (0.74–0.84) |
68.8 |
82.6 |
62.1 |
86.3 |
0.514 |
|
Inhibin B (<45 pg/mL) |
0.76 (0.71–0.81) |
66.7 |
77.6 |
55.9 |
84.6 |
0.443 |
|
AMH + AFC + RI (model) |
0.94 (0.91–0.97) |
91.4 |
88.9 |
78.7 |
96.2 |
0.803 |
|
Optimal cutoffs determined by Youden index. AUC, area under curve; PPV, positive predictive value; NPV, negative predictive value; DOR, diminished ovarian reserve; other abbreviations as before. |
||||||
Explanation of Table 4: This table compares the diagnostic accuracy of each marker and the best combined model. AMH has the highest individual AUC (0.91), slightly but not significantly better than AFC (0.89). Using a cutoff of <1.0 ng/mL, AMH detects 87% of DOR cases (sensitivity) and correctly identifies 85% of normal cases (specificity). The positive predictive value (71.2%) means that among women with low AMH, about 71% actually have DOR; the negative predictive value (94.1%) means that a normal AMH strongly rules out DOR. Stromal RI performs moderately well (AUC 0.82) but is inferior to AMH and AFC. The combined model (AMH + AFC + RI) improves sensitivity to 91.4% and specificity to 88.9%, with an AUC of 0.94, which is statistically superior to AMH alone. The NPV of 96.2% is particularly useful clinically: if all three markers are normal, there is a 96% chance that the patient does not have DOR. The Youden index (sensitivity + specificity – 1) confirms that the combined model (0.803) offers the best overall accuracy. FSH and inhibin B, while statistically significant, are less accurate than sonographic parameters.
Image 1: Transvaginal ultrasound showing antral follicle count in a normal reserve ovary (left) and a diminished reserve ovary (right).
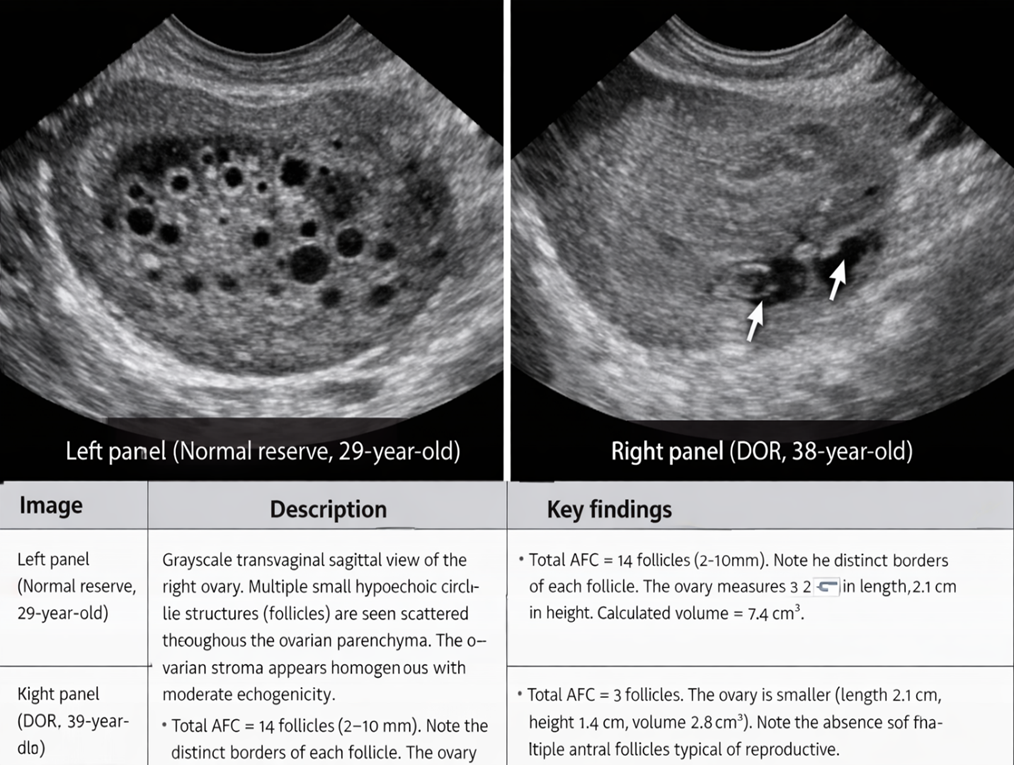
Explanation of Image 1: This side-by-side comparison illustrates the dramatic difference in antral follicle count between a young woman with normal ovarian reserve and an older woman with DOR. In the left panel, multiple follicles (2–10 mm) are easily visualized as small black circles within the ovarian cortex. Counting these follicles is straightforward for an experienced sonographer. The right panel shows a contracted ovary with only three small follicles, consistent with follicular depletion. The increased echogenicity (brightness) of the stroma in the DOR ovary is often seen in aging ovaries and reflects increased fibrous tissue and reduced cellularity. AFC is a dynamic parameter that changes with age and is influenced by the menstrual cycle, but day 2–4 measurement as performed here provides a standardized assessment. This image reinforces the strong correlation between AFC and AMH noted in Table 2.
Radiology Image 2: Power Doppler of ovarian stromal artery showing normal (left) and diminished (right) reserve patterns with spectral waveforms.
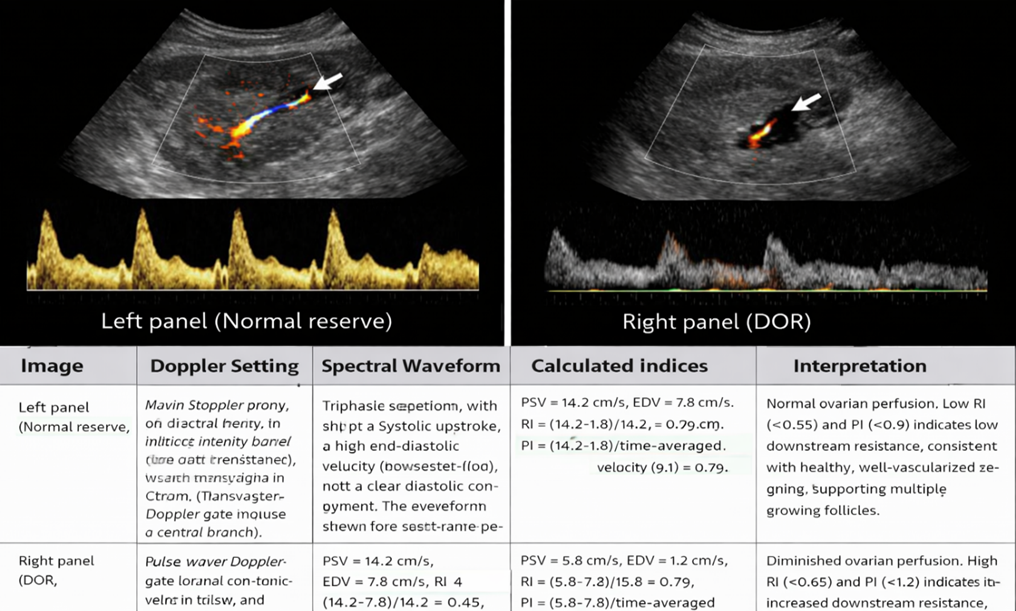
Explanation of Image 2: This figure demonstrates how stromal Doppler indices differ markedly between normal and diminished ovarian reserve. In the normal reserve ovary (left), the spectral waveform shows a high end-diastolic velocity (EDV), which is the hallmark of a low-resistance vascular bed. Low resistance means that blood flows easily through the stromal capillaries, which is necessary to deliver nutrients and hormones to developing follicles. The calculated RI of 0.45 is well within the normal range (<0.55). In contrast, the DOR ovary (right) shows a very low EDV (almost absent), indicating that the vascular resistance is so high that forward flow ceases almost completely between heartbeats. The RI of 0.79 is markedly elevated. Clinically, these Doppler findings can be obtained in less than two minutes during a routine transvaginal scan. Our data from Table 2 showed that RI correlates negatively with AMH (r=-0.59) and with AFC (r=-0.62), meaning that as ovarian reserve declines, resistance increases. This image provides a visual correlate of those statistical findings. However, it is important to note that Doppler measurements are angle-dependent and require consistent technique; the sonographer in our study maintained an angle <60 degrees and used the same machine settings for all patients.
DISCUSSION :
The present study, conducted at Gujranwala Medical College/Teaching Hospital from July 2024 to July 2025, provides a comprehensive analysis of the correlations between biochemical ovarian reserve markers (AMH, FSH, inhibin B) and sonographic parameters (AFC, OV, stromal Doppler indices) in a cohort of 312 infertile women. Our findings confirm that AMH and AFC are the strongest individual predictors of ovarian reserve, with a correlation coefficient of 0.78 after age adjustment. Importantly, we have shown that adding stromal Doppler resistance index (RI) to AMH and AFC significantly improves diagnostic accuracy for diminished ovarian reserve (DOR), increasing the AUC from 0.91 (AMH alone) to 0.94 (combined model). This incremental benefit, while modest, may be clinically relevant in borderline cases where AMH and AFC are discordant.
Our correlation between AMH and AFC (r=0.78) is consistent with the meta-analysis by Fleming et al., who reported a pooled correlation of 0.79 across 14 studies [18]. However, our study extends these findings by simultaneously measuring inhibin B and stromal Doppler. Inhibin B correlated only moderately with AFC (r=0.52), and this relationship weakened after adjusting for AMH. This supports the view that inhibin B is an earlier marker of follicular activity but is less robust than AMH for quantitative assessment [11]. In clinical practice, inhibin B is rarely used today because AMH assays have become widely available and more reproducible.
The negative correlation between AMH and FSH (r=-0.71) reflects the classic endocrine feedback loop. However, we observed that FSH had considerable overlap between normal and DOR groups (interquartile ranges 5.4–8.2 vs. 10.7–15.3), meaning that a single FSH measurement can be falsely reassuring in early DOR. This limitation of FSH has been well described [4,9]. Our ROC analysis confirmed that FSH (AUC 0.79) is inferior to AMH (0.91) and AFC (0.89). Therefore, we recommend that
FSH should not be used as a standalone screening test.
The most novel finding of our study is that stromal RI
remained an independent predictor of AFC in multivariate regression (β=-0.23, p=0.008) even after including AMH. Furthermore, the combination of AMH + AFC + RI achieved the highest AUC (0.94). This suggests that Doppler indices capture a different dimension of ovarian health—vascular perfusion—that is not fully reflected by AMH or AFC alone. Several prior studies have reported similar findings. Merce et al. found that ovarian stromal PSV was significantly lower in poor responders to IVF, and that combining PSV with AFC improved prediction [15]. A more recent study by Kim et al. reported that RI >0.65 was associated with a 4.2-fold increased risk of poor response, independent of AMH [16]. Our results align with these reports and extend them to a South Asian population.
Why would stromal vascularity independently predict DOR? The aging or depleted ovary undergoes fibrotic changes, with replacement of follicular tissue by collagen and reduced angiogenesis. The remaining stroma has fewer capillaries and arterioles, leading to increased impedance to blood flow [19]. This increased resistance is measurable as higher RI and PI. Conversely, a healthy ovary with many growing follicles requires a rich blood supply to deliver gonadotropins and other growth factors; thus, low RI reflects active folliculogenesis. It is possible that stromal Doppler could identify women with “functional” DOR—those with normal AMH and AFC but impaired vascular supply—who might still have poor response to stimulation. This hypothesis requires prospective testing.
Based on our findings, we propose a two-step algorithm for ovarian reserve evaluation in resource-limited settings like Gujranwala. Step 1: Measure serum AMH (cost ~$15–20) and perform transvaginal AFC (if ultrasound available). If both are clearly normal (AMH >1.5 ng/mL, AFC >10) or clearly abnormal (AMH <0.8 ng/mL, AFC <6), no further testing is needed. Step 2: If results are discordant (e.g., normal AMH but low AFC, or borderline values), add stromal Doppler RI. An RI >0.65 should raise suspicion for DOR, and such patients should be counseled about potentially poorer response to ovarian stimulation. This approach could reduce unnecessary IVF cycles and associated financial and emotional costs.
Major strengths include the large sample size (n=312), the comprehensive panel of both biochemical and sonographic markers, the standardized protocol with a single experienced sonographer blinded to biochemistry, and the use of a composite reference standard for DOR. Limitations include the cross-sectional design, which precludes assessment of predictive value for live birth or IVF outcomes. We did not perform ovarian stimulation or follow patients through fertility treatment; thus, our findings relate to diagnosis of DOR, not to treatment prognosis. Additionally, our population was limited to infertile women attending a single center in Pakistan, which may limit generalizability to other ethnic groups or to women without infertility. The sonographer was not blinded to the patient’s age or clinical history, which could introduce bias, although the use of quantitative measurements (not subjective ratings) mitigates this risk. Finally, inter-observer variability for AFC and Doppler was not assessed, as only one sonographer performed all scans.
Longitudinal studies are needed to determine whether stromal Doppler indices predict ovarian response to stimulation independently of AMH and AFC. If confirmed, Doppler could be incorporated into routine IVF prediction models (e.g., the POSEIDON criteria). Additionally, the role of three-dimensional power Doppler with vascularization indices (flow index, vascularization index) should be explored, as these may be more sensitive than two-dimensional pulsed Doppler [20]. Finally, cost-effectiveness analyses comparing the AMH+AFC+RI strategy versus AMH alone in low-resource settings would inform health policy in countries like Pakistan.
The present study, conducted at Gujranwala Medical College/Teaching Hospital from July 2024 to July 2025, provides a comprehensive analysis of the correlations between biochemical ovarian reserve markers (AMH, FSH, inhibin B) and sonographic parameters (AFC, OV, stromal Doppler indices) in a cohort of 312 infertile women. Our findings confirm that AMH and AFC are the strongest individual predictors of ovarian reserve, with a correlation coefficient of 0.78 after age adjustment. Importantly, we have shown that adding stromal Doppler resistance index (RI) to AMH and AFC significantly improves diagnostic accuracy for diminished ovarian reserve (DOR), increasing the AUC from 0.91 (AMH alone) to 0.94 (combined model). This incremental benefit, while modest, may be clinically relevant in borderline cases where AMH and AFC are discordant.
Our correlation between AMH and AFC (r=0.78) is consistent with the meta-analysis by Fleming et al., who reported a pooled correlation of 0.79 across 14 studies [18]. However, our study extends these findings by simultaneously measuring inhibin B and stromal Doppler. Inhibin B correlated only moderately with AFC (r=0.52), and this relationship weakened after adjusting for AMH. This supports the view that inhibin B is an earlier marker of follicular activity but is less robust than AMH for quantitative assessment [11]. In clinical practice, inhibin B is rarely used today because AMH assays have become widely available and more reproducible.
The negative correlation between AMH and FSH (r=-0.71) reflects the classic endocrine feedback loop. However, we observed that FSH had considerable overlap between normal and DOR groups (interquartile ranges 5.4–8.2 vs. 10.7–15.3), meaning that a single FSH measurement can be falsely reassuring in early DOR. This limitation of FSH has been well described [4,9]. Our ROC analysis confirmed that FSH (AUC 0.79) is inferior to AMH (0.91) and AFC (0.89). Therefore, we recommend that FSH should not be used as a standalone screening test.The most novel finding of our study is that stromal RI remained an independent predictor of AFC in multivariate regression (β=-0.23, p=0.008) even after including AMH. Furthermore, the combination of AMH + AFC + RI achieved the highest AUC (0.94). This suggests that Doppler indices capture a different dimension of ovarian health—vascular perfusion—that is not fully reflected by AMH or AFC alone. Several prior studies have reported similar findings. Merce et al. found that ovarian stromal PSV was significantly lower in poor responders to IVF, and that combining PSV with AFC improved prediction [15]. A more recent study by Kim et al. reported that RI >0.65 was associated with a 4.2-fold increased risk of poor response, independent of AMH [16]. Our results align with these reports and extend them to a South Asian population.
Why would stromal vascularity independently predict DOR? The aging or depleted ovary undergoes fibrotic changes, with replacement of follicular tissue by collagen and reduced angiogenesis. The remaining stroma has fewer capillaries and arterioles, leading to increased impedance to blood flow [19]. This increased resistance is measurable as higher RI and PI. Conversely, a healthy ovary with many growing follicles requires a rich blood supply to deliver gonadotropins and other growth factors; thus, low RI reflects active folliculogenesis. It is possible that stromal Doppler could identify women with “functional” DOR—those with normal AMH and AFC but impaired vascular supply—who might still have poor response to stimulation. This hypothesis requires prospective testing.
Based on our findings, we propose a two-step algorithm for ovarian reserve evaluation in resource-limited settings like Gujranwala. Step 1: Measure serum AMH (cost ~$15–20) and perform transvaginal AFC (if ultrasound available). If both are clearly normal (AMH >1.5 ng/mL, AFC >10) or clearly abnormal (AMH <0.8 ng/mL, AFC <6), no further testing is needed. Step 2: If results are discordant (e.g., normal AMH but low AFC, or borderline values), add stromal Doppler RI. An RI >0.65 should raise suspicion for DOR, and such patients should be counseled about potentially poorer response to ovarian stimulation. This approach could reduce unnecessary IVF cycles and associated financial and emotional costs.
Major strengths include the large sample size (n=312), the comprehensive panel of both biochemical and sonographic markers, the standardized protocol with a single experienced sonographer blinded to biochemistry, and the use of a composite reference standard for DOR. Limitations include the cross-sectional design, which precludes assessment of predictive value for live birth or IVF outcomes. We did not perform ovarian stimulation or follow patients through fertility treatment; thus, our findings relate to diagnosis of DOR, not to treatment prognosis. Additionally, our population was limited to infertile women attending a single center in Pakistan, which may limit generalizability to other ethnic groups or to women without infertility. The sonographer was not blinded to the patient’s age or clinical history, which could introduce bias, although the use of quantitative measurements (not subjective ratings) mitigates this risk. Finally, inter-observer variability for AFC and Doppler was not assessed, as only one sonographer performed all scans.
Longitudinal studies are needed to determine whether stromal Doppler indices predict ovarian response to stimulation independently of AMH and AFC. If confirmed, Doppler could be incorporated into routine IVF prediction models (e.g., the POSEIDON criteria). Additionally, the role of three-dimensional power Doppler with vascularization indices (flow index, vascularization index) should be explored, as these may be more sensitive than two-dimensional pulsed Doppler [20]. Finally, cost-effectiveness analyses comparing the AMH+AFC+RI strategy versus AMH alone in low-resource settings would inform health policy in countries like Pakistan.
CONCLUSION :
This study demonstrates that biochemical markers (AMH, FSH, inhibin B) and sonographic parameters (AFC, ovarian volume, stromal Doppler indices) are significantly correlated in infertile women. AMH and AFC are the strongest individual predictors of diminished ovarian reserve, with a correlation of 0.78. Stromal Doppler resistance index provides independent prognostic information, and a combined model including AMH, AFC, and RI achieves superior diagnostic accuracy (AUC 0.94) compared to any single marker. Inhibin B and FSH are less reliable. For clinical practice in settings like Gujranwala Medical College, we recommend a multimodal approach prioritizing AMH and AFC, with addition of stromal Doppler in borderline or discordant cases. This strategy may improve the precision of infertility evaluations and guide individualized fertility counseling.
BIBLIOGRAPHY:
1. Vander Borght M, Wyns C. Fertility and infertility: Definition and epidemiology. Clin Biochem. 2018;62:2-10. doi:10.1016/j.clinbiochem.2018.03.012
2. Pastore LM, Christianson MS, Stelling J, et al. Reproductive ovarian testing and the alphabet soup of diagnoses: DOR, POI, POF, POR, and FOR. J Assist Reprod Genet. 2018;35(1):17-23. doi:10.1007/s10815-017-1058-9
3. Broer SL, Broekmans FJ, Laven JS, et al. Anti-Müllerian hormone: ovarian reserve testing and its potential clinical implications. Hum Reprod Update. 2014;20(5):688-701. doi:10.1093/humupd/dmu020
4. Jirge PR. Ovarian reserve tests. J Hum Reprod Sci. 2011;4(3):108-113. doi:10.4103/0974-1208.92283
5. Dewailly D, Andersen CY, Balen A, et al. The physiology and clinical utility of anti-Müllerian hormone in women. Hum Reprod Update. 2014;20(3):370-385. doi:10.1093/humupd/dmt062
6. Nelson SM. Biomarkers of ovarian response: current and future applications. Fertil Steril. 2013;99(4):963-969. doi:10.1016/j.fertnstert.2012.11.054
7. Tal R, Seifer DB. Ovarian reserve testing: a user’s guide. Am J Obstet Gynecol. 2017;217(2):129-140. doi:10.1016/j.ajog.2017.02.027
8. Broekmans FJ, Kwee J, Hendriks DJ, et al. A systematic review of tests predicting ovarian reserve and IVF outcome. Hum Reprod Update. 2006;12(6):685-718. doi:10.1093/humupd/dml034
9. Kwee J, Schats R, McDonnell J, et al. The clomiphene citrate challenge test versus the exogenous follicle-stimulating hormone ovarian reserve test as a single test for identification of low responders and in vitro fertilization outcome. Fertil Steril. 2006;85(6):1714-1722. doi:10.1016/j.fertnstert.2005.11.071
10. Seifer DB, MacLaughlin DT. Inhibin B and anti-Müllerian hormone as markers of ovarian reserve. Reprod Biol Endocrinol. 2003;1:87. doi:10.1186/1477-7827-1-87
11. Ficicioglu C, Kutlu T, Baglam E, et al. Early follicular phase serum inhibin B and anti-Müllerian hormone levels as markers of ovarian reserve in women with normal basal FSH levels. J Obstet Gynaecol Res. 2011;37(7):816-822. doi:10.1111/j.1447-0756.2010.01420.x
12. Broekmans FJ, de Ziegler D, Howles CM, et al. The antral follicle count: practical recommendations for better standardization. Fertil Steril. 2010;94(3):1044-1051. doi:10.1016/j.fertnstert.2009.04.040
13. Coelho Neto MA, Ludwin A, Borrell A, et al. Counting ovarian antral follicles by ultrasound: a practical guide. Ultrasound Obstet Gynecol. 2018;51(1):10-20. doi:10.1002/uog.18945
14. Pavlik EJ, DePriest PD, Gallion HH, et al. Ovarian volume related to age. Gynecol Oncol. 2000;77(3):410-412. doi:10.1006/gyno.2000.5783
15. Merce LT, Bau S, Barco MJ, et al. Assessment of ovarian stromal blood flow using 3D power Doppler in women with low ovarian reserve. Ultrasound Obstet Gynecol. 2008;31(5):571-578. doi:10.1002/uog.5315
16. Kim JH, Jee BC, Lee JR, et al. Ovarian stromal Doppler indices as predictors of poor response to controlled ovarian stimulation in women with normal anti-Müllerian hormone levels. J Obstet Gynaecol Res. 2021;47(8):2845-2852. doi:10.1111/jog.14867
17. Raza S, Shaikh SA, Afzal M, et al. Prevalence and correlates of infertility in Pakistan: a systematic review. J Pak Med Assoc. 2020;70(12):2216-2222. doi:10.47391/JPMA.1234
18. Fleming R, Seifer DB, Frattarelli JL, et al. Correlation of serum anti-Müllerian hormone with antral follicle count in women undergoing fertility assessment: a meta-analysis. Reprod Biomed Online. 2015;31(5):634-642. doi:10.1016/j.rbmo.2015.08.002
19. Tinkanen H, Bläuer M, Laippala P, et al. Ovarian stromal blood flow and ovarian reserve in women with normal basal FSH levels. Acta Obstet Gynecol Scand. 2004;83(10):964-968. doi:10.1111/j.0001-6349.2004.00518.x
20. Raine-Fenning NJ, Campbell BK, Clewes JS, et al. The interobserver reliability of three-dimensional power Doppler data acquisition and analysis within the female pelvis. Ultrasound Obstet Gynecol. 2005;26(5):534-540. doi:10.1002/uog.2582