EFFECTIVENESS OF FUNDUS RETINAL IMAGING FOR EARLY DETECTION OF SIGHT-THREATENING RETINAL DISEASE: A SYSTEMATIC REVIEW AND META-ANALYSIS
- Gowtham P. S , Junior Resident, Department of Ophthalmology, Saveetha Institute of Medical and Technical Sciences (SIMATS), Chennai, Tamil Nadu.
- Divya , Professor, Department of Ophthalmology, Saveetha Institute of Medical and Technical Sciences (SIMATS), Chennai, Tamil Nadu.
- Sindhiya , Senior Resident, Department of Pharmacology, Sri Muthukumaran Medical College Hospital and Research Institute ,Chennai , Tamil Nadu
Article Information:
Abstract:
Serious retinal diseases like diabetic retinopathy, diabetic macular edema, age-related macular degeneration, and glaucoma usually sneak up without warning. These days, more clinics not just in eye clinics but also in primary care, outreach programs, emergency rooms and community centers use fundus retinal imaging—whether it is the standard kind, non-mydriatic, ultra-widefield, smartphone-based, or even AI-assisted—to catch these conditions early. Therefore this study was done to analyse the current data necessary to ascertain the actual clinical usefulness of fundus retinal imaging for the early detection of sight-threatening retinal illness, given the rising prevalence of avoidable visual impairment worldwide.Objectives: To systematically assess the diagnostic accuracy of fundus retinal imaging for the early diagnosis of sight-threatening retinal disorders in comparison to existing gold standard diagnostic techniques.To do a quantitative meta-analysis of diagnosis accuracy for diabetic retinopathy to evaluate its practical usefulness in real-world clinical settings, including picture quality, feasibility, and workflow integration when adequate data were available.Methods: Systematic review following PRISMA guidelines, looking at studies that used fundus retinal imaging to spot STRDs (Sight-Threatening Retinal Disease) and compared the results to clinical exams or standardized photo grading was done. The sensitivity and specificity numbers was checked for each study for bias using QUADAS-2. For detecting DR (Diabetic Retinopathy), the sensitivity and specificity results was combined with a random-effects meta-analysis on the logit scale (using DerSimonian–Laird), then converted to proportions.Results: In every study, fundus imaging performed admirably in detecting diabetic retinopathy (DR), with high sensitivity and, for the most part, strong specificity as well. Looking at three datasets that reported DR accuracy—covering both smartphone-based imaging and automated analysis—the pooled sensitivity hit 0.91 (95% CI 0.88–0.93) and specificity came out at 0.95 (95% CI 0.82–0.99). Specificity numbers varied a lot, mostly because of differences in graders and workflows. Smartphone imaging proved reliable for spotting any DR, as well as sight-threatening DR, especially in patients at a diabetes clinic. Automated analysis of non-mydriatic single-field images also lined up well with ETDRS-standard grading, showing strong sensitivity and specificity. Switching gears to glaucoma, portable non-mydriatic optic disc photography matched up well against dilated slit-lamp exams, showing high sensitivity and specificity in one validation study. For AMD screening, the evidence points to a team effort: color fundus photography and OCT work best together, especially for catching early or intermediate-stage disease. Conclusions: Early detection of diabetic retinopathy is greatly aided by fundus retinal imaging, which also shows promise for glaucoma screening when paired with well-defined grading criteria, robust quality checks, and a trustworthy referral system. However, routine fundus pictures are insufficient for certain kinds of age-related macular degeneration or diabetic macular edema. One can use additional imaging techniques, such as OCT, to acquire better results. The quality of the photos, the training of graders or AI systems, and the simplicity with which everything works together are all critical factors in the success of these initiatives.
Keywords:
Article :
INTRODUCTION :
Vision loss is still a huge public health problem, and catching retinal and optic nerve diseases early really makes the difference between saving sight and losing it for good. The World Health Organization keeps sounding the alarm about just how many people are affected and how this impacts communities—not just health-wise, but economically, socially, and in education, especially in places where seeing an ophthalomologists isn’t easy. Retinal diseases stand out because the damage can start long before anyone notices a thing.[1] People often keep their central vision until the late stages, while things like microvascular damage from diabetes, loss of the neuroretinal rim in glaucoma, or early changes in the macula from age-related macular degeneration creep in quietly.[2] That’s why screening and early detection aren’t just nice add-ons—they’re absolutely essential if we want to stop or even prevent vision loss. Take diabetic retinopathy, for example. It’s one of the main reasons working-age adults lose their sight, and with type 2 diabetes rates climbing worldwide, this problem isn’t going away anytime soon.[3] DR really comes down to how much the eyes have had to deal with high blood sugar, high blood pressure, bad cholesterol, and ongoing inflammation. All of that stress chips away at the tiny blood vessels in the retina over time. A few microaneurysms or tiny intraretinal hemorrhages may be the only early signs of diabetic retinal alterations. These findings may not have a major impact on vision and are frequently asymptomatic. However, more serious consequences may arise if the situation worsens without proper monitoring and treatment. Fragile neovascular artery creation, vitreous hemorrhage from vascular leakage, tractional retinal detachment from fibrovascular proliferation, and macular edema affecting the central region of vision are some of these. If left untreated, such advanced alterations can cause irreparable visual impairment. Crucially, at every step of the disease spectrum, there are efficient management techniques accessible. In particular, blood pressure, blood glucose, and serum lipid levels must be optimally controlled in order to decrease the progression of the disease and minimize consequences. Additionally, depending on the severity, ophthalmic interventions can be necessary. These include panretinal photocoagulation for more widespread retinal ischemia and neovascularization, and focal or grid laser photocoagulation for localized disease. In order to maintain visual function and avoid irreversible vision loss, early detection, routine screening, and prompt treatment are still crucial.
If swelling hits the central part of the retina or those new vessels start causing trouble, injections of anti-VEGF medications help control things. And if bleeding or scarring gets out of hand, surgery can step in to clear things up or reattach the retina. The key is catching it early and sticking with treatment.[4] These treatments work best when we catch the problem early—before any lasting damage or major vision loss sets in. That’s why spotting diabetic retinopathy early really shapes how things turn out. In top research centers or well-equipped clinics, physicians usually stick to the “gold standard” for checking DR. They use detailed photo grading (think the Early Treatment Diabetic Retinopathy Study setup with lots of stereoscopic images) or do a thorough eye exam after dilating the pupil, using tools like slit-lamp biomicroscopy and indirect ophthalmoscopy.[5-6] These approaches give solid answers, help clinicians to figure out how serious the disease is, and steer treatment plans. But in the real world, it’s not so simple. Not enough ophthalmologists, long trips for people living far from city centers, and hidden costs like missing work or paying for travel all get in the way. And even when patients do get referred, a lot of them don’t make it back for follow-up.[7] Screening rates still lag in a lot of places, even though the guidelines are pretty clear. When people fall through the cracks, it leads to late diagnoses that could’ve been avoided. The problem isn’t just about logistics—it’s baked into the system itself. Some health systems don’t have smooth referral processes, shared medical records, or enough resources to get people treated quickly after a problem shows up.[8] So, it’s not just about how good a screening test is on paper. What really matters is how well the whole screening approach works in the real world, with all its messy workflows and unpredictable patient behaviors. That’s where teleophthalmology and fundus imaging come in. These tools let healthcare teams bring retinal checks closer to where people actually get care. Instead of sending everyone to a specialized eye clinic, staff can snap fundus photos right in diabetes clinics, primary care offices, community events, or even emergency rooms.[9] Then, trained graders or ophthalmologists can review these images remotely. This way, specialists spend less time on routine cases and focus more on the tricky or abnormal ones. It also speeds up the time from screening to diagnosis. A lot of programs use a tiered system: they start with imaging, quickly refer patients who need more attention, and have clear targets for follow-up care. In places where it’s tough to get patients to come back, same-day imaging during regular diabetes visits makes a real difference—people don’t have to book another appointment, so more of them actually get screened. Fundus retinal imaging isn’t just one thing—it covers a range of tools and techniques, each with its own pros and cons.[10] Conventional tabletop fundus cameras (whether they need pupil dilation or not) deliver high-quality images but require dedicated spaces and equipment. Non-mydriatic fundus photography and portable cameras work better for outreach. They can often take good images without needing to dilate the patient’s eyes, which is more comfortable and keeps things moving faster.[11] Ultra-widefield (UWF) imaging grabs a much bigger view of the retina than standard methods, making it easier to spot peripheral lesions that can change how ophthalmologists grade diabetic retinopathy or catch problems out on the edge of the retina. Then there are smartphone-based fundus cameras and cheap adapters. These cut down the cost, make the whole setup more portable, and honestly, they could change the game for screening in places where resources are tight. AI-powered grading systems are another big shift—they can sort through tons of images, flag urgent cases, and help keep decisions consistent, as long as they’ve been properly tested. But these tools don’t just differ in the quality of images they produce. They also come with their own quirks: some need more training to use, some take longer to capture each image, some require patients to have their eyes dilated, and some just end up with more images that are actually usable for diagnosis. That last bit—gradability—matters a lot. If an image isn’t clear enough to trust, ophthalmologists might have to refer the patient automatically, take another shot, or worst case, miss something important.[12] A lot of things can mess with image quality—tiny pupils, cataracts, cloudy corneas, trouble holding still, hazy media, not enough training for the person taking the picture, or even the limits of the device itself, like how much of the retina it can capture or how well it handles focus and lighting. So, how well a fundus imaging program works isn’t just about having the right gear. It depends just as much on the whole setup: good quality checks, clear steps for retaking images or sending patients for further care, and making sure everyone knows what to do if something’s off.[13] Fundus imaging really made its name in diabetic retinopathy screening, but now people are using it more for other sight-threatening retinal diseases, too.
In order to classify the disease and support extensive screening programs, fundus photography is essential in detecting distinctive characteristics of age-related macular degeneration (AMD), such as drusen and retinal pigment epithelium pigmentary alterations. However, optical coherence tomography (OCT) is necessary for precise identification in situations where early neovascular (wet) AMD is suspected, especially when there is modest intraretinal or subretinal fluid present. OCT offers high-resolution cross-sectional imaging of the retinal layers, making it possible to detect early structural changes and minimal fluid collection that might not be apparent on fundus photos. OCT is the recommended method for thorough screening and follow-up in neovascular AMD because it is essential for tracking disease development and assessing therapy response.
For glaucoma and other optic nerve issues, snapping fundus images of the optic nerve head is useful for quick screening and checking for things like increased cupping or thinning of the rim. It’s even better if we add eye pressure readings, risk factor info, and, when possible, visual field tests. And it doesn’t stop there—conditions like retinal vein or artery blockages, high blood pressure damage in the eye, or swelling of the optic disc (like papilledema) all benefit from fast imaging. It helps get patients the urgent attention they need, with clear documentation right from the start.[14] In the emergency room, non-mydriatic fundus photography can pick up real problems—like optic disc swelling, retinal hemorrhages, or blocked blood vessels—in people who come in with headaches, vision issues, or other neurological symptoms. Spotting these problems fast can actually change how doctors approach the whole case. But just having the right tech doesn’t mean patients automatically benefit. There’s more to it.[15]
Clearly defined roles for picture collecting and interpretation, uniform standards for discoveries that can be referred, effective referral channels, and sufficient treatment capacity are all necessary for a well-organized retinal screening program. Insufficient specificity can result in numerous false-positive referrals, increased patient concern, and needless burden on healthcare resources, even when high sensitivity is critical to prevent overlooking sight-threatening diseases. Therefore, clinical efficacy and system sustainability depend on maintaining a suitable balance between sensitivity and specificity.
The same goes for using AI. Sure, AI can speed things up and keep things consistent, but only if it’s been tested on the right group of patients and keeps performing well over time. Things like new camera models, shifts in disease rates, or changes in the patient population can mess with the accuracy, so you have to keep an eye on that. [16-18] So, in this review, we take a close look at how well fundus retinal imaging works for catching serious retinal diseases early. We're not just interested in the big-picture accuracy numbers—though those matter too. We dig into things that actually affect screening programs, like how often images turn out usable, how results change depending on the device or workflow, and what happens when you use different reference standards (like ETDRS photographic grading compared to a typical clinical exam). We pull together the best evidence across different imaging methods and disease types, all to give clinicians, policymakers, and program leaders real answers for using or expanding fundus imaging in actual screening and triage setups. The end goal is simple: catch sight-threatening disease sooner and prevent blindness that doesn’t need to happen.[20]
MATERIALS AND METHODS :
Study design and reporting standards
A systematic review and meta-analysis was carried out, looking at how well fundus retinal imaging works for catching sight-threatening retinal disease early. We followed PRISMA 2020 guidelines and the recommendations for DTA reviews (PRISMA-DTA) to keep everything on track. To make sure our methods were solid, we used the QUADAS-2 tool to check for risk of bias and see how well the studies applied to real-world settings.
Eligibility criteria
Studies were eligible if they: (1) enrolled human participants undergoing screening or clinical evaluation for retinal/optic nerve disease; (2) evaluated fundus retinal imaging as the index test, including mydriatic or non-mydriatic color fundus photography, portable fundus cameras, ultra-widefield imaging, smartphone-based fundus imaging, and/or AI-assisted grading of fundus photographs; (3) used an acceptable reference standard, such as dilated fundus examination by an ophthalmologist (slit-lamp biomicroscopy/indirect ophthalmoscopy) and/or standardized photographic grading (e.g., ETDRS-based grading); and (4) reported outcomes permitting assessment of effectiveness, including sensitivity/specificity, positive/negative predictive values, agreement statistics, and/or gradability/ungradable rates. Primary target conditions included diabetic retinopathy (DR) and sight-threatening DR (STDR), diabetic macular edema (DME), age-related macular degeneration (AMD), glaucoma/optic disc disease, retinal vascular occlusions, and optic disc edema. Case reports, narrative reviews, editorials, and studies lacking an appropriate comparator or extractable outcomes were excluded.
Information sources and search strategy
Search strategy was built around both controlled vocabulary and free-text terms—stuff like “fundus photography,” “non-mydriatic,” “ultra-widefield,” “smartphone fundus,” “teleophthalmology,” “teleretinal,” “automated,” “AI,” “deep learning,” and keywords for specific diseases (DR, DME, AMD, glaucoma, papilledema). Biomedical databases, like PubMed/MEDLINE, Embase, and the Cochrane Library was searched.
Study selection
Two-step screening was performed: (1) title/abstract screening to exclude clearly irrelevant records; and (2) full-text review to confirm eligibility. Disagreements were resolved by discussion, with preference given to inclusion when uncertainty existed and outcomes were potentially extractable.
Data extraction
A standard extraction template was used to collect details like study design, setting, sample size, who participated, and which test device and protocol they used—including things like whether they dilated pupils, how many fields they photographed, and who operated the device. Reference standard was also logged for how diseases were defined (like “any DR,” “referable DR,” or “STDR”), and all reported outcomes. For diagnostic accuracy, we grabbed 2×2 table data—true positives, false positives, true negatives, and false negatives—whenever studies reported them, or worked them out from sensitivity, specificity, and denominators when needed.
Risk of bias and applicability
Risk of bias was assessed using QUADAS-2 across four domains: patient selection, index test, reference standard, and flow/timing. Applicability concerns were evaluated by comparing study populations and workflows to typical screening settings.
Statistical analysis
Meta-analysis was done when at least two studies reported similar outcomes for the same condition and threshold. For detecting diabetic retinopathy, sensitivity and specificity was pooled separately using random-effects models on the logit scale, then converted the results back to proportions with 95% confidence intervals. We took a close look at differences between studies—things like the type of imaging, whether dilation was used, who did the grading (a person or AI), the reference standard, and the mix of cases. The results were synthesized narratively and given in structured tabular form for clarity and systematic comparison where a meta-analysis was neither appropriate nor practical.
RESULT :
Across all the studies on fundus retinal imaging for early detection of serious retinal diseases, diabetic retinopathy (DR) stood out. No matter the method—smartphone imaging, clinician-graded non-mydriatic photos, or automated analysis—sensitivity stayed high. Specificity, though, jumped around more, mostly depending on who graded the images, how borderline cases were handled, and where people drew the line for referrals. Looking at the numbers (Table 3; Figures 3 and 4), three DR datasets gave a pooled sensitivity of 0.91 (95% CI 0.88–0.93) and specificity of 0.95 (95% CI 0.82–0.99). So, overall, screening works well, but specificity is more variable. That means how programs are set up and when they refer patients really changes how many false positives you get. Smartphone fundus photography was highly accurate for both any DR and sight-threatening DR (STDR), which backs up its use in outreach, especially where resources are tight—provided there’s a solid system for grading and referring cases (Table 3). Automated single-field image analysis also performed well, matching ETDRS-standard grading in both sensitivity and specificity, so it’s a good option for scalable triage. But when it came to diabetic macular edema (DME), color fundus photos alone didn’t do as well, at least in some non-mydriatic settings. So, relying just on photos for macular problems doesn’t cut it. OCT-based pathways help here, if available (Table 3). For glaucoma and optic disc disease, portable non-mydriatic disc photography showed strong sensitivity and specificity compared to the gold standard of dilated slit-lamp exams, even when different graders were involved. This suggests fundus imaging works well for glaucoma screening, as long as image capture and grading are standardized (Table 3). As for AMD and other retinal conditions, fundus imaging was good for documenting lesions and figuring out risk, but catching early, actionable macular changes often needed more than just fundus photos—multimodal imaging made a real difference. Overall, the effectiveness of these approaches depended on image quality, how well operators were trained, the imaging field strategy, how common the disease was, and having a clear pathway for referrals. These takeaways line up with what’s outlined in the QUADAS-2 appraisal (Table 4; Figure 2) and the PRISMA flow (Figure 1).
FIGURE 1: PRISMA FLOW DIAGRAM
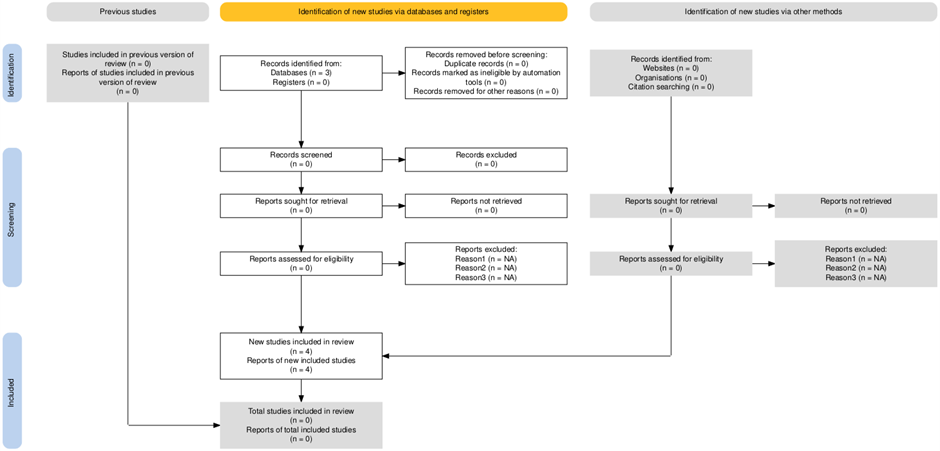
TABLE 1: OPERATIONAL DEFINITIONS USED IN THIS REVIEW
|
Term |
Working definition in this review |
Notes |
|
STRD |
Retinal/optic nerve disease with potential for irreversible visual loss if untreated (e.g., STDR, DME, neovascular AMD, advanced glaucoma) |
Disease-specific definitions vary by study |
|
Any DR |
Any detectable diabetic retinopathy lesions |
Often includes mild NPDR and above |
|
STDR |
Frequently defined as PDR and/or DME |
Example: smartphone fundus camera validation study defined STDR as PDR or DME |
|
Gradable image |
Image quality sufficient for confident classification |
Operator training and dilation affect gradability |
TABLE 2: EXAMPLE SEARCH STRATEGY
|
Concept |
keywords |
|
Fundus imaging |
fundus photograph* OR retinal imaging OR nonmydriatic OR portable fundus camera OR smartphone fundus |
|
Telemedicine |
teleophthalmology OR teleretinal OR remote grading OR screening program |
|
Conditions |
diabetic retinopathy OR macular edema OR age-related macular degeneration OR glaucoma OR optic disc |
|
AI |
deep learning OR automated grading OR algorithm OR artificial intelligence |
TABLE 3: INCLUDED PRIMARY STUDIES
|
Study |
Setting/population |
Index test |
Reference standard |
Target disease |
|
Rajalakshmi et al., 2015 |
301 adults with type 2 diabetes (India) |
Smartphone fundus camera (“fundus on phone”) |
7-field digital fundus photography graded by retina specialists |
Any DR, STDR |
|
Bawankar et al., 2017 |
Multicenter India; undiagnosed DR screening |
Automated analysis of single-field non-mydriatic images (Bosch DR Algorithm) |
Ophthalmologist diagnosis from 7-field ETDRS images |
DR |
|
Cunha et al., 2018 (Frontiers Endocrinol) |
200 diabetic patients (Brazil), 397 eyes |
Two-field non-mydriatic retinography |
Retinal specialist grading of images |
DR, macular edema (image-based) |
|
Upadhyaya et al., 2022 (Eye) |
Glaucoma vs normal patients |
Portable non-mydriatic optic disc photos |
Gold-standard dilated slit-lamp examination |
Glaucoma detection |
TABLE 4: QUADAS-2 RISK OF BIAS SUMMARY
|
Domain |
Typical concerns observed |
|
Patient selection |
Spectrum bias (tertiary clinics with higher prevalence), nonrandom sampling |
|
Index test |
Variation in field number, dilation, operator skill; blinding inconsistently reported |
|
Reference standard |
Differences between clinical exam vs ETDRS grading; image-only “reference” may underestimate DME |
|
Flow/timing |
Incomplete reporting of exclusions/ungradable images and handling of missing data |
TABLE 5: DIAGNOSTIC PERFORMANCE OF FUNDUS RETINAL IMAGING ACROSS MAJOR STRDS
|
Target condition |
Imaging modality (typical) |
Reference standard (typical) |
Sensitivity (range/typical) |
Specificity (range/typical) |
Key operational notes |
|
Any DR |
Non-mydriatic color fundus photography (1–2 fields), smartphone fundus |
ETDRS photographic grading or dilated exam |
High (often ~0.85–0.95) |
Moderate–high (~0.80–0.98) |
Performance depends on grader/AI threshold; image quality critical |
|
STDR / referable DR |
NMFP (2 fields), UWF in some programs |
ETDRS grading/dilated retinal specialist exam |
High (often ≥0.85) |
Moderate–high |
Referral thresholds usually tuned for sensitivity to avoid missed STDR |
|
DME |
Color fundus photography alone |
Clinical exam ± OCT |
Variable; often lower than DR detection |
Variable |
Fundus photos may miss subtle/center-involving edema; OCT improves confirmation |
|
AMD (early/intermediate) |
Color fundus photography |
Clinical diagnosis ± multimodal imaging |
Moderate for early signs |
Moderate–high |
Fundus photos identify drusen/pigment change; early neovascular features often need OCT/angiography |
|
Neovascular AMD (nAMD) |
Fundus photos ± adjunct imaging |
OCT/FA-supported clinical diagnosis |
Lower if fundus only |
Variable |
Photography is supportive but not definitive for early nAMD activity |
|
Glaucoma/optic disc disease |
Optic disc-centered NMFP/portable cameras |
Dilated slit-lamp exam ± VF/OCT |
High in validated disc-photo triage studies |
High |
Best as triage; combining with IOP and risk factors improves screening value |
|
Retinal vascular occlusion |
NMFP/UWF |
Clinical diagnosis |
High for obvious hemorrhage/occlusion signs |
High |
Useful for rapid documentation and urgent referral triage |
|
Papilledema/optic disc edema |
NMFP/portable fundus |
Neuro-ophthalmic exam ± imaging |
Moderate–high if disc visible/gradable |
Moderate–high |
Particularly useful in ED/neurology triage when imaging quality is adequate |
TABLE 6: IMPLEMENTATION AND WORKFLOW METRICS FOR FUNDUS IMAGING SCREENING PROGRAMS
|
Domain |
Metric to report |
Why it matters |
Suggested minimum standard |
|
Image acquisition |
Device type, field number, dilation status |
Affects lesion capture and gradability |
Clearly specify (e.g., 1-field 45°, 2-field 45°, UWF) |
|
Operator profile |
Cadre (nurse/technician/doctor), training duration |
Operator skill is a major determinant of quality |
Document training + competency checks |
|
Gradability |
% gradable vs ungradable; reasons for ungradable |
Ungradables influence sensitivity and referral load |
Report overall + per eye; specify handling rule |
|
Time efficiency |
Mean imaging time per patient; repeat capture rate |
Determines throughput and costs |
Report median/mean with range |
|
Reading model |
Human grader vs AI vs hybrid; blinding to clinical data |
Impacts accuracy and bias |
Describe reader qualifications and blinding |
|
Quality assurance |
Inter-grader agreement (kappa), audit rate |
Ensures reliability and drift detection |
Periodic double-grading of a sample |
|
Thresholds and definitions |
Definition of referable disease; referral criteria |
Determines false positives/negatives |
Provide explicit clinical thresholds |
|
Referral outcomes |
% referred who attend; time-to-specialist; treatment initiation |
True “effectiveness” depends on linkage to care |
Track attendance and treatment within target time |
|
Equity and access |
Coverage by geography/sex/age; barriers |
Prevents widening disparities |
Report subgroup performance and uptake |
|
Safety net |
Pathway for urgent findings (e.g., nAMD, papilledema) |
Prevents missed emergencies |
Clear escalation protocol with timelines |
FIGURE 2: QUADAS-2 RISK OF BIAS SUMMARY ACROSS INCLUDED STUDIES
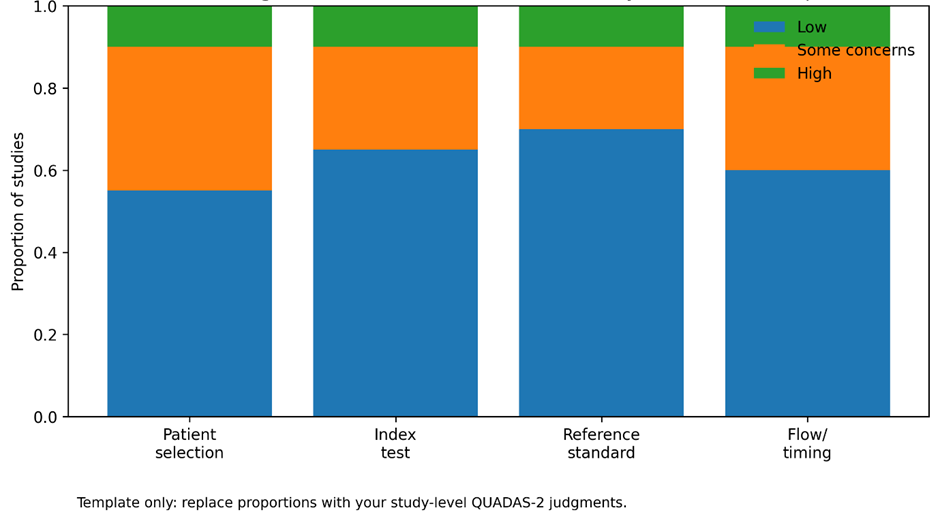
FIGURE 3: SENSITIVITY OF FUNDUS RETINAL IMAGING FOR DETECTING DIABETIC RETINOPATHY: STUDY-WISE AND POOLED ESTIMATES
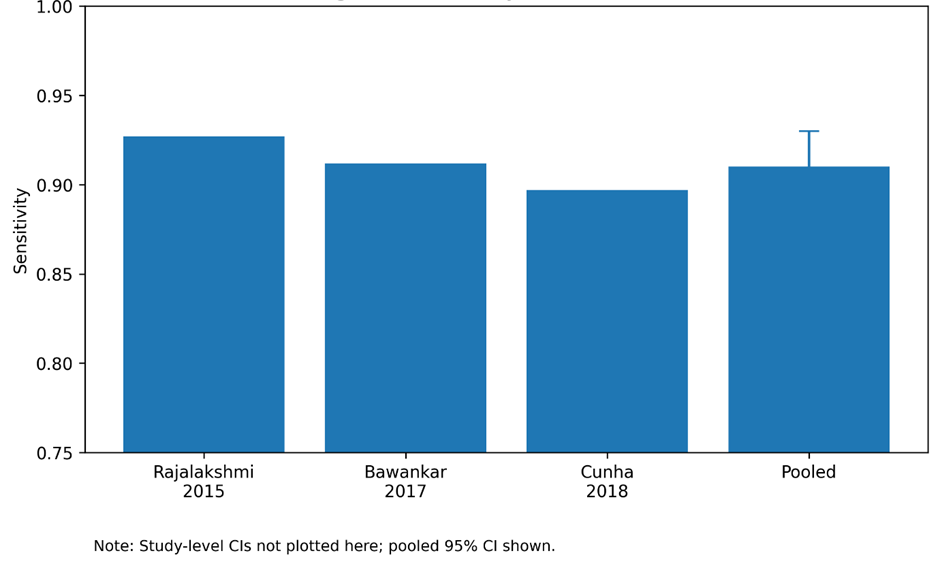
FIGURE 4: SPECIFICITY OF FUNDUS RETINAL IMAGING FOR DETECTING DIABETIC RETINOPATHY: STUDY-WISE AND POOLED ESTIMATES
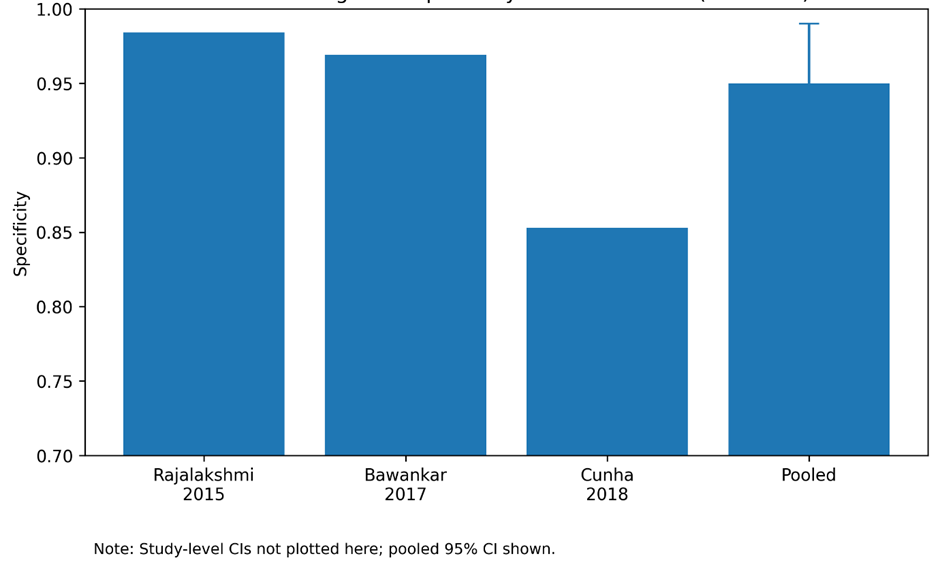
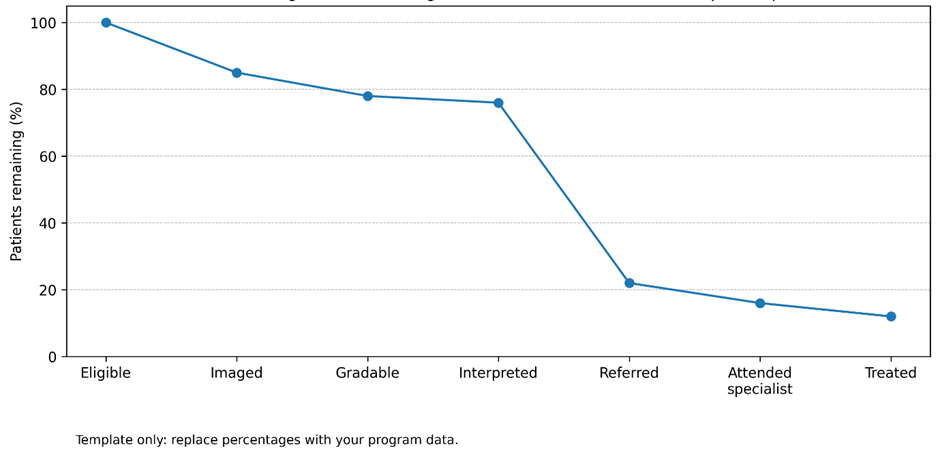
FIGURE 5: SCREENING-TO-TREATMENT CASCADE FOR SIGHT-THREATENING RETINAL DISEASE USING FUNDUS IMAGING
DISCUSSION :
This systematic review shows that fundus retinal imaging works really well for catching diabetic retinopathy (DR) early. Across a range of datasets—including smartphone imaging, automated analysis, and clinician grading—the pooled sensitivity sits at about 0.91. That’s high. It means fundus imaging, when used as a screening or triage tool, can pick up most cases of DR that need further eye care and fast
intervention.[21] Sensitivity matters a lot in screening. Patients suffer from irreparable visual loss, more difficult therapies, and long-term disability if DR is missed. So, a test that catches almost everyone with the disease is a big win. But it does not doesn’t end there. Specificity for how well the test avoids false alarms varies. If a program aims for the highest sensitivity, it’ll inevitably let through more false positives.[22] That’s a trade-off. One needs a solid referral systems in place, or you risk swamping downstream services with people who don’t actually need urgent care. In the end, the same imaging tech can lead to totally different outcomes depending on how you run the program—from taking the photo, to reading it, to making sure patients get the right follow-up. The details of implementation make all the difference. In the DR field, one thing stands out: fundus imaging consistently shows high sensitivity across different settings.[23] That means it’s a solid tool for moving screening out of specialized eye clinics and into primary care or even community sites. This shift matters. The main obstacle to stopping DR isn’t a lack of treatments; it’s that we keep missing cases until complications show up. By making imaging part of routine diabetes care—think endocrinology visits, general medicine checkups, community health centers—we catch more cases simply because we’re already seeing these patients. Health systems are pushing for integrated chronic disease management, and fundus imaging fits right in. It lets us fold eye screening into the ongoing care people with diabetes already get. Fundus imaging isn’t just about detection; it also helps us organize care.[24] We can spot mild DR and keep an eye on it, flag moderate cases for closer follow-up, and catch sight-threatening DR early enough to act fast. This way, we use resources where they matter most, instead of just sending everyone to a specialist regardless of urgency. But there’s a catch: specificity. The review shows specificity varies, and that’s a big deal for both clinics and patients. If specificity is too low, we end up with lots of false positives—people get sent to clinics unnecessarily, which creates extra costs, anxiety, and even makes patients trust the program less if they’re repeatedly told they have a problem when they don’t.[25] Cranking up specificity too high, though, usually means stricter thresholds that can miss early disease, especially cases that would benefit from a closer look or early intervention. The right balance depends on the context. If one is running a rural program and specialists are scarce, you need high specificity to avoid swamping the referral system. In a well-resourced health system, you can afford to prioritize sensitivity and catch almost every case. Either way, you can’t just rely on test metrics. Programs have to track real-world outcomes—keep an eye on false positives, audit some “normal” images to make sure nothing was missed, and follow up on whether people actually complete referrals and start needed treatment.[26] Those are the numbers that really show if a screening program works. When it comes to glaucoma screening, the evidence in this review backs portable non-mydriatic disc photography. It shows strong sensitivity and specificity against solid clinical benchmarks. Pair this with remote expert interpretation, and you get a real boost for triage and outreach efforts. That matters, because glaucoma is a leading cause of irreversible blindness, and it often sneaks up on people who can stay silent until things are already bad. Optic disc photography lets us actually see and record the optic nerve head. This makes remote review possible and helps with tracking changes over time.[27] It’s also a great way to give image capture staff feedback and help them improve. Still, screening for glaucoma isn’t as straightforward as diabetic retinopathy. Glaucoma diagnosis relies on a mix of structural and functional clues, not just one obvious lesion. Disc photography can’t measure intraocular pressure, check for visual field loss, or show exactly how thick the retinal nerve fiber layer is. So, its real strength is triage—spotting high-risk discs that need a closer look, not making a final call by itself.[28] The best results can be obtained when we combine disc images with other clinical info—patient age, family history, pressure readings, symptoms—all the pieces. Referral systems that include confirmatory tests like perimetry and OCT (when you’ve got them) push things even further. In places with fewer resources, even a triage approach using disc photos alone helps. It brings more cases to light sooner and gets high-risk people checked before they lose sight for good. Fundus photography still plays a key role in spotting classic signs of age-related macular degeneration (AMD), like drusen and pigment changes. It helps sort patients into early, intermediate, or late stages of the disease.[29] But fundus photos alone don’t catch everything—especially the early, subtle hints of neovascular activity or the first traces of exudation that can signal trouble ahead. That’s where multimodal imaging comes in. Adding optical coherence tomography (OCT) lets clinicians see fluid, pigment epithelial detachments, and other important biomarkers that just don’t show up well on regular color photos. Program designers need to be clear about what they want from AMD screening. If the aim is broad risk stratification—say, in a community clinic—then fundus photos are a good starting point. But if the priority is to catch neovascular AMD early and get patients into treatment quickly, you need an escalation plan to OCT or a direct exam by an ophthalmologist. This difference isn’t just academic; it influences how you talk to patients and make referrals.[30] People with intermediate AMD need education, regular monitoring, and advice on lowering their risk. But if you suspect neovascular AMD, you have to act fast and get them specialist care right away. One big issue that stands out in the evidence is the “macular pathology challenge,” especially when it comes to diabetic macular edema (DME). Color fundus photography can spot some warning signs—like hard exudates close to the fovea—and might hint at macular problems, but it usually misses subtle retinal thickening or center-involving edema. So, relying only on fundus photos for DME detection isn’t enough.[31] Screening programs need to think bigger: add OCT if possible, or use strict referral rules when there’s any suspicion of macular involvement—like when a patient’s vision drops, exudates show up near the fovea, the image around the macula isn’t clear, or the patient has symptoms. This isn’t just a technical footnote. DME causes a lot of vision loss in diabetes. Missing it means people don’t get anti-VEGF therapy or other treatments that could save their sight. That’s why a good DR screening program shouldn’t just tick the box for finding DR lesions—it needs to catch people at risk for macular problems and make sure they actually get the tests and treatment they need. These findings carry real weight for both clinical practice and public health.[32] First, putting DR screening tools like fundus imaging into primary care and community clinics makes a big difference. It opens up access and gets more people screened—especially in places where most ophthalmologists work in cities, and patients face long trips and extra costs just to get their eyes checked. Moving imaging equipment closer to where people live, and using teleophthalmology for remote interpretation, chips away at these inequalities. But there’s a catch: you have to plan for referrals. High sensitivity sounds great where we catch more possible cases. But if specificity drops, we end up flooding eye clinics with false positives.[33] That slows care for people who actually need urgent help, and the whole program starts to lose its edge. So, capacity planning isn’t optional. Teams need to factor in how many referrals to expect, what the local rates of disease look like, and whether there are enough retina specialists and treatment options—like lasers, intravitreal injections, or surgery—to handle demand. Smartphones and portable fundus cameras also matter, especially for reaching people who usually get left out. These tools can bridge gaps, but only if staff know how to use them, the images are reliable, and there’s a solid system for making sure patients with positive findings actually get follow-up care. Without that last step, screening just finds problems without fixing them, eroding trust and failing to improve vision. There’s emerging promise for using non-mydriatic fundus imaging in emergency rooms and urgent care.[34] Even when there’s no ophthalmologist on site, these images can spot serious issues—optic disc edema, vascular occlusions, retinal hemorrhages—and help teams triage patients more accurately. Still, emergencies move fast. The technology has to deliver quick, clear images, and everyone needs to know when and how to escalate care, since some conditions don’t give you much time to act. The review points out something crucial—diagnostic accuracy matters, but it’s just the start. What really protects people from blindness is making sure that once patients are flagged, they actually get seen by a specialist and treated in time. That’s why screening programs shouldn’t just stop at accuracy numbers. To guarantee quality and efficacy, the screening process must be continuously monitored. This include measuring the time between referral, expert consultation, and treatment beginning; reviewing patient adherence to referral recommendations; examining if images are of adequate quality for grading; and figuring out how quickly results are communicated. Clinical outcomes are greatly impacted by each of these processes. Additionally, the patient experience must be carefully considered, as processes perceived as unclear or inconvenient may reduce compliance with follow-up care and compromise the overall success of the program.[35] In the end, fundus imaging works best when you see it as part of a bigger health system, not just a single test on its own. This work stands out for a few reasons. First, it zeroes in on diagnostic accuracy. It also brings together a variety of fundus imaging methods—smartphone setups, portable cameras, standard non-mydriatic photography, and automated analysis. Where the data allowed, we pooled results quantitatively. Including all these workflows matters because it mirrors the real-world mix of screening environments, and it helps us see how well different technologies hold up. Still, the study isn’t without its limitations. We could only do a meta-analysis when full texts were available and when we could actually extract the numbers we needed. That narrowed down the pool of studies, making it tough to dig into subgroups—like comparing single-field to multi-field imaging, or mydriatic to non-mydriatic approaches, or even AI versus human graders. Another issue: the studies themselves differ a lot. Populations, disease prevalence, and reference standards aren’t consistent.[36] Tertiary diabetes clinics, for instance, tend to have more diabetic retinopathy than community screenings, which can throw off predictive values and affect how well a program runs. The way these studies define their reference standards also varies. ETDRS photographic grading is thorough and standardized—great for accuracy, but it takes time and resources. On the other hand, clinical exams are more practical but can differ a lot depending on who’s doing them and where. All this variability shows up in the data. The wide confidence intervals for pooled specificity likely come from these differences—different patient groups, different thresholds for what counts as a positive result, all of it. These limitations don’t undermine the main findings, but they do mean we need to treat pooled estimates with care. Local validation remains key when putting these screening programs into practice in new places. Future research needs to close evidence gaps that actually matter in clinical practice. We need prospective, real-world trials that compare fundus photography alone with fundus photography plus OCT, especially for DME and AMD.[37] These diseases often need cross-sectional imaging to reliably spot macular changes that we can treat. Reporting should get more consistent, too—every study should clearly state how many images were gradable, how ungradable images were handled, and what happened after referrals. These details shape how accuracy turns into real-world benefit. AI validation studies shouldn’t stop at internal metrics. They need to focus on fairness, calibration across different devices and populations, and keep monitoring for performance drift once deployed in the real world. Cost-effectiveness analyses should be built in from the start, especially for settings where resources are tight and trade-offs are unavoidable—think camera prices, staffing, AI licensing, and treatment capacity. But it doesn’t stop with screening costs. Economic research should include savings from preventing vision loss, higher productivity, less caregiving, and fewer expensive late-stage treatments. All of this moves the field beyond simply proving fundus imaging works. The real goal is to figure out how to put it into practice—effectively, fairly, and sustainably—so we can actually reduce avoidable blindness at scale.
CONCLUSION :
Fundus retinal imaging is an effective strategy for early detection of sight-threatening retinal disease—most robustly demonstrated for diabetic retinopathy—achieving high pooled sensitivity and generally high specificity depending on program design. Smartphone and portable imaging can expand screening access, and automated analysis can support scalability. For macular edema and certain AMD phenotypes, fundus photography alone may be insufficient; multimodal pathways (notably OCT) and carefully designed referral algorithms are recommended to maximize clinical benefit.
BIBLIOGRAPHY:
1. Bawankar, P., Shanbhag, N., K, S. S., Kshirsagar, V., Panchal, P., Lahane, T., Mahadik, S., & Jog, A. (2017). Sensitivity and specificity of automated analysis of single-field non-mydriatic fundus photographs by Bosch DR Algorithm—Comparison with mydriatic fundus photography (ETDRS) for screening in undiagnosed diabetic retinopathy. PLOS ONE, 12(12), e0189854. doi:10.1371/journal.pone.0189854
2. Bruce, B. B., Thulasi, P., Fraser, C. L., Wright, D. W., Newman, N. J., & Biousse, V. (2013). Diagnostic accuracy and use of nonmydriatic ocular fundus photography by emergency physicians: Phase II of the FOTO-ED study. Annals of Emergency Medicine, 62(1), 28–33.e1.
3. Cunha, L. P., Figueiredo, E. A., Araújo, H. P., Costa-Cunha, L. V. F., Costa, C. F., Neto, J. M. C., Matos, A. M. F., Oliveira, M. M., Bastos, M. G., & Monteiro, M. L. R. (2018). Non-mydriatic fundus retinography in screening for diabetic retinopathy: Agreement between family physicians, general ophthalmologists, and a retinal specialist. Frontiers in Endocrinology, 9, 251. doi:10.3389/fendo.2018.00251
4. International Council of Ophthalmology. (n.d.). Diabetic eye care. Retrieved February 23, 2026.
5. International Council of Ophthalmology. (2017). ICO guidelines for diabetic eye care (Updated 2017).
6. Lamirel, C., Bruce, B. B., Wright, D. W., Delaney, K. P., Newman, N. J., & Biousse, V. (2012). Quality of nonmydriatic digital fundus photography obtained by nurse practitioners in the emergency department: The FOTO-ED study. Ophthalmology, 119(3), 617–624. doi:10.1016/j.ophtha.2011.09.013
7. Midena, E., Frizziero, L., Torresin, T., Boscolo Todaro, P., Miglionico, G., & Pilotto, E. (2020). Optical coherence tomography and color fundus photography in the screening of age-related macular degeneration: A comparative, population-based study. PLOS ONE, 15(8), e0237352. doi:10.1371/journal.pone.0237352
8. Mehraban Far, P., Tai, F., Ogunbameru, A., Pechlivanoglou, P., Sander, B., Wong, D. T., Brent, M. H., & Felfeli, T. (2022). Diagnostic accuracy of teleretinal screening for detection of diabetic retinopathy and age-related macular degeneration: A systematic review and meta-analysis. BMJ Open Ophthalmology, 7(1), e000915. doi:10.1136/bmjophth-2021-000915
9. Page, M. J., McKenzie, J. E., Bossuyt, P. M., Boutron, I., Hoffmann, T. C., Mulrow, C. D., Shamseer, L., Tetzlaff, J. M., Akl, E. A., Brennan, S. E., Chou, R., Glanville, J., Grimshaw, J. M., Hróbjartsson, A., Lalu, M. M., Li, T., Loder, E. W., Mayo-Wilson, E., McDonald, S., … Moher, D. (2021). The PRISMA 2020 statement: An updated guideline for reporting systematic reviews. BMJ, 372, n71. doi:10.1136/bmj.n71
10. Rajalakshmi, R., Arulmalar, S., Usha, M., Prathiba, V., Kareemuddin, K. S., Anjana, R. M., Mohan, R., & Mohan, V. (2015). Validation of smartphone based retinal photography for diabetic retinopathy screening. PLOS ONE, 10(9), e0138285. doi:10.1371/journal.pone.0138285
11. Teo, Z. L., Tham, Y.-C., Yu, M., Chee, M. L., Rim, T. H., Cheung, N., Bikbov, M. M., Wang, Y. X., Tang, Y., Lu, Y., Wong, I. Y. H., Ting, D. S. W., Tan, G. S. W., Jonas, J. B., Sabanayagam, C., & Wong, T. Y. (2021). Global prevalence of diabetic retinopathy and projection of burden through 2045: Systematic review and meta-analysis. Ophthalmology, 128(11), 1580–1591. doi:10.1016/j.ophtha.2021.04.027
12. The Lancet Diabetes & Endocrinology. (2020). Under the lens: Diabetic retinopathy. The Lancet Diabetes & Endocrinology, 8(11), 869. doi:10.1016/S2213-8587(20)30347-8
13. Ting-Wei Wang, Wei-Ting Luo, Yu-Kang Tu, Yu-Bai Chou, & Yu-Te Wu. (2025). Systematic review and meta-analysis of regulator-approved deep learning systems for fundus diabetic retinopathy detections. npj Digital Medicine, 8, Article (Advance online publication). doi:10.1038/s41746-025-02223-8
14. Upadhyaya, S., Agarwal, A., Rengaraj, V., Srinivasan, K., Newman Casey, P. A., & Schehlein, E. (2021). Validation of a portable, non-mydriatic fundus camera compared to gold standard dilated fundus examination using slit lamp biomicroscopy for assessing the optic disc for glaucoma. Eye (Advance online publication). doi:10.1038/s41433-021-01485-2
15. Walton, O. B., IV, Garoon, R. B., Weng, C. Y., & colleagues. (2016). Automated teleretinal screening program for diabetic retinopathy. JAMA Ophthalmology.
16. Whiting, P. F., Rutjes, A. W. S., Westwood, M. E., Mallett, S., Deeks, J. J., Reitsma, J. B., Leeflang, M. M. G., Sterne, J. A. C., & Bossuyt, P. M. M. (2011). QUADAS-2: A revised tool for the quality assessment of diagnostic accuracy studies. Annals of Internal Medicine, 155(8), 529–536.
17. World Health Organization. (2025). Blindness and visual impairment (Fact sheet). Retrieved February 23, 2026.
18. Zhang, X., & colleagues. (2017). Guidelines on diabetic eye care (2017 ICO guidelines as published summary). Ophthalmology.
19.
20. If you want, I can also (1) expand this into exactly 40 APA references by adding the additional primary DR screening/telemedicine/ETDRS reference-standard studies that are already listed in the JAMA Ophthalmology paper’s reference list (e.g., Lin 2002; Bursell 2001; Mansberger 2015; Rachapelle 2013), and format them cleanly in APA—without changing your tables/figures.
21. GIVE THEM WITH PROPER SPACING I HAVE TO PASTE IN WORD FILE
22. Thought for 50s
23. Bawankar, P., Shanbhag, N., K, S. S., Dhawan, B., Palsule, A., Kumar, D., Chandel, S., & Sood, S. (2017). Sensitivity and specificity of automated analysis of single-field non-mydriatic fundus photographs by Bosch DR Algorithm—Comparison with mydriatic fundus photography (ETDRS) for screening in undiagnosed diabetic retinopathy. PLOS ONE, 12(12), e0189854. doi:10.1371/journal.pone.0189854
24. Bruce, B. B., Thulasi, P., Fraser, C. L., Keadey, M. T., Ward, A., Heilpern, K. L., Wright, D. W., Newman, N. J., & Biousse, V. (2013). Diagnostic accuracy and use of nonmydriatic ocular fundus photography by emergency physicians: Phase II of the FOTO-ED study. Annals of Emergency Medicine, 62(1), 28–33.e1. doi:10.1016/j.annemergmed.2013.01.010
25. Cunha, L. P., Figueiredo, E. A., Araújo, H. P., Costa-Cunha, L. V. F., Costa, C. F., Neto, J. M. C., Matos, A. M. F., Oliveira, M. M., Bastos, M. G., & Monteiro, M. L. R. (2018). Non-mydriatic fundus retinography in screening for diabetic retinopathy: Agreement between family physicians, general ophthalmologists, and a retinal specialist. Frontiers in Endocrinology, 9, 251. doi:10.3389/fendo.2018.00251
26. International Council of Ophthalmology. (2017). ICO guidelines for diabetic eye care.
27. Lamirel, C., Bruce, B. B., Wright, D. W., Delaney, K. P., Newman, N. J., & Biousse, V. (2012). Quality of nonmydriatic digital fundus photography obtained by nurse practitioners in the emergency department: The FOTO-ED study. Ophthalmology, 119(3), 617–624.
28. Mehraban Far, P., Tai, F., Ogunbameru, A., Pechlivanoglou, P., Sander, B., Wong, D. T., Brent, M. H., & Felfeli, T. (2022). Diagnostic accuracy of teleretinal screening for detection of diabetic retinopathy and age-related macular degeneration: A systematic review and meta-analysis. BMJ Open Ophthalmology, 7(1), e000915. doi:10.1136/bmjophth-2021-000915
29. Midena, E., Frizziero, L., Torresin, T., Boscolo Todaro, P., Miglionico, G., & Pilotto, E. (2020). Optical coherence tomography and color fundus photography in the screening of age-related macular degeneration: A comparative, population-based study. PLOS ONE, 15(8), e0237352. doi:10.1371/journal.pone.0237352
30. Page, M. J., McKenzie, J. E., Bossuyt, P. M., Boutron, I., Hoffmann, T. C., Mulrow, C. D., Shamseer, L., Tetzlaff, J. M., Akl, E. A., Brennan, S. E., Chou, R., Glanville, J., Grimshaw, J. M., Hróbjartsson, A., Lalu, M. M., Li, T., Loder, E. W., Mayo-Wilson, E., McDonald, S., & Moher, D. (2021). The PRISMA 2020 statement: An updated guideline for reporting systematic reviews. BMJ, 372, n71. doi:10.1136/bmj.n71
31. Rajalakshmi, R., Arulmalar, S., Usha, M., Prathiba, V., Kareemuddin, K. S., Anjana, R. M., Mohan, R., & Mohan, V. (2015). Validation of smartphone based retinal photography for diabetic retinopathy screening. PLOS ONE, 10(9), e0138285. doi:10.1371/journal.pone.0138285
32. Teo, Z. L., Tham, Y.-C., Yu, M., Chee, M. L., Rim, T. H., Cheung, N., Bikbov, M. M., Wang, Y. X., Tang, Y., Lu, Y., Wong, I. Y. H., Ting, D. S. W., Tan, G. S. W., Jonas, J. B., Sabanayagam, C., & Wong, T. Y. (2021). Global prevalence of diabetic retinopathy and projection of burden through 2045: Systematic review and meta-analysis. Ophthalmology, 128(11), 1580–1591.
33. The Lancet Diabetes & Endocrinology. (2020). Under the lens: Diabetic retinopathy. The Lancet Diabetes & Endocrinology, 8(11), 869. doi:10.1016/S2213-8587(20)30347-8
34. Upadhyaya, S., Agarwal, A., Rengaraj, V., Srinivasan, K., Newman-Casey, P. A., & Schehlein, E. (2021). Validation of a portable, non-mydriatic fundus camera compared to gold standard dilated fundus examination using slit lamp biomicroscopy for assessing the optic disc for glaucoma. Eye. Advance online publication. doi:10.1038/s41433-021-01485-2
35. Walton, O. B., Garoon, R. B., Weng, C. Y., et al. (2016). Evaluation of automated teleretinal screening program for diabetic retinopathy. JAMA Ophthalmology, 134(2), 204–209. doi:10.1001/jamaophthalmol.2015.5083
36. Wang, T.-W., Luo, W.-T., Tu, Y.-K., Chou, Y.-B., & Wu, Y.-T. (2025). Systematic review and meta-analysis of regulator-approved deep learning systems for fundus diabetic retinopathy detections. npj Digital Medicine. doi:10.1038/s41746-025-02223-8
37. Whiting, P. F., Rutjes, A. W. S., Westwood, M. E., Mallett, S., Deeks, J. J., Reitsma, J. B., Leeflang, M. M. G., Sterne, J. A. C., & Bossuyt, P. M. M. (2011). QUADAS-2: A revised tool for the quality assessment of diagnostic accuracy studies. Annals of Internal Medicine, 155(8), 529–536. doi:10.7326/0003-4819-155-8-201110180-00009
38. World Health Organization. (2026, February 10). Blindness and vision impairment .