AQbD-Directed Development and Validation of RP-HPLC Method of Dapagliflozin Quantitative Estimation.
- Aaknsha V. Sonawane , Sandip University, School of Pharmaceutical Sciences, Sandip University, Nashik, (MH)-443201, India
- Prashik B.Dudhe , Sandip University, School of Pharmaceutical Sciences, Sandip University, Nashik, (MH)-443201, India
- Hrushikesh M. Suryawanshi , Sandip University, School of Pharmaceutical Sciences, Sandip University, Nashik, (MH)-443201, India
- Deep K. Puranik , Sandip University, School of Pharmaceutical Sciences, Sandip University, Nashik, (MH)-443201, India
- Rajeshwari V. Tambe , Sandip University, School of Pharmaceutical Sciences, Sandip University, Nashik, (MH)-443201, India
- Abhijeet D. Kulkarni , Sandip University, School of Pharmaceutical Sciences, Sandip University, Nashik, (MH)-443201, India
Article Information:
Abstract:
Quality by design The bulk and tablet dosage form of the dapagliflozin content was to be determined using reversed-phase high-performance liquid chromatography (RP-HPLC) which is a novel basic, sensitive, suitable, accurate, and sturdy reversed-phase high-performance liquid chromatography. The Central Composite Design was used to optimize the chromatographic condition. HPLC system and Chromeleon 7.3 software and agilent-zorbax c18 column (250 mm x 4.6mm; 5um) were used to do fractionation. The reading was done at 223 nm. The Phosphate buffer Acetonitrile (50:50) v/v and the flow rate of 1.0 mL/min was used at the mobile phase in the developed RP-HPLC method and retention time of 3.7 min. The degree of accuracy, preciseness, specificity, linearity, and robustness were observed to be justified by the results of the analysis in the method. The linear procedure that was obtained was found to be linear and the correlation coefficient (r2) was 0.9998. RSD method was discovered to have a lower error of less than 2.0%. The percent of recoveries of dapagliflozin were identified to be 99.88. The suggested plan was average predictive forecasting and robust. It was quite predictive and logical in the suggested approach.
Keywords:
Article :
INTRODUCTION:
The prevalence of diabetes is presently 463 million individuals in the world and is projected to hit 700 million people by the year 2045.[1]. DM is a complicated and chronic condition that requires sustained medical care and other multifactorial approaches to mitigating risks as well as glycemic regulation [2-3].
Dapagliflozin inhibits this transporter and thereby, decreases the reabsorption of glucose into blood in the kidneys; causes the excess glucose to leak into the urine (glucosuria) and this is independent of the production or the insulin-sensitizing activity, unlike other conventional antihyperglycemic agents which increase the effects of insulin production or sensitivity.
The central composite design (CCD) is an effective weapon in optimization of desirable elements. CCD recommends the value of optimal variables, the most appropriate and preferable answer and set process conditions which are not sensitive to intentional variations in factor settings. It is also an expression of a mathematical representation between the response and the critical variables therefore it will be able to predict the response with low error that is propagated to the response [9-13].
Most of them have reported (RP -HPLC) procedures which were used to quantitatively determine the dapagliflozin concentrations of bulk drug and pharmaceutical dosage preparations.
A majority of the used techniques used C18 stationary phases, using methanol or acetonitrile as constituents of the mobile phase. In other chromatographic conditions, dapagliflozin demonstrated reproducible retention times of between 7.0 and 7.8 minutes. Other than standard assay procedures, RP-HPLC techniques to indicate stability have also been developed and Quality by Design (QbD) or Analytical Quality by Design (AQbD) approaches have also been established. These superior techniques involve the concurrent determination of dapagliflozin with other antidiabetic drugs like metformin, linagliptin, and dapagliflozin, and having sufficient robustness, accuracy, precision, and adherence to regulatory requirements. The literature review proves that dapagliflozin has been widely examined with the help of HPLC techniques. [14-23].
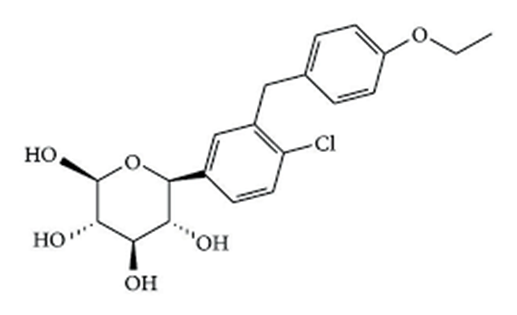
Fig 1 : Chemical structure of Dapagliflozin
EXPERIMENTAL METHOD :
Materials:
Arni Analytical Laboratory provided a sample of dapagliflozin. Nashik. Thermo Ultimate 3000 purchased HPLC-grade solvents such as Acetonitrile, Methanol, and HPLC system.
Instrumentation :
Method development and validation were done using the HPLC Thermo Ultimate 3000 and Chromeleon 7.3 software with Agilent Zorbax C18 column (150 mm × 4.6 mm 5 mm). Design -The CCD model was designed using design of the expert software version 11.0.
Preparation of Mobile Phase:
Preparation of Buffer:
Dilute 0.02M Potassium dihydrogen orthophosphate in water.
Preparation of Mobile Phase:
Prepare (50:50) v/v of buffer and Acetonitrile.
Preparation of standard solutions:
Measure 20mg of Dapagliflozin in 100ml volumetric flask. Weakly shake with 30 ml of mobile phase and sonicate 5 minutes. Make up the volume. Dilute 5 ml of solution, above, to 50 ml in mobile phase.
Preparation of sample solutions:
Weigh 10 pills and take average weight. Grind the pills to fine powder. Weigh in 50 ml volumetric flask weighs of accurate weight of powder weight equal to average weight (tablet weight). Add 30 ml of mobile phase and shake 10 minutes and balance the volume. Pass the solution above through the Whatman filter paper no. 41. Further dilute 5 ml of the above filtrate with 50 ml Mobile Phase.
Experimental Design Scouting step :
Some experimentation was done with this step to establish mobile phase that provides an acceptable separation. During the formation of the method, a mixture of both buffer and acetonitrile was observed to yield good peak therefore mixture of buffer and acetonitrile in ratio 50:50% v/v was picked as a mobile phase. Lastly, 2-factor chosen percent acetonitrile, flow rate which might obviously influence the chosen responses were chosen.
Optimisation design :
CCD was predominantly used because it was very effective and the process offered opportunities of minimizing the number of runs. A CCD with k factors must also demand 2 k factorial executes, 2K axial experiment, that is spacing which is uniform at +/- 0.05 on every axis of variables and one centre point or greater. The 3 significant factors were rotated using a CCD (with 5 levels of each factor with = 1.68) to give the most favorable degree of targeted responses by undertaking 13 random rotations that are synthesizing 5 center points. The critical objective of HPLC analysis technique is to speed up the test and proper separation of the peaks. After knowing the chromatographic factors or the independent factors which influence such responses of the HPLC system, then central composite design technique can be applied in order to optimize these factors. Rotatability or orthogonality of CCD, which is added with two extra or star points (wide angle) to the factorial design, is easily estimated by the second order equation and was described by Box and Wilson. Therefore it allows determining the coefficient of the quadratic model of regressions that results in the prediction of nonlinear effect of variables. The CCD model was created using Design Expert 11 ( Stat-Ease Inc., Minneapolis, MN USA).
Table 1: Central composite design showing 13 randomized trail runs
|
Run |
% ACN |
Flow rate |
Rt dapagliflozin |
|
1 |
50 |
1 |
3.734 |
|
2 |
64 |
1 |
3.121 |
|
3 |
50 |
1 |
3.733 |
|
4 |
50 |
1 |
3.758 |
|
5 |
40 |
1.2 |
4.581 |
|
6 |
35 |
1 |
4.784 |
|
7 |
40 |
0.8 |
5.258 |
|
8 |
60 |
1.2 |
3.256 |
|
9 |
50 |
0.7 |
4.009 |
|
10 |
50 |
1 |
3.761 |
|
11 |
50 |
1.2 |
3.413 |
|
12 |
50 |
1 |
3.763 |
|
13 |
60 |
0.8 |
3.756 |
Table 2 : Experimental factors and levels used in central composite design
|
Name |
Low (-1) |
Medium (0) |
High (+1) |
|
Independent factor |
|
|
|
|
A : Acetonitrile % |
40 |
50 |
60 |
|
C :Flow rate |
0.8 |
1 |
1.2 |
|
Dependent factor |
|
|
|
|
R1 |
Retention time of dapagliflozin |
|
|
Table 3:Experimental results and optimized conditions
|
Parameters |
Description |
|
Program |
Isocratic |
|
Mobile phase |
Phosphate buffer: ACN (40:60 v/v) |
|
Wavelength |
223 nm |
|
Injection volume |
20 µL |
|
Flow rate |
1 mL/min |
Method validation :
This was put to test according to (ICH) guidelines (Q2R2), which comprised of system suitability, linearity, DL, QL, accuracy, precision and robustness. [24].
Specificity
Specificity may be explained as the ability to reach the analyte when the components which could be predicted to be present are present in the presence of the analyte. Specificity Analytical process (method): HPLC peaks of the pure active ingredients and the sample summits prepared using the dosage forms marketed were compared to the blank and placebo.
Precision
Precision One parameter that will be applied in assessing the extent of reproducibility of the analytical method will include relative standard of the area, and retention time of Solution prepared on a basis of percentage. Analytical procedure is said to be precise as it describes the extent of concordance (scatteredness) among a sequence of measurements done after a sequence of samplings of a homogenous sample investigated under the stipulated conditions.
Intermediate precision:
Precision is used under the circumstances that the analysis repeatability i.e. the circumstances where the independent test results were quantified using the same method with the same test materials in the same laboratory by the same operator using the same equipment over the short period of time.
Accuracy
The accuracy of the analysis method provides an idea of the closeness of the test outcome of the method to the real one. Percent recovery was chosen and it was carried out at 3 different levels namely 80 percent, 100 percent, 120 percent.
Linearity
The five concentrations within the range of 80 to 120% were found as the linearity of the method. The concentrations were plotted against the peak areas in order to develop the calibration curves.
Quantification limit and Detection limit.
DL is minimum concentration which cannot be measured other hand QL is minimum concentration which can be measured.
Solution Stability:
The stability of dapagliflozin of the assay procedure was determined by the incubation of the working standard during 24 hrs in tightly capped volumetric flasks at room temperature. Sample of assays is also prepared and stored in constant condition over a duration of 24 hours.
RESULT AND DISCUSSION:
Method optimization and design of experiment:
Finally 2 factor selected percent acetonitrile, flow rate that may obviously impact the selected responses were selected. The spectral of drug within the wavelength of 200-400 nm showed that the 223 nm was the 223 nm 2 max of dapagliflozin. As a result, the chromatographic detection was fixed at 223 nm. The Agilent Phosphate buffer: Acetonitrile (50:50 v /v) at 1.0 mL/min was used in the process, with the assistance of Agilent Zorbax C18 column (250 mm x 4.6mm; 5nu m). Each two variables was put in the sweet spot (also referred to as the bright yellow area), and the remaining factors were set at a certain value. Two-variable Case CCD [ Concentration of acetonitrile, flow rate ) of 13 experiments. The calculated equation of the quadratic regression model that resulted after interaction of factors and responses with the use of the software of design expert presented in Table 3 was used to test the analysis of variance (ANOVA) and confirmed the P-value as F-value presented in Table 4. The effects of independent variables on the response are important (the required probability (p < 0.0001) is needed to argue that the model is significant).
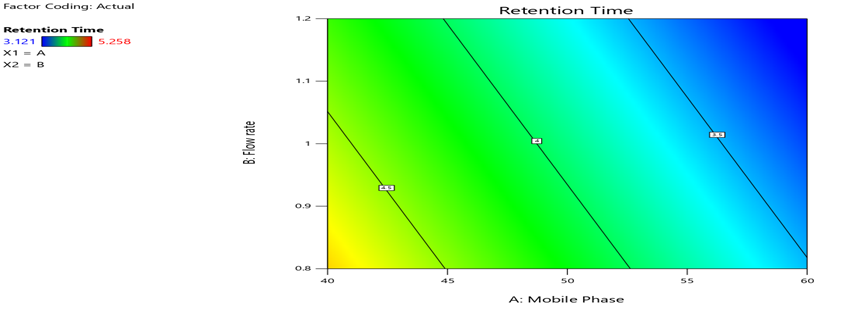
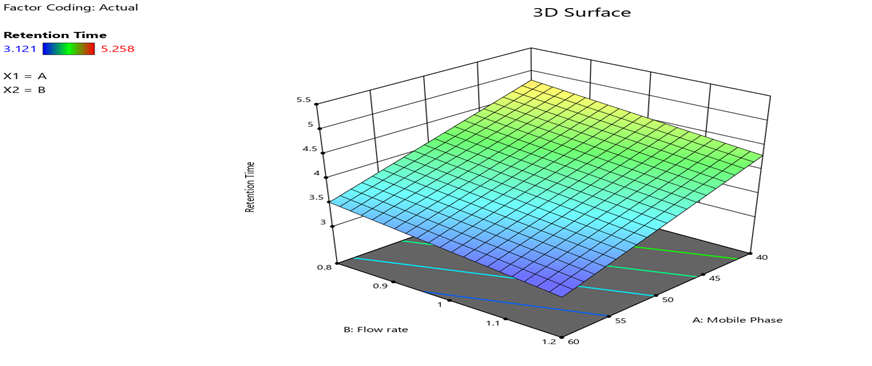
Fig 2: 2D and 3 D plot of the interaction effect of critical factors on the retention time of dapagliflozin.
The 2D and 3D plots in Fig 2 provide association between each of the dependent variable with one of the two independent variables. The plots were clear in implying that with an increase in the flow rate and mobile phase concentration of acetonitrile, the retention time also decreased.
Table 4 : Statistical parameter obtained from ANOVA
|
Model |
3.86 |
2 |
1.93 |
30.76 |
< 0.0001 |
significant |
|
A-Mobile Phase |
3.35 |
1 |
3.35 |
53.39 |
< 0.0001 |
|
|
B-Flow rate |
0.5100 |
1 |
0.5100 |
8.12 |
0.0173 |
|
|
Residual |
0.6279 |
10 |
0.0628 |
|||
|
Lack of Fit |
0.6271 |
6 |
0.1045 |
465.10 |
< 0.0001 |
significant |
|
Pure Error |
0.0009 |
4 |
0.0002 |
|||
|
Cor Total |
4.49 |
12 |
In Table No.4 The Model F-value of 30.76 means that the model is significant. A chance that such F-value can happen by chance is only 0.01%.P-values below 0.0500 are an indication that model terms are significant.
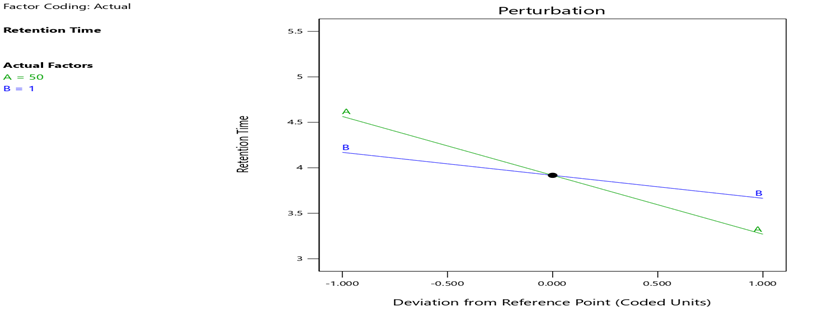
Fig 3 : Perturbation plot show effect of factor on responses
In Fig 3 show, percent ACN and flow rate had largest negative influence on retention time of dapagliftozin since retention time decreases as flow rate and concentration of mobile phase acetonitrile increases.
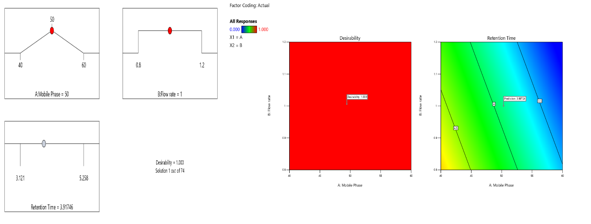
Fig 4.Graphical analysis of constraints acceptable to designate global desirability and achieve optimum condition.
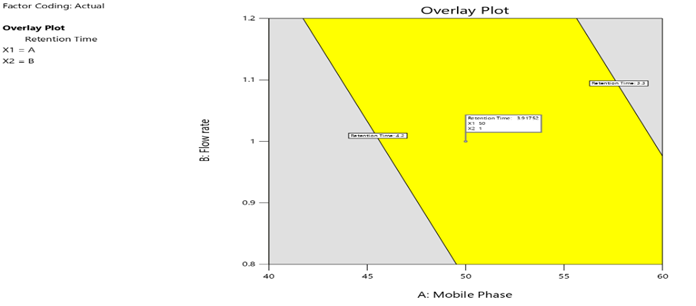
Fig 5.Orienting plot of the crossover point between the intended response.
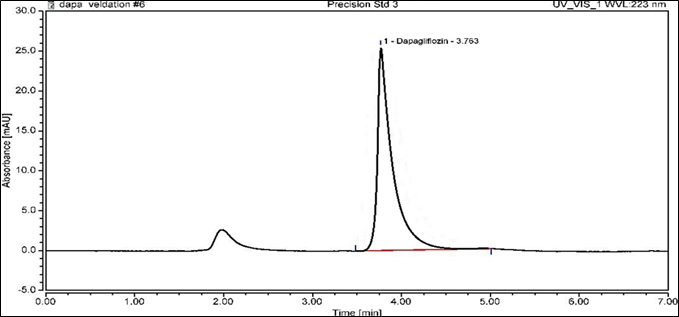
Fig 6.Optimized chromatogram of dapagliflozin
Validation Parameter:
Specificity
In the observed retention time of the analytes, no additional or co-eluting peaks were observed in the chromatograms. So, the peaks were believed to be pure and this is how the particularity of the method is evidenced. Interference in Standard and Sample by Blank was not observed.
Table 5 : Specificity result for dapagliflozin
|
Sr.No. |
Area |
|
|
1 |
Blank |
0.000 |
|
2 |
Standard Solution |
10.014 |
|
3 |
Sample Solution |
9.997 |
Precision
1. System Precision: The Assay values of three preparations of dapagliflozin 20 mg are having percent Assay 100.00 which has a NLT 90.00 and NMT 110.00 thus the method of assay of dapagliflozin 10mg tablet is precise.
2.Intermediate Precision: The Assay values of three -diphasias of dapagliflozin is having 99.59 which is NLT 90.0 and NMT 110.0 So the assay method of dapagliflozin and tablet is accurate.
Accuracy
The recovery of the dapagliflozin of each injection of each concentration is 99.99, 99.75, 99.92 and the recovery mean is 99.88 and is within the acceptance criteria thus the method of determination of the dapagliflozin by percentage assay is valid.
Table 6 : Accuracy result for dapagliflozin
|
Sr.No. |
Level |
mg of drug spiked |
Area |
mg of drug Recovered |
% Recovery |
|
1 |
80% |
0.040000 |
8.113 |
0.039994 |
99.99 |
|
2 |
100% |
0.050000 |
10.117 |
0.049873 |
99.75 |
|
3 |
120% |
0.060000 |
12.161 |
0.059950 |
99.92 |
|
Average |
|
|
|
|
99.88 |
|
Std.dev |
|
|
|
|
0.12 |
|
%RSD |
|
|
|
|
0.12 |
Linearity
The calibration curves were established with 5 injections and were observed to be linear between 80-120% range. The results obtained fall within the range and the standard curve coefficient of correlation is 0.9998 therefore, the method is linear in the given range.
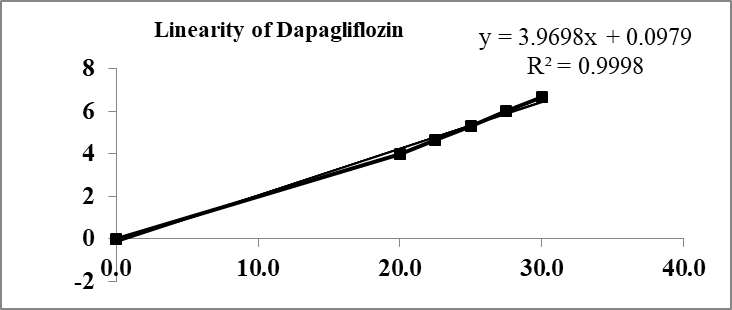
Fig 4 : Calibration curve for dapagliflozin
Table 7 : Linearity result for dapagliflozin
|
Sr.No. |
Concentration in ppm |
Concentration of Solution |
Diluted to |
Area |
|
1 |
32.0 |
80 |
50 |
8.013 |
|
2 |
36.0 |
90 |
50 |
9.014 |
|
3 |
40.0 |
100 |
50 |
10.025 |
|
4 |
44.5 |
110 |
50 |
11.014 |
|
5 |
48.0 |
120 |
50 |
12.167 |
Solution Stability
RSD was less than 2 which indicated that the sample solutions of dapagliflozin 20 mg remained stable at room temperature of not more than 4 hours.
Table 8 : Solution stability result for dapagliflozin
|
Sr.No. |
Hours |
Area |
% Assay |
%Assay Difference |
|
1 |
Initial |
10.000 |
100.00 |
----- |
|
2 |
8 Hour |
10.432 |
104.39 |
-4.39 |
|
3 |
24 Hour |
9.555 |
100.00 |
0.00 |
Table 9: Validation results of dapagliflozin
|
Parameters |
Dapagliflozin |
|
Specificity |
No interference was detected in Standard and Sample because of Blank. |
|
Linearity |
|
|
Range ( µg/mL) |
80-120 % |
|
Y-Intercept |
0.0979 |
|
Slope |
3.9698 |
|
Correlation coefficient |
0.9998 |
|
Accuracy |
|
|
% recovery |
99.88 |
|
Precision |
|
|
System Precision |
RSD - 0.21 % |
|
Method Precision |
% Assay - 100.00 |
|
Intermediate precision |
% Assay – 99.59 |
|
Stability of solution |
RSD < 2% |
CONCLUSION:
AQbD strategy was utilized to come up with an effective and strong RP-HPLC method to determine dapagliflozin. The rate of the key influence of two factors on the retention time of dapagliflozin was successfully studied through the implementation of the multivariate regression analysis. Optimization of chromatographic conditions was done using CCD by examining the interaction and quadratic effects that the important factors have on the responses of the choice. It was validated according to ICH Q2R2 guideline. The technique is easy, durable, correct and exact is applicable to the dapagliflozin in normal analysis.
REFERENCES : :
1. Sharma H, Sapkota HP, Dangi NB. A brief review of analytical methods for the estimation of allopurinol in pharmaceutical formulation and biological matrices. Int J Anal Chem. 2021;2021:1–12.
2. American Diabetes Association. Standards of medical care in diabetes—2014. Diabetes Care. 2014;37(Suppl 1):S14–S80.
3. Abdul B, Hassan R. Overview on diabetes mellitus (type 2). Int J Sci Res. 2013;4:7064–7068.
4. Demaris KM, White JR. Dapagliflozin, an SGLT2 inhibitor for the treatment of type 2 diabetes. Drugs Today (Barc). 2013;49(5):289–301.
5. Albarrán OG, Ampudia-Blasco FJ. Dapagliflozin, the first SGLT-2 inhibitor in the treatment of type 2 diabetes. Med Clin (Barc). 2013;141(Suppl 2):36–43.
6. Anderson SL. Dapagliflozin efficacy and safety: a perspective review. Ther Adv Drug Saf. 2014;5:242–254.
7. Anderson SL, Marrs JC. Dapagliflozin for the treatment of type 2 diabetes. New Drug Dev. 2012;46:590–598.
8. Komoroski B, Vachharajani N, Boulton D, Kornhauser D, Geraldes M, Li L, et al. Characterization of renal glucose reabsorption in response to dapagliflozin in healthy subjects and subjects with type 2 diabetes. Diabetes Care. 2013;36:3169–3176.
9. Kavitha D, Sahoo SK, VR P, Nagamani M, Ch B. Quality by design development and validation of RP-HPLC method for determination of metformin and sitagliptin in bulk and pharmaceutical dosage form. Int J Pharm Sci Rev Res. 2017;5:34–39.
10. Sebaiy MM, El-Adl SM, Baraka MM, Hassan AA, El-Sayed HM. Quality by design approach for development and validation of an RP-HPLC method for simultaneous estimation of xipamide and valsartan in human plasma. BMC Chem. 2022;16:1–13.
11. Jatte KP, Masne DD, Khachane MA, Charde MS. QbD approach in analytical method development: a review. Int J Pharm Pharm Res. 2021;21:1–19.
12. Nadpara NP, Thumar RV, Kalola VN, Patel PB. Quality by design (QbD): a complete review. Int J Pharm Sci Rev Res. 2012;17:20–28.
13. International Conference on Harmonisation. Pharmaceutical development Q8(R2). ICH harmonised guideline. 2009. p. 1–28.
14. Basha S, Sravanthi P. Development and validation of dapagliflozin by reversed-phase high-performance liquid chromatography method and its forced degradation studies. Asian J Pharm Clin Res. 2017;10(11):101–105.
15. Gaikwad AV, Gawade AS, Jadhav SL, Patil SS. Method development and validation of dapagliflozin by RP-HPLC. J Pharm Negat Results. 2022;13(Suppl 6):4316–4335.
16. Chaudhary A, Saini R, Patil S. Development and validation of a new analytical method for dapagliflozin by RP-HPLC. J Pharm Anal. 2019;9(3):174–181.
17. Kumar ASR, Sujatha K, Rao JV. Stability-indicating RP-HPLC method for the estimation of dapagliflozin in bulk and pharmaceutical dosage form. Int J Pharm Sci Res. 2018;9(6):2456–2462.
18. Khan Z, Patil S, Yeole P. Simultaneous estimation of metformin hydrochloride and dapagliflozin in pharmaceutical dosage form by RP-HPLC. J Pharm Sci Res. 2018;10(9):2314–2318.
19. Patel YD, Patel PR, Bhatt J, Mehta B, Detholia K. Quantitative computation and stability evaluation of phase III composition comprising sitagliptin and dapagliflozin propanediol monohydrate by RP-HPLC. J Appl Pharm Sci. 2022;12:148–155.
20. Gupta A, Mishra SK. A novel analytical method for simultaneous quantification of dapagliflozin and sitagliptin by reverse phase high performance liquid chromatography. J Med Pharm Allied Sci. 2021;10:2931–2936.
21. Gundala A, Kvsrg P, Koganti B. Application of quality by design approach in RP-HPLC method development for simultaneous estimation of saxagliptin and dapagliflozin in tablet dosage form. Braz J Pharm Sci. 2019;55:1–10.
22. Umekar MJ, Mante GV, Hemke AT. RP-HPLC method for estimation of dapagliflozin from its tablet. Int J ChemTech Res. 2021;11:242–248.
23. Rageeb M, Abdel-Hamid ME, El-Wasseef DR, El-Sayed MA. Stability-indicating RP-HPLC method for determination of saxagliptin and dapagliflozin in bulk and tablet dosage forms. J Pharm Sci Res. 2020;12:499–506.
24. International Council for Harmonisation. Validation of analytical procedures Q2(R2). ICH harmonised guideline. 2022. p. 1–38.