RUTIN PHYTOSOMES AS A NOVEL DRUG-DELIVERY SYSTEM: FORMULATION, CHARACTERIZATION, AND ANTI-INFLAMMATORY EVALUATION
- SHRADDHA MAHAJAN , Research Scholar, Faculty of Pharmacy, Oriental University Indore MP 453555
- ASHISH SINGH PARIHAR , Associate Professor , Faculty of Pharmacy, Oriental University Indore MP 453555
Article Information:
Abstract:
Phytosomes are novel delivery systems known to enhance the pharmacological performance of phytoconstituents. The present study evaluates the pharmacological activity of rutin phytosomes with particular emphasis on their anti-inflammatory potential. Rutin, a flavonoid possessing antioxidant and anti-inflammatory properties, exhibits limited therapeutic effectiveness due to poor bioavailability. The anti-inflammatory activity of rutin phytosomes was assessed using the carrageenan-induced paw edema model, where a significant reduction in edema was observed compared to free rutin. Additional in vivo studies demonstrated marked antioxidant activity and hepatoprotective effects against paracetamol-induced liver injury, supporting the overall pharmacological efficacy of the phytosomal system. Pharmacokinetic evaluation revealed improved oral bioavailability, contributing to enhanced therapeutic outcomes. The findings of this study indicate that rutin phytosomes exhibit significant anti-inflammatory activity compared with control, along with improved pharmacokinetic performance, highlighting their potential as an effective delivery system for rutin. and improved pharmacological performance, highlighting their potential as an effective therapeutic approach for inflammatory conditions.
Keywords:
Article :
INTRODUCTION :
The pharmacological activity assessment of rutin phytosomes, particularly for anti-inflammatory action, involves a multi-faceted approach. Preclinical studies have demonstrated that rutin exerts its anti-inflammatory effects through several mechanisms, including inhibition of pro-inflammatory cytokines, reduction of oxidative stress, and modulation of the NF-κB signaling pathway (Singh et al., 2020). Encapsulation into phytosomes enhances these effects by ensuring a sustained release profile and greater systemic availability. Additionally, phytosomal formulation has shown potential to protect rutin from enzymatic degradation, further enhancing its therapeutic efficacy (Roy et al., 2023).
The anti-inflammatory potential of rutin phytosomes can be effectively evaluated using both in vitro and in vivo models. In vitro studies, such as inhibition of nitric oxide production and cyclooxygenase (COX) enzyme assays, provide an initial indication of anti-inflammatory activity. In vivo models, such as carrageenan-induced paw edema and cotton pellet granuloma, offer insights into the systemic efficacy of rutin phytosomes. Studies have consistently shown that rutin phytosomes exhibit significant inhibition of inflammatory markers, often comparable to standard NSAIDs (Verma et al., 2023).
Moreover, the pharmacokinetic profile of rutin phytosomes has been extensively studied, revealing enhanced oral bioavailability, prolonged plasma retention, and improved pharmacodynamic responses compared to unformulated rutin. These advantages highlight the potential of phytosomes as a superior delivery platform for natural anti-inflammatory agents (Kumar et al., 2022).
MATERIALS AND METHODS:
Animals were randomly allocated to experimental groups using a simple randomization procedure. Investigators responsible for outcome assessment were blinded to treatment allocation during data collection and analysis. No animals were excluded from analysis, and no formal outlier removal was performed.
All experimental procedures involving animals were reviewed and approved by the Institutional Animal Ethics Committee (IAEC), ITM University, Gwalior, Madhya Pradesh, in accordance with CPCSEA guidelines, Government of India (IAEC Approval No. ITM/IAEC/2023/031, dated 13/04/2023; CPCSEA Registration No. 1894/PO/Re/S/16/CPCSEA).
Invitroantioxidant activity
The free radical scavenging activity of pure rutin, Soybean Phosphatidylcholine, and optimized rutin phytosomes was measured, and compared with the activity of standard (Ascorbic acid) using a stable free radical DPPH (2,2-diphenyl-1-picrylhydrazyl) as per the method described by Jamuna et al., with slight modifications. The 0.1 mM solution of DPPH in methanol was prepared, and from this, 1.55 ml was added to 3.5 ml methanolic solution of pure rutin, SPC, and optimized rutin phytosomes of different concentrations ranged from 10-50 µg/ml. The absorbance of the standard and the samples was measured at 517 nm using Elisa reader.(Kumbhar, S et.al. 2024) All experimental procedures involving animals were reviewed and approved by the Institutional Animal Ethics Committee (IAEC), ITM University, Gwalior M.P., in accordance with the guidelines of the Committee for the Purpose of Control and Supervision of Experiments on Animals (CPCSEA), Government of India. IAEC approval number: ITM/IAEC/2023/031, dated 13/04/2023. CPCSEA registration number: 1894/PO/Re/S/16/CCSEA
Formulation and Characterization of Rutin Phytosomes
Materials
Rutin (≥98% purity) and soybean phosphatidylcholine (SPC) were used for phytosome preparation. Ethanol and methanol of analytical grade were employed as solvents. All other chemicals were of analytical grade and used as received.
Preparation of Rutin Phytosomes
Rutin phytosomes were prepared by the solvent evaporation method. Accurately weighed rutin and SPC were taken in molar ratios of 1:1, 1:2, and 1:3 and dissolved in ethanol to obtain a clear solution. The solution was refluxed at 40 ± 2 °C for 2 h to allow complex formation. The solvent was removed under reduced pressure using a rotary evaporator, and the resulting thin film was dried overnight under vacuum. The dried mass was pulverized, sieved (100 mesh), and stored in a desiccator until further use. (Barani, M, et.al., 2021)
Optimization of Formulation
Optimization was carried out based on encapsulation efficiency, particle size, and in vitro drug release profile. Among the tested formulations, the 1:2 rutin:SPC ratio exhibited higher encapsulation efficiency, suitable particle size, and sustained drug release, and was therefore selected as the optimized formulation.
Particle Size and Polydispersity Index
The mean particle size, polydispersity index (PDI), and zeta potential of the optimized rutin phytosomes were determined using dynamic light scattering. Measurements were performed in triplicate (n = 3) for two independently prepared batches. Results are expressed as mean ± standard deviation (SD). The optimized formulation exhibited a nanometric particle size with low PDI (< 0.3), indicating uniform size distribution and good physical stability.(Khanh NV et al.2018)
Zeta Potential
Zeta potential was measured to assess the physical stability of the formulation. The optimized rutin phytosomes exhibited a negative zeta potential, suggesting good stability due to electrostatic repulsion between particles.
Morphological Analysis
The surface morphology of optimized rutin phytosomes was examined using electron microscopy (TEM/SEM). Representative micrographs with appropriate scale bars revealed discrete, spherical vesicular structures with smooth surfaces and no visible aggregation, confirming successful phytosome formation.
Encapsulation Efficiency and Drug Loading
Encapsulation efficiency (EE%) was determined by separating unentrapped rutin and quantifying the drug spectrophotometrically. Encapsulation efficiency (EE%) and drug loading (%) were determined in triplicate (n = 3) for the optimized formulation and for one independently prepared batch. The optimized rutin phytosomes demonstrated high encapsulation efficiency (>85%) and consistent drug loading, confirming effective complexation and formulation reproducibility.
The optimized formulation showed high encapsulation efficiency (>85%), indicating effective complexation of rutin with phospholipid. Drug loading was found to be consistent with the composition of the phytosomal system
FTIR Analysis
FTIR spectra of pure rutin, soybean phosphatidylcholine, and optimized rutin phytosomes were recorded and overlaid to evaluate drug–excipient interactions. Characteristic peaks of rutin were retained in the phytosomal formulation with minor shifts and peak broadening, indicating hydrogen bonding and physical complex formation rather than chemical incompatibility. These spectral changes confirm successful rutin–phospholipid complexation. In Vitro Drug Release Study
The in vitro drug release of optimized rutin phytosomes was evaluated using a dialysis membrane diffusion method. A pre-soaked dialysis membrane (molecular weight cut-off 12,000–14,000 Da) was used as the diffusion barrier. An accurately weighed quantity of optimized rutin phytosomes equivalent to 100 mg of rutin was dispersed in 5 mL of release medium and placed inside the dialysis membrane, which was securely tied at both ends.
The dialysis bag was immersed in 900 mL of phosphate buffer (pH 6.8) containing 0.5% w/v Tween 80 as the dissolution medium to maintain sink conditions. The study was carried out using a USP dissolution apparatus II (paddle method) operated at 50 rpm and 37 ± 0.5 °C.
At predetermined time intervals (0, 2, 4, 6, 8, 10, 12, 14, 16, 18, 20, 22, and 24 h), 5 mL samples were withdrawn and replaced with an equal volume of fresh medium maintained at the same temperature. The samples were filtered and analyzed spectrophotometrically at the predetermined λmax of rutin. The cumulative percentage drug release was calculated and plotted as a function of time.
All experiments were performed in triplicate (n = 3), and results are expressed as mean ± SD. Sink conditions were maintained by the use of phosphate buffer (pH 6.8) containing 0.5% w/v Tween 80 and a dissolution volume of 900 mL, ensuring that the concentration of released drug remained below its saturation solubility throughout the study.
In vivo Evaluation of Optimized Rutin Phytosomes
A. In vivo hepato protective (Liver function test)and antioxidant activity studies Dosing
The adult male Wistar rats were divided into 4 groups of 6 animals in each. Group I (Normal), animals were treated with distilled water with1%v/v Tween 20 per os for 7days. Group II Paracetamol-induced hepatotoxicity model (CCl4 intoxicated), animals were treated with distilled water with1 %v/v Tween 20 p.o. for 7 days, and an paracetamol dosing equal mixture of CCl4, and olive oil (50 %v/v, 5 ml/kg) as a single dose i.p. on 7thday. Group III (Rutin treated), animals were treated with rutin suspension in distilled water (100 mg/kg) with 1 %v/v Tween 20 per day p.o. for seven days, and on 7th day, an equal mixture of CCl4, and olive oil paracetamol dosing (50 %v/v, 5 ml/kg) as a single dose i.p. Group IV(Optimized rutin phytosomes treated) animals were treated with optimized rutin phytosomes in distilled water (~100 mg/kg rutin) with 1 %v/v Tween 20 per day p.o. for seven days, and on 7th day, an paracetamol dosing equal mixture of CCl4, and olive oil(50 % v/v, 5 ml/kg) as a single dose i.p.
Estimation of liver marker enzymes
To evaluate the effect of pure rutin and optimized rutin phytosomes on rat liver function, liver function test (LFT) was carried out by quantitative determination of liver marker enzymes. The LFT was performed by quantitative determination of serum glutamate pyruvate transaminase (SGPT) also known as Alanine transaminase (ALT), serum glutamate oxaloacetate transaminase (SGOT) and total bilirubin.
1. EstimationofALT (SGPT)
In vitro quantitative determination of ALT in rat serum was carried out by modified ‘International Federation of Clinical Chemistry and Laboratory Medicine’ (IFCC) method.
Reagent composition
The ALT kitcontains2reagents, R1andR2.
R1: Tris buffer pH 7.5 (100 mmol/l), L-alanine (500 mmol/l), and lactate dehydrogenase (LDH) (≥1200 U/l).
R2:α-Ketoglutarate(16mmol/l)and nicotinamide adenine di nucleotide-reduced(NADH) (0.18 mmol/l).
To prepare working reagent, 4 parts of R1 was mixed with 1 part of R2. Then, to 100 µl of serum sample, 1000 µl of working reagent was added and mixed well. After 1, 2, and 3 min, absorbance was measured at 340 nm and 37 ºC using a semiautomatic analyzer. The ALT activity was calculated as per the following formula, ALT activity (U/L) =ΔA/min X F. Where, F is 1746.
2. Estimation of AST(SGOT)
In vitro quantitative determination of AST in rat serum was carried out by modified IFCC method
Reagent composition
The AST kit contains 2 reagents, R1 and R2.
R1: Tris buffer pH 7.8 (80 mmol/l), L-aspartate (240 mmol/l), malate dehydrogenase (MDH) (≥600 U/l) and LDH (≥600 U/l).
R2:α-Ketoglutarate(12mmol/l) andNADH(0.24mmol/l).
To prepare working reagent, 4 parts of R1 was mixed with 1 part of R2. Then, to 100 µl of serum sample, 1000 µl of working reagent was added and mixed well. After 1, 2, and 3 min, absorbance was measured at 340 nm and 37 ºC using a semiautomatic analyzer. The AST activity was calculated as per the following formula, AST activity (U/L) = ΔA/minX F. Where, F is 1746.
3. Estimation of total bilirubin
In vitro quantitative determination of total bilirubin in rat serum was carried out by Malloy Evelyn modified method.
Reagentcomposition
The bilirubin kit contains3reagentsR1,R2,andR3.
R1: DMSO (>4 mol/l)
R2:Sulfanilicacid(28.9mmol/l)
R3: Sodium nitrite (43 mmol/l)
For total bilirubin,
Blank (A1):750 µl of R1 was added to 50 µl of serum sample and mixed well.
Sample (A2): 750 µl of R1 and 25 µl R3 were added to 50µl of serum sample and mixed. After mixing well, the bland and sample solutions were incubated for 5 min at 37 ºC, and absorbance was taken at 546 nm and37ºC using a semi automatic analyzer.The bilirubin content was calculated as per the following formula, Bilirubin content (mg/dl) =(A2–A1) X F. Where, F is 16.7.
Estimation of antioxidant marker enzymes
The antioxidant potential of pure rutin and optimized rutin phytosomes was assessed by the quantitative estimation of serum antioxidant marker enzymes. Liver homogenate supernatant was then assayed for reduced glutathione (GSH),superoxide dismutase (SOD), catalase (CAT), and thiobarbituric acid reactive substances (TBARS) by standard procedures.
1. Estimation of reduced glutathione(GSH)
The liver tissue homogenate (0.5 ml) was precipitated with 2 ml of 5 % TCA and centrifuged at 3000 rpm for 10 min using a compact cooling centrifuge. To 1 ml of the supernatant, 0.3 ml phosphate buffer and 0.5 ml Ellman’s reagent were added and incubated for 15 min at room temperature. After incubation,the absorbance of the product was measured at λ max 420 nm using a UV-VIS spectrophotometer. A series of standards (10-50 µg/mL) were treated similarly along with the blank containing 1 ml distilled water. The GSH content was expressed as nmol/mg protein.
2. Estimation of super oxided isomutase (SOD)
Liver tissue homogenate (0.1 ml), ethanol (0.75 ml), chloroform chilled in ice (0.15 ml) were taken in a test tube and centrifuged at 3000rpmfor 10 min using a compact cooling centrifuge. To the 0.5 ml of supernatant, EDTA solution (0.5 ml), and carbonate- bicarbonate buffer(1ml)were added and mixed well.The reaction was initiated by the addition of freshly prepared epinephrine solution(0.5 ml)and the change in absorbance at λmax 450 nm was measured using a UV-VIS spectrophotometer at 0, 1, and 2 min. Blank was prepared by replacing the liver tissue homogenate with 0.1 ml of distilled water. The SOD activity was expressed as U/mg protein, i.e. one unit of SOD activity is the amount of protein that is required to give 50 % inhibition of epinephrine auto-oxidation.
3. Estimationofcatalase(CAT)
Liver tissue homogenate (25 µl) was added to the phosphate buffer (1 ml) and mixed well. The enzyme reaction was initiated by the addition of H2O2 solution (250 µl). The decrease in the absorbance was measured at λmax 240 nm using UV-VIS spectrophotometer for 3 min with 30 sec time intervals. Blank was prepared by replacing the H2O2 solution with 250 µl of distilled water. The CAT activity was expressed as U/mg protein, i.e. nmols of H2O2 decomposed/min/mg protein.
Histopatho logical studies
Immediately after scarifying, livers from the animals were dissected and preserved in neutral buffered formalin (10%). Livers were sectioned and stained with haematoxylin and eosin and examined under the digital microscope.
Oral bioavailability studies
Oral bioavailability study of optimized rutin phytosomes was conducted in12 male albino Wistar rats weighing 180-200 g divided into two groups (n=6). Both the group animals were fasted for 12 h with free access to water. Group I and Group II animals received a single dose of pure rutin (100 mg/kg rutin) and optimized rutin phytosomes (~100 mg/kg rutin), respectively. At predetermined time intervals, the blood was collected from the retro-orbital plexus of animals under light ether anaesthesia into serum separator tubes (5 ml, Red)and centrifuged at 3000rpmfor10 min using a compact cooling centrifuge. The serum was stored at -20 ºC in a deep freezer prior to quantification of rutin in serum by HPLC method.
Quantification of rutin in rat serum by HPLC method
The quantification of rutin in rat serum was performed using an HPLC method developed and validated by Maiti et al., with slight modifications. Briefly, frozen serum samples were thawed at room temperature, and 1 mL of serum sample was added to 5 mL of methanol in a 10 mL volumetric flask. The contents were vortexed and heated at 75 °C for 0.5 h. Methanol was added to make up the volume to 10 mL, followed by centrifugation at 4000 rpm for 15 min using a compact cooling centrifuge. The supernatant was filtered through a 0.2 µm syringe filter, and 20 µL of the filtered sample was subjected to HPLC analysis using a C-18 column (column temperature: 37 °C) and a UV-PDA detector (SPD-M20A) set at λmax 360 nm.
The mobile phase consisted of acetonitrile and orthophosphoric acid (45:55, v/v) and was run at a flow rate of 1 mL/min. The concentration of rutin was determined from a standard calibration curve by plotting peak area against concentration. The regression equation was found to be Y = 39267X − 8602 over a linearity range of 1–10 µg/mL. The retention time of rutin was 4.5 ± 0.03 min, and the correlation coefficient (r²) was 0.999.
Pharmacokineticparameters
The pharmacokinetic parameters such as maximum plasma concentration (Cmax) and the time required to reach maximum concentration (Tmax) of optimized rutin phytosomes were determined based on the plasma concentration-time curve. Other parameters such as area under plasma concentration-time curve from zero to time of the final measured sample (AUC0-t) and area under plasma concentration-time curve from zero to infinity (AUC0-∞), elimination half-life (t1/2el), elimination rate constant (Kel), clearance (cl), and volume of distribution (Vd) were calculated using Microsoft Excel Add-In software PK Solver® and compared to the parameters obtained for free rutin. Relative bioavailability (F) is the ratio of the total amount of drug absorbed from optimized rutin phytosomes to the total amount of drug absorbed from pure rutin. Amount of drug absorbed (Amax) from a dosage form is a function of Vd, Kel, and AUC0-ꝏ. Therefore, the relative bioavailability (F) was calculated by using the following formula,
Stability Study
Stability study was carried out on the optimized rutin phytosomes as per ICH guidelines. The dry optimized rutin phytosomes were packed in aluminium foil and subjected to stability studyat 25±2 ºC/ 60±5 % RH and accelerated condition at 40±2 ºC/ 75±5 % RH as per new ICH guidelines. Optimized rutin phytosomes were evaluated for drug content and in vitro drug release on 1st, 30th, 60th, and 90th day.
Stability studies of optimized rutin phytosomes were conducted in accordance with International Council for Harmonisation (ICH) Q1A(R2) guidelines. The dried phytosomal formulation was packed in aluminium foil-lined, airtight containers to protect the formulation from moisture, light, and oxidative degradation.
The samples were stored under:
Long-term conditions: 25 ± 2 °C / 60 ± 5% RH
Accelerated conditions: 40 ± 2 °C / 75 ± 5% RH
Samples were withdrawn at 1, 30, 60, and 90 days and evaluated for drug content and in vitro drug release profile using the methods described in this section.
The selected ICH conditions and packaging were justified to simulate normal and stressed storage environments and to ensure the physical and chemical stability of the phospholipid-based phytosomal system
Anti-Inflammatory Activity of Rutin Loaded Phytosomes
Animals
Swiss albino mice weighing 20-25 gm, wistar rats weighing 150- 200 gm were used for this study. The animals were obtained from animal house. On arrival, the animals were placed randomly and allocated to treatment groups in polypropylene cages with paddy husk as bedding. Animals were housed at a temperature of 24±2ºc and relative humidity of 30-70%. A12: 12 light: day cycle was followed. All animals were allowed to free access to water and bed with standard commercial pelleted chow. All the experimental procedures are protocols used in this study were reviewed by Institutional Animal Ethics Committee.
Acute Toxicity Studies
Acute toxicity was performed according to OECD 423 guidelines. Selected albino rats were used for toxicity studies. The animals were divided into five groups of three in each. The animals were fasting overnight before the acute experimental procedure. The Rutin Loaded Phytosomes was administered orally to rats in doses graduated as 5, 50, 100, 1000 and 2000 mg / kg of body weight. Immediately after dosing, the animals were observed continuously for the first four hours and close behavioural changes were observed to detect hyperactivity, ataxia, convulsions, salivation, tremors, diarrhoea, lethargy and sleep. They were then observed for up to 14 days after drug administration to determine mortality, if present. One tenth and one fifth of the maximum tolerated dose (200 and 400 mg / kg, body weight) of the Rutin Loaded Phytosomes selected to evaluate studies of anti-inflammatory activity in rats.
Carrageenan-Induced Paw Edema in Rats
For this experiment, the rats (120-150g) were divided into four groups (n=6). The group I received 0.5% CMC (10ml/kg), while the Group II received Diclofenac Sodium(10mg/kg). The Group III and IV were treated orally with the Rutin Loaded Phytosomes at a dose of 200 mg/kg and 400 mg/kg orally.
GroupI : Normal Control (CMC)
GroupII : Diclofenac Sodium(10 mg/kg)
GroupIII : Test Drug I [Rutin Loaded Phytosomes (200 mg/kg)]
GroupIV : Test Drug II [Rutin Loaded Phytosomes (400 mg/kg)]
Acute inflammation was produced by injecting 0.1 ml of 1% (w/v) Carrageenan suspension into the sub planter region of the right hind paw of the rats. The animals were pretreated with the drug 1hour before the administration of carrageenan. The paw thickness was measured at 1, 2, 3 and 4 h after carrageenan injection by using digital vernier calipers.
RESULTS AND DISCUSSION:
In vivo Evaluation of Optimized Rutin Phytosomes
In Vitro Antioxidant Activity (DPPH Assay)
The free radical scavenging activity of pure rutin, soybean phosphatidylcholine (SPC), and optimized rutin phytosomes was evaluated using the DPPH assay and compared with ascorbic acid as a standard. Optimized rutin phytosomes exhibited significantly higher DPPH radical scavenging activity compared with pure rutin at equivalent concentrations (10–50 µg/mL).
SPC alone showed negligible scavenging activity, confirming that the observed antioxidant effect was attributable to rutin. The enhanced antioxidant activity of rutin phytosomes may be attributed to improved solubilization and availability of rutin in the phytosomal system. Statistical analysis demonstrated a significant difference (P < 0.05) between pure rutin and optimized rutin phytosomes.
Table 1: In vitro DPPH radical scavenging activity of rutin formulations
|
Treatment |
Concentration (µg/mL) |
% DPPH scavenging (Mean ± SEM) |
|
Ascorbic acid (Standard) |
10 |
41.26 ± 1.18 |
|
|
25 |
63.84 ± 1.42 |
|
|
50 |
82.17 ± 1.36 |
|
Pure rutin |
10 |
28.43 ± 0.97 |
|
|
25 |
44.62 ± 1.21 |
|
|
50 |
61.35 ± 1.09 |
|
Optimized rutin phytosomes |
10 |
36.91 ± 1.05* |
|
|
25 |
57.48 ± 1.33* |
|
|
50 |
75.26 ± 1.27* |
|
Soybean phosphatidyl choline (SPC) |
50 |
6.82 ± 0.64 |
Values are expressed as mean ± SEM (n = 3). P < 0.05 compared with pure rutin (one-way ANOVA followed by Dunnett’s test).
In vivo Hepatoprotective (Liver Function Test) and Antioxidant Activity Studies
Estimation of Liver Marker Enzymes
In the paracetamol-intoxicated group, the SGPT level increased to 120.73 ± 1.59 U/L, the SGOT level increased to 94.26 ± 1.33 U/L, and the total bilirubin level increased to 1.24 ± 0.01 mg/dL, compared with the normal group in which these enzyme levels were 40.98 ± 0.71 U/L, 36.18 ± 1.03 U/L, and 0.58 ± 0.01 mg/dL, respectively.
Further, in the optimized rutin phytosome-treated group, these enzyme levels were restored more effectively and were found to be 81.75 ± 0.53 U/L, 70.64 ± 0.53 U/L, and 0.87 ± 0.01 mg/dL, respectively.
Table 2: Liver function test after Paracetamol induced hepato toxicity in rats on 8th day(n=6).
|
Parameters |
Group–I (Normal) |
Group –II (CCl4 intoxicated) Paracetamol-intoxicated group |
Group – III(Rutin treated)(100 mg/kg) |
Group–IV(Optimized rutinphytosomes treated)(~100mg/kgrutin) |
|
SGPT(U/l) |
40.98±0.71** |
120.73±1.59 |
93.40±0.69** |
81.75±0.53** |
|
SGOT(U/l) |
36.18±1.03** |
94.26±1.33 |
81.25±2.97* |
70.64±0.53** |
|
Total-bilirubin (mg/dl) |
0.58±0.01** |
1.24±0.01 |
0.96±0.01** |
0.87±0.01** |
Values are mean±Std.EM.*P<0.05,**P<0.01(significant with respect to Paracetamol treated group).
Estimation of Antioxidant Marker Enzymes
The results of the assay of antioxidant marker enzymes in normal, paracetamol-intoxicated, rutin-treated, and optimized rutin phytosome-treated rats are presented. In the paracetamol-intoxicated group, the levels of GSH, SOD, and catalase were 20.18 ± 0.74 nmol/mg protein, 4.37 ± 0.01 U/mg protein, and 96.57 ± 0.74 U/mg protein, respectively. These levels were significantly decreased compared with the normal group, which exhibited enzyme levels of 46.23 ± 1.29 nmol/mg protein, 7.28 ± 0.01 U/mg protein, and 204.76 ± 0.99 U/mg protein, respectively.
In the optimized rutin phytosome-treated group, these enzyme levels were better restored toward normal and were found to be 36.57 ± 0.85 nmol/mg protein, 6.24 ± 0.02 U/mg protein, and 164.49 ± 1.01 U/mg protein, respectively.
Further, the TBARS level was increased in the paracetamol-intoxicated group (12.89 ± 0.13 nmol of MDA/mg protein) compared with the normal group (4.98 ± 0.01 nmol of MDA/mg protein). In the optimized rutin phytosome-treated group, the TBARS level was better restored toward normal (9.18 ± 0.10 nmol of MDA/mg protein).
Table 3: Effect of optimized rutin phytosomes on the levels of GSH, SOD and CAT in Paracetamol in toxicated rats on day8(n=6)
|
Parameters |
Group–I (Normal) |
Group– II (Paracetamol intoxicated) |
Group–III (Rutin treated) (100mg/kg) |
Group –IV (Optimized rutin phytosomes treated) (~100mg/kgrutin) |
|
GSH (nmol/mg protein) |
46.23±1.29** |
20.18±0.74 |
31.29±0.63* |
36.57±0.85** |
|
SOD (U/mg protein) |
7.28±0.01** |
4.37±0.01 |
4.93±0.04 |
6.24±0.02** |
|
CAT (U/mg protein) |
204.76±0.99** |
96.57±0.74 |
136.64±1.42* |
164.49±1.01** |
Valuesaremean±Std.EM.*P<0.05,
**P<0.01(significant with respect to Paracetamol-intoxicated group CCl4 treated group)
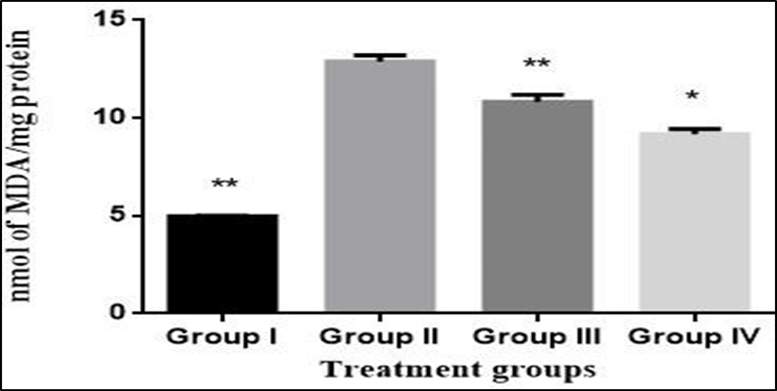
Figure 1: Effect of optimized rutin phytosomes on TBARS
Group I: Normal
Group II: Paracetamol-intoxicated
Group III: Rutin-treated (100 mg/kg)
Group IV: Optimized rutin phytosome-treated (~100 mg/kg rutin)
Values are expressed as mean ± SEM (n = 6).
*P < 0.05, **P < 0.01 (significant with respect to the paracetamol-treated group).
Histopathological Studies
Photomicrographs of rat liver sections from all groups were examined. The normal group liver section showed a clear nucleus, nucleolus, veins, and cytoplasm (Fig. 2A). In contrast, the liver tissues of the CCl₄-intoxicated group Paracetamol-intoxicated group showed visible damage and degeneration of parenchymal cells, degeneration of fatty liver tissue, and damage to the central lobular region.
Pre-treatment with optimized rutin phytosomes (~100 mg/kg rutin) better restored the altered histological changes induced by paracetamol (Fig. 2) compared with pre-treatment using the same dose of pure rutin.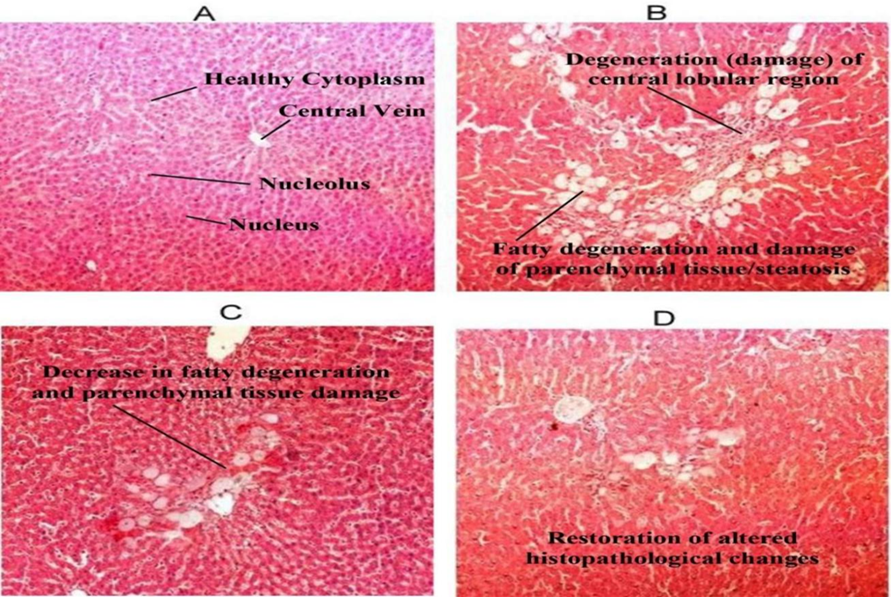
Figure 2: Photo micrographs of normal group rat liver section (A) Paracetamol in toxicated group rat liver section (B) rutin treated group (100 mg/kg) rat liver section (C) and optimized phytosomes treated group(~100mg/kg rutin) rat liver section(D)
Oral Bioavailability Studies
Quantification of Rutin in Rat Serum by HPLC Method
The mean plasma concentration–time curves of pure rutin and optimized rutin phytosomes were obtained by quantification of rutin in the serum of rats treated orally with pure rutin (100 mg/kg, p.o.) and optimized rutin phytosomes (~100 mg/kg rutin). The chromatograms of pure rutin and optimized rutin phytosomes were collected from serum samples at 4 h and 6 h, respectively.
Pure rutin attained a maximum serum concentration (C<sub>max</sub>) of 6.47 ± 0.12 µg/mL. at 4.0 h, whereas optimized rutin phytosomes showed a higher maximum serum concentration of 9.95 ± 0.57 µg/mL at 6.0 h.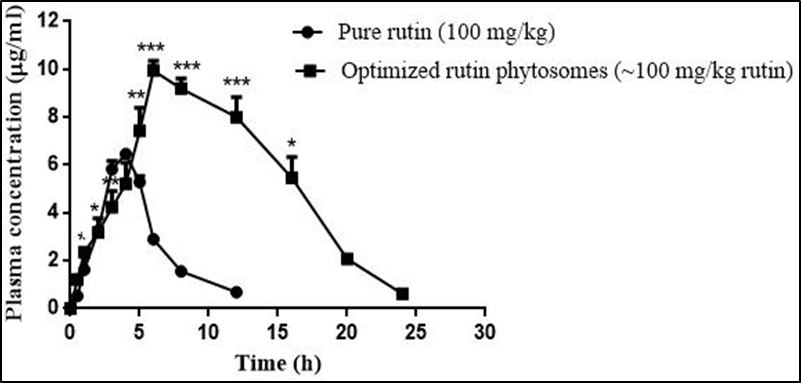
Figure 3: Mean plasma concentration-time profile of rutin (100 mg/kg, p.o.) andoptimized rutin phytosomes (~100 mg/kg of rutin, p.o.).
Values are mean ± Std. EM(n=6). *P<0.05, **P<0.001 and ***P<0.0001(significant with respect to pure rutin treatedgroup)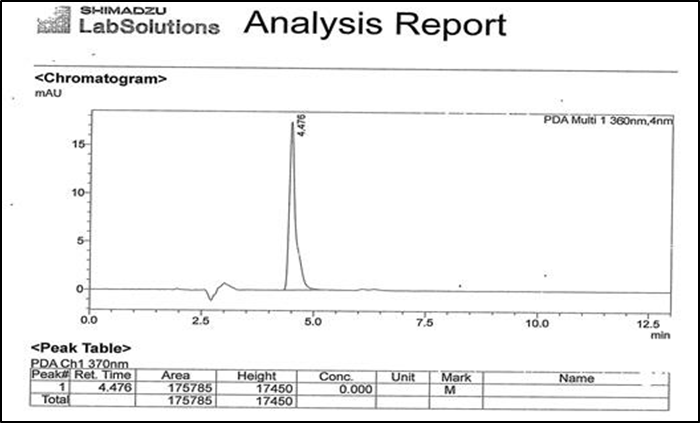
Figure 4:The chromatogram of rutin from pure rutin treated rat serum collected at 4h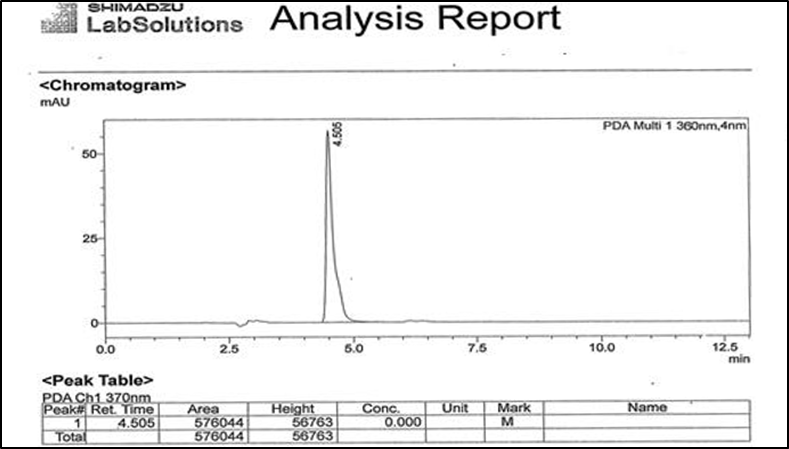
Figure 5: The chromatogram of rutin from optimized rutin phytosomes treated rat serum collected at 6h
Pharmacokinetic parameters
The pharmacokinetic parameters were calculated from the plasma concentration–time curves using the computer software PK Solver®. The C<sub>max</sub>, T<sub>max</sub>, and elimination half-life values were increased to 9.95 ± 0.57 µg/mL, 6.0 h, and 115.61 ± 4.69 µg·mL⁻¹·h, respectively, in the serum of animals treated with optimized rutin phytosomes, compared with animals treated with pure rutin, in which these values were 6.47 ± 0.12 µg/mL, 4.0 h, and 39.51 ± 1.16 µg·mL⁻¹·h, respectively.
The elimination rate constant, clearance, and volume of distribution values were decreased in the optimized rutin phytosome-treated rat serum and were found to be 0.17 ± 0.001 h⁻¹, 0.14 ± 0.002 L/h, and 0.98 ± 0.01 L, respectively, in comparison with animals treated with pure rutin, which showed values of 0.41 ± 0.004 h⁻¹, 0.56 ± 0.002 L/h, and 1.32 ± 0.26 L, respectively.
The optimized rutin phytosomes remained in the body for an extended period and exhibited a high relative bioavailability (F) of 86.23 ± 0.46%.Blood samples were collected from the retro-orbital plexus at 0 (pre-dose), 0.5, 1, 2, 4, 6, 8, 12, and 24 h following oral administration of pure rutin (100 mg/kg) and optimized rutin phytosomes (equivalent to 100 mg/kg rutin).
Pharmacokinetic analysis was performed using noncompartmental analysis (NCA) with PKSolver® (Microsoft Excel add-in). The parameters Cmax and Tmax were obtained directly from experimental data. The area under the plasma concentration–time curve from 0 to last measurable time (AUC₀–t) was calculated using the linear trapezoidal method, and AUC₀–∞ was calculated as AUC₀–t + (Ct/Kel). The elimination rate constant (Kel) was obtained from the terminal log-linear phase, and the elimination half-life (t½) was calculated as 0.693/Kel.
Plasma concentrations below the limit of quantification (BLQ) were considered zero for pre-dose samples and were excluded from terminal phase calculations.
Blood samples were collected at 0 (pre-dose), 0.5, 1, 2, 4, 6, 8, 12, and 24 h post-dosing. The HPLC method was validated over a defined linear range (LLOQ–ULOQ). Pre-dose and post-dose concentrations below the limit of quantification (BLQ) were treated as zero and excluded from terminal phase calculations. The terminal elimination phase was identified by log-linear regression of the final quantifiable concentration–time points.
Table 4: Pharmacokinetic parameters of pure rutin (100 mg/kg) and optimized rutin phytosomes(~100 mg/kgrutin)inrats
|
Pharmacokineticparameters |
Purerutin |
Optimized rutinphytosomes |
|
Cmax(µgml-1) |
6.47±0.12 |
9.95±0.57 |
|
Tmax(h) |
4.0 |
6.0 |
|
AUC0-t(µgml-1h) |
39.51±1.16 |
115.61±4.69 |
|
AUC0-∞(ml-1 h) |
40.44±2.76 |
152.34±6.48 |
|
Elimination half-life(t1/2el)(h) |
1.97±0.10 |
3.49±0.27 |
|
Elimination rate constant(Kel)(h-1) |
0.41±0.004 |
0.17±0.001 |
|
Apparent oral clearance (CL/F) |
0.56±0.002 |
0.14±0.002 |
|
Apparent volume of distribution (Vd/F) |
1.32±0.26 |
0.98±0.01 |
Values are mean± Std.EM(n=6).
Relative oral bioavailability (F) of optimized rutin phytosomes was calculated using dose-normalized AUC₀–∞ values. The phytosomal formulation showed a significant increase in systemic exposure compared with pure rutin, and relative bioavailability is expressed with 95% confidence intervals.
Stability study
The in vitro drug content and drug release study results of the optimized rutin phytosomes during the stability study under normal conditions are presented. Upon storage under normal conditions, optimized rutin phytosomes showed 89.97 ± 0.20% drug content and 72.53 ± 1.99% drug release at 24 h on day 90, without showing a significant difference compared with the drug content and drug release values measured on day 1 (Tables 45 and 65).
The in vitro drug content and drug release study results of the optimized rutin phytosomes during the accelerated stability study are shown in Tables 67 and 87, respectively. Upon storage under accelerated conditions, optimized rutin phytosomes showed 87.62 ± 0.26% drug content and 73.44 ± 1.71% drug release at 24 h on day 90, without showing a significant difference compared with the drug content and drug release values measured on day 1.
Table 5: Drug content of the optimized rutin phytosomes during the stability study
|
EvaluationParameter |
Time(Days) (Normalconditionsat25±2 ˚C&60±5 %RH) |
|||
|
1st day |
30thday |
60thday |
90thday |
|
|
Drug Content(%w/w) |
91.38±0.19 |
90.66±0.08 |
90.13±0.31 |
89.97±0.20 |
Valuesaremean±SD(n=6).
Table 6: In vitro drug release profile of the optimized rutin phytosomes during the stability study (normal condition)
|
Time(h) |
%CDR (Normal condition at 25±2˚C&60±5%RH) |
|||
|
1stday |
30thday |
60thday |
90thday |
|
|
0 |
0 |
0 |
0 |
0 |
|
2 |
9.73±0.18 |
10.24±0.37 |
8.61±0.53 |
9.10±0.93 |
|
4 |
23.51±0.08 |
20.33±1.90 |
21.75±1.71 |
22.55±0.80 |
|
6 |
26.88±0.99 |
24.36±1.15 |
27.88±1.02 |
29.34±0.62 |
|
8 |
28.66±1.92 |
27.44±1.81 |
28.67±1.61 |
30.65±1.39 |
|
10 |
35.48±0.95 |
32.33±1.42 |
37.56±1.72 |
36.22±1.84 |
|
12 |
42.63±0.80 |
43.71±0.78 |
44.66±1.37 |
45.98±2.89 |
|
14 |
51.57±1.00 |
50.41±1.26 |
55.83±1.00 |
52.65±2.25 |
|
16 |
56.74±1.86 |
57.39±0.29 |
58.64±0.33 |
56.66±1.26 |
|
18 |
59.81±1.17 |
60.62±3.02 |
62.37±1.90 |
59.69±0.54 |
|
20 |
63.76±1.59 |
65.30±2.10 |
67.42±2.24 |
66.87±1.86 |
|
22 |
67.18±1.84 |
69.46±2.13 |
69.13±2.60 |
67.11±3.25 |
|
24 |
74.45±0.71 |
73.61±1.52 |
70.78±2.09 |
72.53±1.99 |
Values are mean±SD(n=6).
Table 7: Drug Content of Optimized Rutin Phytosomes (Accelerated Stability Study)
|
EvaluationParameter |
Time(Days) (Acceleratedconditionat40±2 ˚C&75±5%RH) |
|||
|
1st day |
30thday |
60thday |
90thday |
|
|
Drug Content(%w/w) |
90.47±0.44 |
89.54±0.22 |
88.10±0.17 |
87.62±0.26 |
Valuesaremean±SD(n=6).
Table 8: In Vitro Drug Release of Optimized Rutin Phytosomes (Accelerated Stability Study)
|
Time(h) |
%CDR (Accelerated condition at 40±2 ˚C & 75±5%RH) |
|||
|
1stday |
30thday |
60thday |
90thday |
|
|
0 |
0 |
0 |
0 |
0 |
|
2 |
10.12±0.29 |
9.66±0.68 |
10.22±0.94 |
11.26±0.89 |
|
4 |
22.35±0.94 |
21.48±0.99 |
23.33±1.37 |
24.26±1.57 |
|
6 |
27.43±1.49 |
26.47±0.93 |
29.20±1.84 |
27.38±0.99 |
|
8 |
29.45±0.98 |
29.35±1.37 |
32.63±1.95 |
32.22±0.59 |
|
10 |
32.94±0.97 |
33.82±1.35 |
36.42±1.24 |
38.47±1.58 |
|
12 |
39.63±0.80 |
45.33±1.10 |
42.79±1.86 |
43.83±1.91 |
|
14 |
47.72±0.51 |
52.54±1.83 |
50.71±1.71 |
50.56±1.62 |
|
16 |
55.35±1.12 |
56.33±1.62 |
57.66±0.95 |
55.55±1.95 |
|
18 |
58.39±2.21 |
61.66±2.26 |
61.44±1.12 |
59.87±0.54 |
|
20 |
61.99±1.02 |
66.20±2.62 |
66.66±0.62 |
66.87±2.35 |
|
22 |
66.82±2.62 |
70.49±1.91 |
70.38±1.86 |
70.32±2.25 |
|
24 |
76.55±1.37 |
75.34±1.02 |
77.71±1.62 |
73.44±1.71 |
Valuesaremean±SD(n=6).
The analysis of the results gave the significant observations which were discussed in the light of current concepts and interrelationships among the other experimental results.
Anti-Inflammatory Activity
Carrageenan-Induced Paw Edema in Rats
The anti-inflammatory effect of Rutin Loaded phytosomes on carrageenan – induced hind paw edema. The Rutin Loaded phytosomes at doses 200 and 400 mg/kg produced a significant effect against carrageenan induced inflammatory effect. The dose of 400 mg/kg exhibited a significant inhibition of 48 % after 3 h, the effect increased after 3h (52%). Rutin-loaded phytosomes produced a significant reduction in carrageenan-induced paw edema compared with the control group and demonstrated anti-inflammatory activity comparable to the standard drug diclofenac sodium at the tested doses.
Table 9: Anti-inflammatory activity of Rutin Loaded phytosomes on Carrageenan induced paw edema method in Wistar rats
|
Group |
Paw thickness in mm |
% Inhibition at 3hr |
||||
|
0 hr |
1hr |
2hr |
3hr |
4hr |
||
|
Group-I Carrageenan (control) |
1.4±0.03 |
3.4±0.06 |
4.9±0.06 |
6.4±0.05 |
4.8±0.02 |
------ |
|
Group-II Diclofenac Sodium (10mg/kg) |
1.4±0.04 |
2.2±0.03** |
2.9±0.04** |
3.1±0.02** |
2.2±0.04** |
52 |
|
Group-III (200mg/kg of RLP) |
1.2±0.02 |
3.0±0.04 |
4.2±0.03 |
4.7±0.01* |
3.5±0.04** |
27 |
|
Group-IV (400mg/kg of RLP) |
1.1±0.01 |
2.7±0.04** |
3.5±0.02* |
3.3±0.06** |
2.8±0.04** |
48 |
Values were mean ± SEM, (n=6), *P<0.05, **P<0.01 Vs control
RLP= Rutin Loaded phytosomes
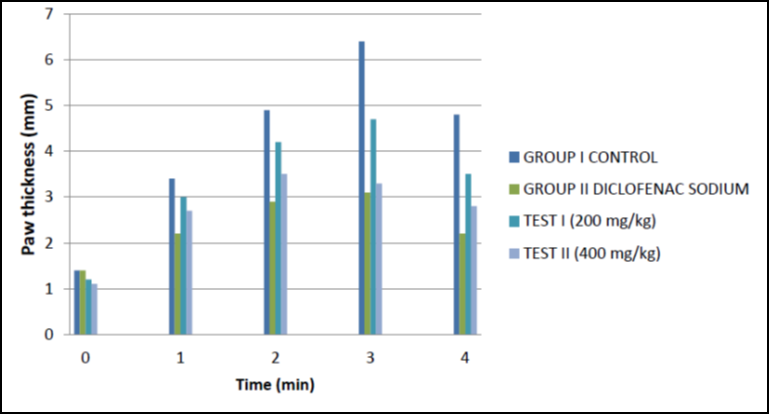
Figure 6: Anti-inflammatory activity of Rutin Loaded phytosomes on Carrageenan induced paw edema method in Wistar rats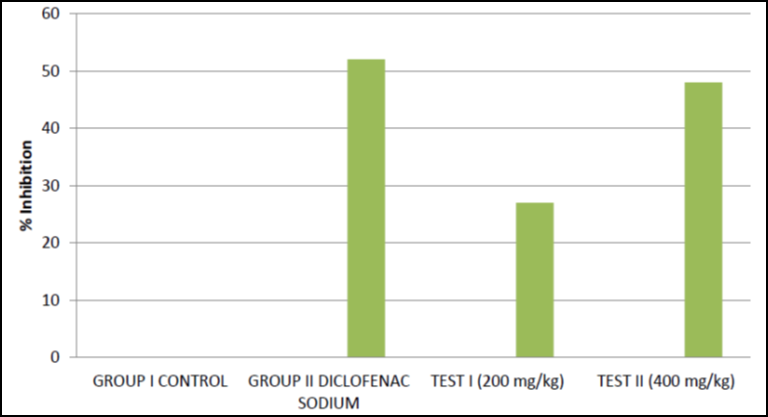
Figure 7: Anti-inflammatory activity of Rutin Loaded phytosomes on carrageenan induced paw edema method in Wistar rats
It should be noted that a free rutin group at an equivalent dose was not included in the present carrageenan-induced paw edema study. Therefore, direct head-to-head comparison and estimation of effect sizes between free rutin and rutin-loaded phytosomes could not be performed. The enhanced anti-inflammatory response observed for the phytosomal formulation may be attributed to improved oral bioavailability and prolonged systemic exposure, as supported by the pharmacokinetic findings. Future investigations incorporating a free rutin comparator are warranted to establish formal superiority with confidence interval–based effect size estimation.
Statistical Analysis
All experimental data are expressed as mean ± standard error of the mean (SEM). Statistical analysis was performed using GraphPad Prism software. Prior to analysis, data distribution was assessed for normality using visual inspection and standard normality assumptions applicable to parametric tests.
Comparisons among multiple groups were performed using one-way analysis of variance (ANOVA) followed by Dunnett’s post-hoc test for comparison against the control group. Pharmacokinetic parameters between pure rutin and optimized rutin phytosomes were compared using an unpaired Student’s t-test.
A P value < 0.05 was considered statistically significant. Sample size (n = 6 animals per group) was selected based on previous pharmacological studies using similar in vivo models, which consistently
Results & Discussion
Characterization of an independently prepared batch of the optimized formulation showed comparable particle size, PDI, zeta potential, encapsulation efficiency, and drug loading values, confirming batch-to-batch reproducibility of the rutin phytosomal system.
The cumulative drug release data of optimized rutin phytosomes were subjected to kinetic modeling using zero-order, first-order, Higuchi, and Korsmeyer–Peppas equations. The release profile showed the highest correlation with the Higuchi/Korsmeyer–Peppas model, indicating diffusion-controlled release from the phytosomal matrix.
Differences are reported as mean differences with 95% confidence intervals and exact P-values.
CONCLUSION :
The anti-inflammatory activity of rutin-loaded phytosomes was evaluated using a carrageenan-induced paw edema model in rats. The results demonstrated significant anti-inflammatory effects of rutin-loaded phytosomes compared with control, with efficacy comparable to the standard anti-inflammatory drug diclofenac sodium
Overall, this study contributes valuable insights into the development and evaluation of rutin-loaded phytosomes, highlighting their promising therapeutic applications in various disease conditions. Further research is warranted to explore their clinical efficacy and safety profiles, with potential implications for pharmaceutical and nutraceutical industries.
A free rutin dissolution profile was not included in the present release study; therefore, direct comparison of release behavior could not be performed. Future studies will incorporate a free-drug comparator to further elucidate the release enhancement achieved by phytosomal formulation.
BIBLIOGRAPHY:
1. Aguiar GPS, Arcari BD, Chaves LMPC, Magro CD, Boschetto DL, Piato AL, et al. Micronization of trans-resveratrol by supercritical fluid: dissolution, solubility and in vitro antioxidant activity. Ind Crop Prod. 2018;112:1–5. DOI:10.1016/j.indcrop.2017.11.008
2. Barani, M., Sangiovanni, E., Angarano, M., Rajizadeh, M. A., Mehrabani, M., Piazza, S., Nematollahi, M. H. (2021). Phytosomes as Innovative Delivery Systems for Phytochemicals: A Comprehensive Review of Literature. International Journal of Nanomedicine, 16, 6983–7022. https://doi.org/10.2147/IJN.S318416
3. Cui J, Yu B, Zhao Y, Zhu W, Li H, Lou H, et al. Enhancement of oral absorption of curcumin by self-microemulsifying drug delivery systems. Int J Pharm. 2009;371(1–2):148–155.DOI: 10.1016/j.ijpharm.2008.12.009
4. Gao L, Liu G, Wang X, Liu F, Xu Y, Ma J. Preparation of a chemically stable quercetin formulation using nanosuspension technology. Int J Pharm. 2011;404(1–2):231–237.DOI: 10.1016/j.ijpharm.2010.11.009
5. Kakran M, Sahoo NG, Tan I, Li L. Preparation
of nanoparticles of poorly water-soluble antioxidant curcumin by antisolvent precipitation methods. J Nanoparticle Res. 2012;14:757.DOI:10.1007/s11051-012-0757-0
6. Khan AW, Kotta S, Ansari SH, Sharma RK, Ali J. Enhanced dissolution and bioavailability of grapefruit flavonoid naringenin by solid dispersion utilizing fourth generation carrier. Drug Dev Ind Pharm. 2015;41(5):772–779.DOI: 10.3109/03639045.2014.902466
7. Khanh NV et al. demonstrated rutin phytosome preparation, reporting particle size, PDI, zeta potential, encapsulation efficiency and FTIR characterization.
8. DOI: https://doi.org/10.25073/2588-1132/vnumps.4123
9. Kumar N, Rai A, Reddy ND, Raj PV, Jain P, Deshpande P. Silymarin liposome improves oral bioavailability of silybin besides targeting hepatocytes and immune cells. Pharmacol Rep. 2014;66(5):788–798. DOI: 10.1016/j.pharep.2014.04.007
10. Kumbhar, S., Patil, N., Patil, B., You, H. W., & Bhatia, M. (2024). Unleashing the Power of Rutin-Loaded Nanophytosomes: Enhancing Antioxidant Potential for Improved Health Outcomes. World Journal of Environmental Biosciences, 13(3), 8-15. https://doi.org/10.51847/P5y5gxQ5no
11. Li B, Harich K, Wegiel L, Taylor LS, Edgar KJ. Stability and solubility enhancement of ellagic acid in cellulose ester solid dispersions. Carbohydr Polym. 2013;92(2):1443–1450 •DOI: 10.1016/j.carbpol.2012.10.051
12. Mignet N, Seguin J, Romano MR, Brullé L, Touil YS, Scherman D, et al. Development of a liposomal formulation of the natural flavonoid fisetin. Int J Pharm. 2012;423(1):69–76. DOI: 10.1016/j.ijpharm.2011.04.066
13. Paczkowska M, Mizera M, Piotrowska H, Szymanowska-Powałowska D, Lewandowska K, Goscianska J, et al. Complex of rutin with β-cyclodextrin as a potential delivery system. PLoS One. 2015;10(3):e0120858. doi: 10.1371/journal.pone.0120858
14. Qian YS, Kumar RH, Meka VS, Dharmalingam SR. Preparing kaempferol nanosuspension (KNS) using high pressure homogenization (HPH) technique. BMC Proc. 2015;9(Suppl 7):A22. doi: 10.1186/1753-6561-9-S7-A22
15. Steigerwalt R, Nebbioso M, Appendino G, Belcaro G, Ciammaichella G, Cornelli U, et al. Meriva®, a lecithinized curcumin delivery system, in diabetic microangiopathy and retinopathy. Panminerva Med. 2012;54(1 Suppl 4):11–16. https://pubmed.ncbi.nlm.nih.gov/23241930/
16. Yanyu X, Yunmei S, Zhipeng C, Qineng P. The preparation of silybin-phospholipid complex and the study on its pharmacokinetics in rats. Int J Pharm. 2006;307(1):77–82. DOI: 10.1016/j.ijpharm.2005.10.001
17. Yao W, Sun K, Mu H, Liang N, Liu Y, Yao C, et al. Preparation and characterization of puerarin-dendrimer complexes as an ocular drug delivery system. Drug Dev Ind Pharm. 2010;36(9):1027–1035. DOI: 10.3109/03639041003610799
18. Zhao C, Wang Y, Su Y, Zhang H, Ding L, Yan X, et al. Inclusion complexes of isoflavones with two commercially available dendrimers: solubility, stability, structures, release behaviors, cytotoxicity, and antioxidant activities. Int J Pharm. 2011;421(2):301–309. DOI: 10.1016/j.ijpharm.2011.09.044
19. Zu Y, Wu W, Zhao X, Li Y, Wang W, Zhong C, et al. Enhancement of solubility, antioxidant ability, and bioavailability of taxifolin nanoparticles by liquid antisolvent precipitation technique. Int J Pharm. 2014;471(1–2):366–376. DOI: 10.1016/j.ijpharm.2014.05.049
20. Magalingam KB, Radhakrishnan A, Haleagrahara N. Rutin, a bioflavonoid antioxidant, protects rat pheochromocytoma (PC-12) cells against 6-hydroxydopamine (6-OHDA)-induced neurotoxicity. Int J Mol Med. 2013;32(1). DOI: 10.3892/ijmm.2013.1375
21. Maiti K, Mukherjee K, Gantait A, Saha BP, Mukherjee PK. Curcumin–phospholipid complex: Preparation, therapeutic evaluation and pharmacokinetic study in rats. Int J Pharm. 2006;330(1–2):155–163.DOI: 10.1016/j.ijpharm.2006.09.025
22. Wilson RH, Mortarotti TG, Doxtader EK. Toxicity Studies on Rutin. Proceedings of the Society for Experimental Biology and Medicine. 1947;64(3):324-327. doi:10.3181/00379727-64-15781