Phytochemical and Spectral Characterisation of Standardized Moringa oleifera and Curcuma longa Extract Fractions
- Priyanka U. Telang , Ms. Priyanka U. Telang Ph.D. Research scholar, School of Pharmacy, SRTMU, Nanded. priyankatelang99@gmail.com
- Surendra G. Gattani , Surendra Gattani- Senior Professor, School of Pharmacy, SRTMU, Nanded. sggattani@gmail.com
Article Information:
Abstract:
Metabolic syndrome (MetS) is a complex illness characterized by obesity, insulin resistance, dyslipidemia, and hypertension, which elevates the risk of cardiovascular disease and type 2 diabetes mellitus. Natural products like Moringa oleifera and Curcuma longa (Curcumin) are recognized for their multifaceted therapeutic potential, encompassing antioxidant, anti-inflammatory, antidiabetic, and cardioprotective activities. Although traditionally utilized, comprehensive phytochemical standardization and spectrum characterization are crucial for ensuring purity, repeatability, and medicinal efficacy Methods:Leaves specimens of Moringa oleifera and rhizome of Curcuma longa were gathered, shade-dried, pulverized, and underwent sequential solvent extraction. Extracts were standardized by assessing foreign organic matter, moisture content, ash, and extractive values. Initial phytochemical analysis revealed bioactive compounds. Thin-layer chromatography (TLC) and column chromatography were utilized to isolate active fractions, which were further characterized by high-performance thin-layer chromatography (HPTLC). Structural elucidation was conducted utilizing UV–Vis, FTIR, 1H NMR, and mass spectrometry.Major Findings: Moringa extracts were dark green, semisolid, and adhesive, with an ethanol yield of 12.14%, whereas Turmeric extracts were yellowish semisolids with a yield of 9.85% ethanol. Phytochemical investigation verified the existence of flavonoids, terpenoids, alkaloids, steroids, and tannins. TLC and HPTLC demonstrated several unique spots and Rf patterns. Spectroscopic examination revealed a flavonoid analogue from Moringa oleifera and a curcumin analogue from Curcuma longa.Conclusion:The research standardized and described extracts of Moringa oleifera and Curcuma longa, emphasizing their abundant phytochemical compositions and potential, thereby endorsing their application in the management of metabolic illnesses.
Keywords:
Article :
INTRODUCTION:
Metabolic syndrome (MetS) is a multifaceted disorder defined by a combination of metabolic irregularities, including obesity, insulin resistance, dyslipidemia, and hypertension, which combined elevate the risk of cardiovascular disease and type 2 diabetes mellitus. The increasing global incidence of MetS has emerged as a significant public health issue, requiring the formulation of effective preventative and therapeutic measures. Conventional pharmaceutical therapies exist, although they frequently address isolated components of MetS and may have long-term deleterious consequences. This has resulted in heightened interest in natural products and plant-based therapies owing to their multi-targeted mechanisms, enhanced safety profiles, and supplementary therapeutic advantages.
Moringa oleifera (MO), known as moringa, is a nutritionally dense medicinal plant extensively utilized in traditional medicine practices. It is acknowledged for its many pharmacological attributes, encompassing antioxidant, anti-inflammatory, antidiabetic, and cardioprotective effects [1,2]. Prior investigations by our research team have established the therapeutic effectiveness of moringa infusion in the therapy of metabolic disorders, specifically in regulating illness development post-onset [3, 4]. Moreover, numerous studies have emphasized the advantageous impacts of polar extracts of moringa, including ethanol and methanol fractions, on metabolic health [5, 6]. Phytochemical investigations of moringa have identified flavonoids, phenolic acids, and powerful antioxidant substances, including quercetin [7,8]. Other bioactive compounds, such as alkaloids, glycosides, tannins, saponins, and terpenoids, have been found and are thought to enhance its diverse therapeutic effects [9]. Niaziridin, a nitrile glycoside included in moringa extracts, is linked to anti-inflammatory properties and the reduction of pulmonary hypertension, whilst moringinine exhibits potential neuroprotective effect.
Curcumin (CUR), a bioactive polyphenol derived from the rhizome of Curcuma longa, has garnered considerable interest owing to its broad medicinal potential. Curcumin has been documented to provide protective effects against various pathological situations, including neurological illnesses, infections, cancer, and metabolic disorders [11–13]. Curcuma longa, generally referred to as turmeric, is extensively utilized as a culinary spice, natural dye, and dietary supplement. Curcumin possesses antioxidant, anti-inflammatory, antidiabetic, and anticancer attributes, rendering it a significant contender for the prevention and control of chronic illnesses [14,15]. Its enduring application in traditional medicinal systems, including Ayurveda, Thai medicine, and ancient Chinese medicine, further substantiates its therapeutic significance [16,17].
Despite the significant medicinal potential of Moringa oleifera and Curcuma longa, comprehensive phytochemical standardization and spectrum characterization of their extract fractions are crucial for ensuring repeatability, quality control, and therapeutic efficacy. The current study seeks to conduct phytochemical and spectral characterisation of standardized extracts of Moringa oleifera and Curcuma longa fractions, establishing a solid foundation for their prospective use in managing metabolic diseases.
Materials and Methods:
Materials
All chemicals, including chloroform, hydrochloric acid, ethanol, petroleum ether, sulfuric acid, 5% ferric chloride, toluene, ethyl acetate, acetic acid, and formic acid, were procured from Merck and Cosmo Chem Pvt. Ltd. All solvents are of analytical grade.
Methods
Collections and Drying
Moringa oleifera (leaves) and Curcuma longa (rhizome) was harvested from the Latur district of Maharashtra, India, and subsequently shade-dried under controlled settings to prevent exposure to direct sunlight. The desiccated plant matter was subsequently pulverized into a coarse powder. Fine particles were eliminated by running the powdered substance through a 120-mesh sieve.
Standardization of plants materials
Determination of foreign organic matter
A thin layer of 5 g of coarsely powdered, air-dried drug material was distributed on a clean surface. The specimen was inspected visually and using a 6× magnifying lens. Foreign organic materials were meticulously isolated to the fullest extent practicable. The quantity of foreign organic matter was ascertained by weighing the isolated material and expressing it as a proportion of the initial sample weight [18].
Determination of moisture content
An accurately weighed, clean, dry weighing bottle equipped with a glass stopper was utilized. Approximately 2 g of the sample was introduced into the bottle, uniformly distributed to a maximum depth of 10 mm, after which the bottle was sealed and weighed. The filled bottle was thereafter positioned in an oven and dehydrated until a stable weight was achieved. Upon drying, the bottle was extracted from the oven and permitted to cool to ambient temperature within a desiccator. The loss on drying was determined and represented as a percentage weight loss (% w/w) [19].
Ash value
The residual ash from the burning of the medicinal plant material was assessed utilizing three distinct methodologies: total ash, acid-insoluble ash, and water-soluble ash, in accordance with established protocols [20].
Determination of Total ash
Approximately 2 g of the air-dried crude medication was precisely measured and positioned in a pre-weighed silica dish. The material was burned at a temperature not above 450 °C until devoid of carbon. Upon permitting the dish to attain room temperature, the mass of the ash was documented. The total ash content was determined based on the air-dried substance and expressed as % w/w [21].
Determination of Water- soluble ash
The ash produced by the aforementioned process was subjected to boiling with 25 mL of water for 5 minutes, thereafter filtered, and the insoluble residue was gathered on ashless filter paper. The residue was rinsed with hot water and incinerated for 15 minutes at a temperature not surpassing 450 °C. Upon cooling, the mass of the insoluble residue was documented. The water-soluble ash was determined by subtracting the weight of the insoluble residue from the total ash weight and was represented as % w/w relative to the air-dried medication.
Determination of Acid -insoluble ash
The ash was subjected to boiling with 25 mL of 2 M hydrochloric acid for 5 minutes, thereafter filtered, and the insoluble residue was retained on ashless filter paper. The residue was rinsed with hot water, incinerated at a temperature not beyond 450 °C, cooled in a desiccator, and subsequently weighed. The acid-insoluble ash concentration was determined and represented as a percentage by weight (% w/w) relative to the air-dried medication.
Extractive values
Multiple extractive values, encompassing water-soluble and alcohol-soluble extractive values, were assessed utilizing established pharmacopoeial methodologies.
Determination of water-soluble extractive value
One hundred milliliters of chloroform water was incorporated into 1.5 g of air-dried, coarsely powdered medication and macerated in a sealed container for 24 hours. The mixture was agitated intermittently for the initial 6 hours and subsequently permitted to rest for the ensuing 18 hours. Following filtration, 25 mL of the filtrate was placed in a shallow, flat evaporating dish, evaporated to dryness, and subsequently dried at 105 °C until a consistent weight was achieved. The water-soluble extractive value was determined and represented as % w/w relative to the air-dried substance [24].
Determination of Alcohol-soluble extractive value
In a sealed flask, 1.5 g of air-dried, finely powdered medication was macerated with 100 mL of ethanol of appropriate concentration for 24 hours. The mixture was agitated intermittently for the initial 6 hours and subsequently permitted to rest for the ensuing 18 hours. Following meticulous filtration to avert ethanol loss, 25 mL of the filtrate was placed in a shallow, flat evaporating dish, evaporated to dryness, and subsequently dried at 105 °C until a consistent weight was achieved. The ethanol-soluble extractive value was determined and represented as % w/w relative to the air-dried substance [25].
Extraction
Sequential extractions were conducted utilizing solvents of ascending polarity: petroleum ether (60–80 °C), ethanol, and water. The procedure was conducted in several batches utilizing a Soxhlet extractor to guarantee thorough extraction for each solvent fraction. At intervals, aliquots from the siphon tube were applied to thin-layer chromatography (TLC) plates and subjected to iodine vapor exposure. The lack of colorful dots signified the completion of extraction with the corresponding solvent. The solvent from each extract was then eliminated using distillation, utilizing lower pressure as required, and the concentrated residue was permitted to air dry. The desiccated extract was subsequently stored in hermetically sealed containers to maintain its integrity. The identical approach was adhered to for each subsequent solvent. The residual plant material (marc) was meticulously oven-dried to eliminate any remaining solvent before to advancing to the subsequent extraction phase. The desiccated plant material underwent reflux with distilled water for around three hours to provide the aqueous extract.
Phytochemical Test
The phytochemical tests are given in table 1
Table 1: Phytochemical Test
|
Sr. No |
Phytochemical Test |
Procedure |
Observation |
|
1 |
Test for Flavonoids |
Dispense 1–2 mL of the plant extract into a sterile test tube. Carefully add several drops of pure sulfuric acid (H₂SO₄). Monitor any alteration in hue, which signifies the existence of particular phytochemical elements.
|
Yellow/orange color |
|
2 |
Test for Terpenoids |
Dispense 1–2 mL of the plant extract into a sterile test tube. Incorporate 2 mL of chloroform into the extract. Gradually introduce 1–2 mL of concentrated sulfuric acid (H₂SO₄) down the interior wall of the test tube to create a distinct layer. Examine the contact between the layers for any chromatic alteration, which signifies the presence of particular phytochemical ingredients.
|
reddish-brown layer |
|
3 |
Test for alkaloids |
Dispense 1–2 mL of the plant extract into a sterile test tube. Introduce 1 mL of Dragendorff’s reagent to the extract. Note the emergence of a precipitate, signifying the presence of alkaloids.
|
orange/reddish-brown precipitate |
|
4 |
Test for steroids |
Dispense 1–2 mL of the plant extract into a sterile test tube. Introduce 2 mL of chloroform to the extract. Gradually introduce 2 mL of concentrated sulfuric acid (H₂SO₄) along the interior wall of the test tube to create a distinct layer. Examine the interface for the emergence of a colorful ring, signifying the presence of particular phytochemical elements.
|
reddish-brown ring |
|
5 |
Test for tannins |
Dispense 1–2 mL of the plant extract into a sterile test tube. Introduce several drops of a 5% ferric chloride (FeCl₃) solution. Monitor any alteration in hue, which signifies the existence of phenolic compounds or tannins.
|
Blue black/greenish color |
Characterization of Bioactive Fractions by TLC
Subsequent to the pharmacological assessment of the ethanol fractions, the active fractions underwent thin-layer chromatography (TLC) for the identification of phytocomponents. The TLC examination of Moringa oleifera extract, employing the solvent system chloroform: methanol: water (2:1:2), identified three unique spots. Conversely, thin-layer chromatography of Curcuma longa extract, utilizing chloroform: methanol (9.8:2), revealed several spots, signifying the presence of various components.
Table 2: TLC studies of plant extracts
|
Sr. No |
Extracts |
Solvent system (v:v:v) |
No. of spots |
|
1 |
Moringa oleifera |
Chloroform: methanol: water (2:1:2) |
03 |
|
2 |
Curcuma longa |
chloroform and methanol (9.8:2) |
Column Chromatography of Active Extracts
Initial phytochemical analysis of Moringa oleifera and Curcuma longa extracts revealed the existence of several phytochemicals in both ethanol and chloroform fractions. Column chromatography was conducted on these active extracts to isolate specific phytometabolites for subsequent study.
High Performance Thin Layer Chromatography (HPTLC) Fingerprint Analysis
1. Preparation of Extract
Each plant extract was dissolved in its respective solvent at a concentration of 5 mg/mL.
2. Application of Extract
The obtained extracts (5 mg/mL) were applied to HPTLC plates (10 × 10 cm) with a Linomat syringe. The samples were applied in bands measuring 5–6 mm in width, with a separation of 6 mm between them.
3. Development of the Chromatogram
The HPTLC plates were generated in a CAMAG twin-trough chamber with an optimum solvent mixture, as determined for TLC analysis. Upon reaching a development of 80 mm, the plates were extracted from the chamber and permitted to air-dry.
4. Scanning of the Chromatogram
The prepared plates were analyzed with a CAMAG HPTLC Scanner in absorbance mode at wavelengths of 254, 366, and 560 nm. The scanned data were examined utilizing the WinCATS planar chromatography manager software. Fingerprint chromatograms were produced to document the Rf values, band colors, and other distinctive characteristics of the chemicals found in the extracts. Bands at 254, 366, and 560 nm were seen without any supplementary derivatizing agents [26]
Structural Elucidation of Isolated Fractions
The fractions associated with TLC spots were subsequently analyzed using spectroscopic methods, including UV–Vis, mass spectrometry (MS), Fourier-transform infrared spectroscopy (FTIR), and proton nuclear magnetic resonance (^1H NMR), to ascertain their structural characteristics.
RESULTS AND DISCUSSION:
Collections and Drying
The specimens of Moringa oleifera (leaves) and Curcuma longa (rhizome) were successfully gathered from the Latur region of Maharashtra, India. Shade drying in controlled settings produced dried plant material with negligible browning and no evidence of microbial contamination. The desiccated plants were further pulverized into coarse powder, and finer particles were eliminated by sifting through a 120-mesh screen. The resultant powdered substance exhibited a consistent texture, making it appropriate for subsequent extraction and phytochemical investigations.
Authentication
The identities of the collected plants were verified by comparing their morphological characteristics. Authentication was confirmed by the Botanical Survey of India, Pune, Maharashtra state, India (BSI/WRC/Iden.Cer./2021).
Standardization of plants materials
Determination of foreign organic matter
The examination of foreign organic matter indicated that Moringa oleifera leavest comprised 0.5% w/w of foreign material, but Curcuma longa rhizome exhibited a reduced contamination level of 0.1% w/w. Both plant materials comply with the acceptable purity standards, since the allowable limit for foreign organic materials does not exceed 2% w/w.
Determination of moisture content
The moisture content of the extracts was assessed, yielding findings within acceptable parameters. The loss on drying (LOD) analysis indicated that Moringa oleifera leaves initially possessed a moisture content of 0.00% w/w, which marginally rise to 0.19% after 1 hour and stabilized at 0.20% from 2 to 4 hours. Likewise, Curcuma longa (rhizome) commenced at 0.00% w/w, escalated to 0.20% at 1 hour, and attained 0.22% at 2 hours, sustaining this concentration through 3 and 4 hours. The results demonstrate negligible and consistent moisture loss over time for both extracts, affirming that all plant extracts remain below the permitted limits of detection.
Determination of Ash value
The ash content of the plant materials was analysed to determine their inorganic residue profiles. The leaves of Moringa oleifera demonstrated a total ash content of 2.0% w/w, an acid-insoluble ash of 1.8% w/w, and a water-soluble ash of 0.5% w/w. In contrast, Curcuma longa (Rhizome) exhibited a marginally elevated total ash level of 3.0% w/w, comprising acid-insoluble ash at 1.6% w/w and water-soluble ash at 0.2% w/w. The results reveal significant disparities in the inorganic makeup of the two plant materials.
Determination of Extractive values
The extractive qualities of the plant materials were assessed to determine the solubility of their contents in various solvents. The leaves of Moringa oleifera had ethanol-soluble and water-soluble extractive values of 10.5% w/w and 7.9% w/w, respectively. In contrast, Curcuma longa (rhizome) exhibited marginally elevated values, with an ethanol-soluble extractive value of 12.5% w/w and a water-soluble extractive value of 8.1% w/w, signifying superior solubility of its components in both solvents compared to Moringa oleifera.
Extraction
Extraction was conducted in several batches utilizing different solvents. The characteristics and yield percentages of each extract are summarized below. The extraction investigation of Moringa oleifera had shown that all solvent fractions yielded dark green, semisolid, and viscous extracts. Ethanol produced the maximum yield at 12.14%, followed by ethyl acetate at 7.45%, chloroform at 4.58%, aqueous extract at 5.05%, and petroleum ether, which exhibited the lowest yield at 3.56%.
Yield of Various Extracts from the leaves powder (Moringa Oleifera)
The extraction of Moringa oleifera with various solvents produced dark green, semisolid, and viscous extracts. Of the solvents evaluated, ethanol yielded the greatest percentage (12.14%), signifying its superior efficacy in extracting bioactive compounds. Petroleum ether yielded the least (3.56%), whereas chloroform, ethyl acetate, and aqueous extracts had reasonable yields. The results indicate that solvent polarity markedly affects the extraction efficiency of Moringa phytoconstituents.
Yield of Various Extracts from rhizome powder (Curcuma longa)
All solvent fractions of Curcuma longa yielded yellowish, semisolid extracts. Ethanol had the maximum extraction yield at 9.85%, followed by chloroform at 7.45%, ethyl acetate at 6.52%, petroleum ether at 6.22%, and the aqueous extract, which exhibited the lowest yield at 6.07%.
Preliminary Phytochemical Screening
The initial phytochemical study of the extracts revealed the existence of many bioactive compounds, such as triterpenoids, steroids, glycosides, saponins, alkaloids, flavonoids, tannins, proteins, free amino acids, carbohydrates, and vitamins. The data indicate that both plant extracts are abundant in various phytometabolites with potential pharmacological properties.
Phytochemical test of Moringa oleifera Extract
The initial phytochemical analysis of the extract revealed the presence of flavonoids, as validated by a positive H₂SO₄ test. Tests for terpenoids, alkaloids, steroids, and tannins yielded negative results, indicating their absence or levels below detectable thresholds in the extract. The data suggest that flavonoids are likely the primary bioactive components responsible for the extract's pharmacological activity. Additional chromatographic and spectroscopic investigations are necessary to thoroughly describe these flavonoid molecules.
Table 3: Phytochemical test of Moringa Extract
|
Sr. No. |
Phytochemical test |
Test Extracts |
|
|
||
|
1. |
Test for Flavonoids |
|
|
|
H2SO4 Test |
+ |
|
2. |
Test for Terpenoids |
|
|
|
Choloroform test |
- |
|
3 |
Test for alkaloids |
|
|
|
Dragondroff’s reagent |
- |
|
4 |
Test for steroids |
|
|
|
Salkowski test |
- |
|
5 |
Test for tannins |
|
|
|
FeCl3 test |
- |
+ Indicates presence of phytoconstituents, - Indicates absence of phytoconstituents
Phytochemical test Curcuma longa Extract
The initial phytochemical analysis of the Curcuma longa (rhizome) extract verified the existence of terpenoids, although flavonoids, alkaloids, steroids, and tannins were not detected. The affirmative terpenoid reaction indicates the existence of curcumin, a polyphenolic molecule generated from terpenoids that accounts for the primary pharmacological effects of the plant. The results suggest that the biological effects of the extract are mostly due to terpenoid components.
Table 4: Phytochemical test of Curcuma longa Extract
|
Sr. No. |
Phytochemical test |
Test Extracts |
|
|
||
|
1. |
Test for Flavonoids |
|
|
|
H2SO4 Test |
- |
|
2. |
Test for Terpenoids |
|
|
|
Choloroform test |
+ |
|
3 |
Test for alkaloids |
|
|
|
Dragondroff’s reagent |
- |
|
4 |
Test for steroids |
|
|
|
Salkowski test |
- |
|
5 |
Test for tannins |
|
|
|
FeCl3 test |
- |
The phytochemical study of 95% ethanol extracts from Moringa oleifera and Curcuma longa identified the presence of flavonoids, terpenoids, alkaloids, steroids, and tannins.
Thin layer chromatography of extract
The thin layer chromatography of the plant extracts revealed well-defined and distinct spots corresponding to alkaloids, flavonoids, tannins, and steroids under optimum mobile phases. The measured Rf values and distinct color reactions post-spraying validated the existence and varied distribution of these phytoconstituents across different solvent extracts. The disparity in Rf values among solvents indicates variations in polarity and chemical makeup of the extracts. The TLC results affirm the repeatability and reliability of phytochemical profiling of the extracts.
Table 5: Thin Layer Chromatography of all extracts.
|
Sr. no. |
Chemical constituent |
Mobile Phase |
Visualization Spraying reagent |
Color of spot |
Rf- value |
|
1. |
Alkaloids |
Ethyl acetate: Formic acid: Toluene (40:10:50)
|
10% H2SO4 in ethanol |
Violet -blue |
Petroleum ether :0.71 Ethanol: 0.87 Chloroform : 0.86 |
|
2. |
Flavonoid |
Ethyl acetate: Toluene: |
Anisaldehyde – Sulfuric acid. |
Yellowish green |
Petroleum ether: 0.73 Ethanol: 0.81 Chloroform : 0.89 |
|
3. |
Tannin |
Water: acetic acid: ethyl acetate: formic acid (26:11:100:11) |
5 % FeCl3 in 0.1N HCl |
Black |
Ethanol : 0.62 |
|
4. |
Steroids |
Methanol: Acetic acid: Ethyl acetate (20:10:70)
|
Vanillin – Sulfuric acid. |
Pink |
Petroleum ether: 0.83 Ethanol: 0.75 Chloroform: 0.46 Ethyl acetate : 0.82 |
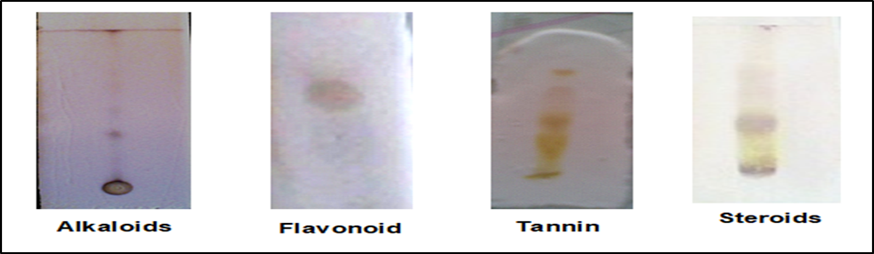
Figure 1: TLC chromatography for Alkaloid, flavonoid, tannins and steroids
Column Chromatography of Active Extract of both Plant Extract
Preliminary phytochemical tests conducted on the selected plant materials using ethanol and chloroform extracts have shown the presence of alkaloids, steroids, flavonoids, and terpenoids. The TLC of the extract also indicates the presence of several phytometabolites. The ethanol and chloroform extract demonstrates significant potential phytoconstituents. Isolation of phytocomponents from ethanol was necessary.
Percent yield and Appearance of all fractions.
The fractionation of plant extracts was carried out using different mobile phases. For Moringa extract, ethyl acetate and methanol in a 5:5 ratios were used, resulting in three fractions: MEF1 (0.78 g, 2.9% w/w), MEF2 (0.69 g, 2.8% w/w), and MEF3 (0.72 g, 3.2% w/w). For Curcumin extract (95% powder), methanol was used as the mobile phase, yielding three fractions: CEF1 (0.94 g, 5.4% w/w), CEF2 (0.89 g, 4.2% w/w), and CEF3 (0.82 g, 4.9% w/w).
A] Ethanol Extract Column Chromatography
Table 6: Appearance and percent yield of all fractions.
|
Plant Name |
Mobile phase |
Fraction Designation |
Weight of fraction (gm.) |
% Yield w/w |
|
Moringa oleifera extract |
Ethyl acetate: Methanol (5: 5) |
MEF1 |
0.78 |
2.9 |
|
MEF2 |
0.69 |
2.8 |
||
|
MEF3 |
0.72 |
3.2 |
||
|
Curcuma longa extract |
Methanol |
CEF1 |
0.94 |
5.4 |
|
CEF2 |
0.89 |
4.2 |
||
|
CEF3 |
0.82 |
4.9 |
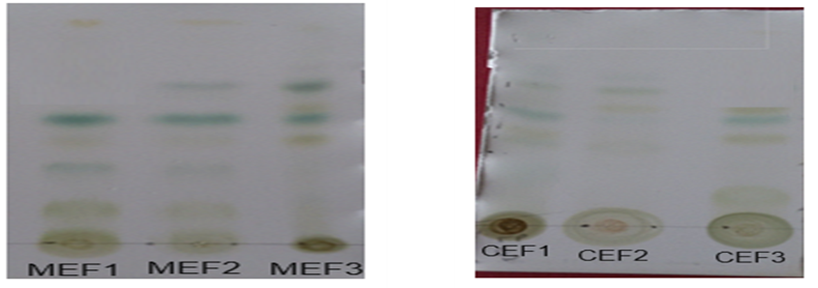
Figure 2: [a] TLC chromatograph of Moringa oleifera extract [b] TLC chromatograph of Curcuma longa extract powder
Rf values of plant extracts
The Rf values for Moringa oleifera extract are 0.31, 0.45, and 0.56, as determined by TLC analysis, whereas the Rf values for curcuma longa extract are 0.22, 0.32, and 0.43. The Thin Layer Chromatography (TLC) examination of diverse plant extracts was conducted at different detection wavelengths, demonstrating unique Rf values for each extract. Moringa oleifera (MEF1), detected at 366 nm, yielded 7 spots with Rf values of 0.07, 0.32, 0.47, 0.56, 0.66, 0.71, and 0.80. Finally, Curcuma longa (CEF3), identified at 366 nm, exhibited 8 spots with Rf values of 0.07, 0.26, 0.32, 0.43, 0.50, 0.62, 0.81, and 0.84. Each plant extract displayed distinct Rf patterns, underscoring the variability in their chemical contents.
High Performance Thin Layer Chromatography (HPTLC)
HPTLC fingerprints study
The HPTLC fingerprint analysis at 366 nm exhibited clearly defined and consistent chromatographic patterns for both samples. Moringa oleifera (MEF1) displayed seven unique bands with Rf values between 0.07 and 0.80, signifying the existence of several phytoconstituents, primarily flavonoid compounds. Curcuma longa (CEF3) exhibited nine distinct bands with Rf values ranging from 0.07 to 0.84, indicating a chemically diverse profile aligned with curcuminoids and associated compounds. The unique HPTLC fingerprints validate the complexity, identity, and consistency of both extracts, affirming their appropriateness for quality control and additional pharmacological research.
Figure 3: [a] HPTLC chromatogram of MEF1 extract measured at 366nm [b] HPTLC chromatogram of CEF3 extract measured at 366nm
Structural Elucidation of Compounds isolated by Column Chromatography
|
Compound-IV |
MEF1 |
|
Compound-V |
CEF3 |
Compound IV
|
A |
b |
|
C |
d |
Figure:4 [a] UV spectrum of Moringa extract [b] IR spectra of compound IV
[c] Proton NMR spectrum of Compound – IV [d] MASS spectrum of Compound IV
The chromatographic properties and the distinctive IR, 1H NMR, and mass spectrometric data of the isolated molecule aligned well with the documented spectral characteristics of flavonoids in the literature. The existence of essential functional groups and proton signals further corroborated this assignment. Therefore, the isolated molecule may be verified as a flavonoid analogue.
|
a |
b |
|
c |
d |
Figure:5 [a] UV graph of Curcumin extract [b] IR spectra of compound V [c] Proton NMR spectrum of Compound – V [d] MASS spectrum of Compound – V
The chromatographic behavior and the distinctive IR, 1H NMR, and mass spectroscopic characteristics of the isolated molecule exhibited significant concordance with the documented spectral data of curcumin in the literature. The identified functional groups, proton signals, and molecular ion peak corresponded with those of conventional curcumin. Consequently, the isolated chemical can be unequivocally identified as a Curcumin analogue.
Figure 2: [a] TLC chromatograph of Moringa oleifera extract [b] TLC chromatograph of Curcuma longa extract powder
Rf values of plant extracts
The Rf values for Moringa oleifera extract are 0.31, 0.45, and 0.56, as determined by TLC analysis, whereas the Rf values for curcuma longa extract are 0.22, 0.32, and 0.43. The Thin Layer Chromatography (TLC) examination of diverse plant extracts was conducted at different detection wavelengths, demonstrating unique Rf values for each extract. Moringa oleifera (MEF1), detected at 366 nm, yielded 7 spots with Rf values of 0.07, 0.32, 0.47, 0.56, 0.66, 0.71, and 0.80. Finally, Curcuma longa (CEF3), identified at 366 nm, exhibited 8 spots with Rf values of 0.07, 0.26, 0.32, 0.43, 0.50, 0.62, 0.81, and 0.84. Each plant extract displayed distinct Rf patterns, underscoring the variability in their chemical contents.
High Performance Thin Layer Chromatography (HPTLC)
HPTLC fingerprints study
The HPTLC fingerprint analysis at 366 nm exhibited clearly defined and consistent chromatographic patterns for both samples. Moringa oleifera (MEF1) displayed seven unique bands with Rf values between 0.07 and 0.80, signifying the existence of several phytoconstituents, primarily flavonoid compounds. Curcuma longa (CEF3) exhibited nine distinct bands with Rf values ranging from 0.07 to 0.84, indicating a chemically diverse profile aligned with curcuminoids and associated compounds. The unique HPTLC fingerprints validate the complexity, identity, and consistency of both extracts, affirming their appropriateness for quality control and additional pharmacological research.
|
a |
b |
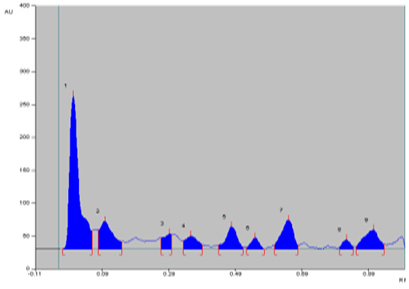
Figure 3: [a] HPTLC chromatogram of MEF1 extract measured at 366nm [b] HPTLC chromatogram of CEF3 extract measured at 366nm
Structural Elucidation of Compounds isolated by Column Chromatography
|
Compound-IV |
MEF1 |
|
Compound-V |
CEF3 |
Compound IV
|
A |
b |
|
C |
d |
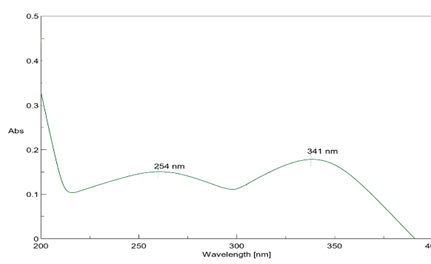
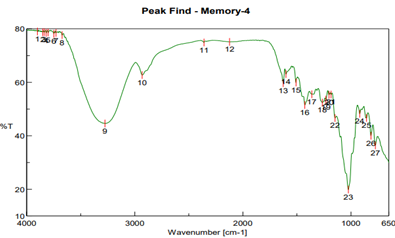
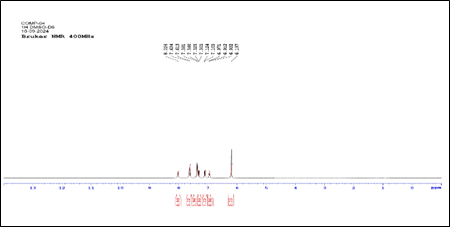
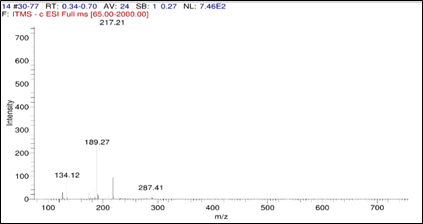
Figure:4 [a] UV spectrum of Moringa extract [b] IR spectra of compound IV
[c] Proton NMR spectrum of Compound – IV [d] MASS spectrum of Compound IV
The chromatographic properties and the distinctive IR, 1H NMR, and mass spectrometric data of the isolated molecule aligned well with the documented spectral characteristics of flavonoids in the literature. The existence of essential functional groups and proton signals further corroborated this assignment. Therefore, the isolated molecule may be verified as a flavonoid analogue.
|
a |
b |
|
c |
d |
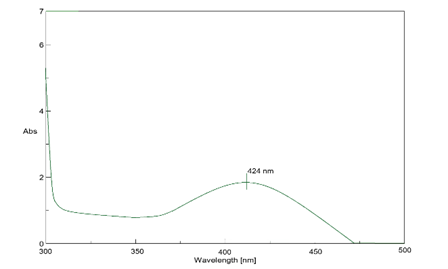
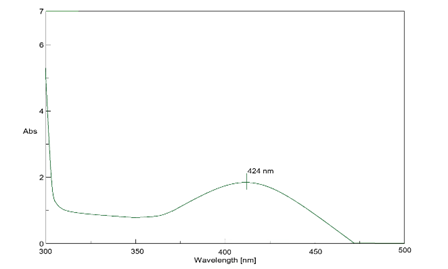
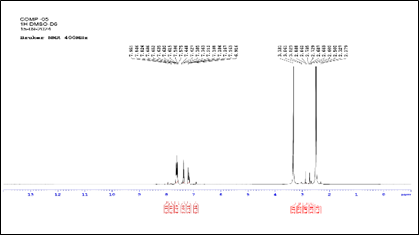
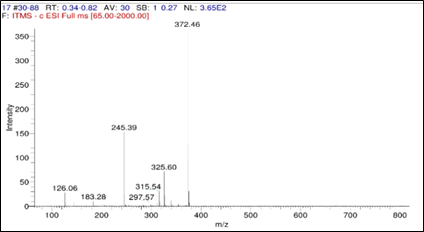
Figure:5 [a] UV graph of Curcumin extract [b] IR spectra of compound V [c] Proton NMR spectrum of Compound – V [d] MASS spectrum of Compound – V
The chromatographic behavior and the distinctive IR, 1H NMR, and mass spectroscopic characteristics of the isolated molecule exhibited significant concordance with the documented spectral data of curcumin in the literature. The identified functional groups, proton signals, and molecular ion peak corresponded with those of conventional curcumin. Consequently, the isolated chemical can be unequivocally identified as a Curcumin analogue.
CONCLUSION:
This study effectively standardized and described extracts of Moringa oleifera and Curcuma longa, validating their abundant phytochemical makeup, which includes flavonoids, tannins, phenolics, and terpenoids. TLC and HPTLC investigations exhibited the repeatability and diversity of phytoconstituents via unique Rf values and fingerprint patterns. Column chromatography facilitated the extraction of bioactive fractions, MEF1 from Moringa oleifera and CEF3 from Curcuma longa, which were further structurally characterized using UV–Vis, FTIR, ^1H NMR, and mass spectrometry. Spectroscopic results,
corroborated by literature, verified that these substances are counterparts of flavonoid and curcumin, respectively. The study offers an extensive phytochemical and spectral analysis of these plant extracts, establishing a solid foundation for their potential therapeutic use in controlling metabolic disorders and facilitating additional pharmacological and clinical research.
BIBLIOGRAPHY:
1. Gharsallah, K.; Rezig, L.; Rajoka, M.S.R.; Mehwish, H.M.; Ali, M.A.; Chew, S.C. Moringa oleifera: Processing, Phytochemical Composition, and Industrial Applications. S. Afr. J. Bot. 2023, 160, 180–193.
2. Kou, X.; Li, B.; Olayanju, J.; Drake, J.; Chen, N. Nutraceutical or Pharmacological Potential of Moringa oleifera Lam. Nutrients 2018,10, 343.
3. Anwar, F.; Latif, S.; Ashraf, M.; Gilani, A.H. Moringa oleifera: A Food Plant with Multiple Medicinal Uses. Phytother. Res. 2007,21, 17–25.
4. Leone, A.; Spada, A.; Battezzati, A.; Schiraldi, A.; Aristil, J.; Bertoli, S. Moringa oleifera Seeds and Oil: Characteristics and Uses for Human Health. Int. J. Mol. Sci. 2016, 17, 2141.
5. Xie, J.; Peng, L.; Yang, M.; Jiang, W.; Mao, J.; Shi, C.; Tian, Y.; Sheng, J. Alkaloid Extract of Moringa oleifera Lam. Exerts Antitumor Activity in Human Non-Small-Cell Lung Cancer via Modulation of the JAK2/STAT3 Signaling Pathway. Evid. Based Complement. Altern. Med. 2021, 2021, 5591687.
6. Das, N.; Sikder, K.; Ghosh, S.; Fromenty, B.; Dey, S. Moringa oleifera Lam. Leaf Extract Prevents Early Liver Injury and Restores Antioxidant Status in Mice Fed with High-Fat Diet. Indian J. Exp. Biol. 2012, 50, 404–412.
7. Vongsak, B.; Sithisarn, P.; Mangmool, S.; Thongpraditchote, S;Wongkrajang, Y.; Gritsanapan,W. Maximizing Total Phenolics, Total Flavonoids Contents and Antioxidant Activity of Moringa oleifera Leaf Extract by the Appropriate Extraction Method. Ind. Crops Prod. 2013, 44, 566–571.
8. Kusmiyati, K.; Rahmawati, E.; Waangsir, F.W.F.; Selasa, P. Alkaloids, Flavonoids, Tannins and Saponins Contents in Moringa oleifera Leaves. Indones. J. Glob. Health Res. 2022, 4, 139–144.
9. Dhongade, H.K.J.; Paikra, B.K.; Gidwani, B. Phytochemistry and Pharmacology of Moringa oleifera Lam. J. Pharmacopunct. 2017,20, 194–200.
10. Wang, F.; Bao, Y.; Shen, X.; Zengin, G.; Lyu, Y.; Xiao, J.; Weng, Z. Niazirin from Moringa oleifera Lam. Attenuates High Glucose-Induced Oxidative Stress through PKCζ/Nox4 Pathway. Phytomedicine 2021, 86, 153066.
11. K. Pal, S. Chowdhury, S. K. Dutta, et al., “Analysis of Rhizome Colour Content, Bioactive Compound Profiling and Ex-Situ Conservation of Turmeric Genotypes (Curcuma longa L.) From Sub-Himalayan Terai Region of India,” Industrial Crops and Products 150 (2020): 112401, https://doi.org/10.1016/ j. indcrop.2020.112401.
12. A.Rauf, M. Imran, I. E. Orhan, and S. Bawazeer, “Health Perspectives of a Bioactive Compound Curcumin: A Review,” Trends in Food Science and Technology 74 (2018): 33–45.
13. J. Sharifi-Rad, Y. E. Rayess, A. A. Rizk, et al., “Turmeric and Its Major Compound Curcumin on Health: Bioactive Effects and Safety Profiles for Food, Pharmaceutical, Biotechnological and Medicinal Applications,” Frontiers in Pharmacology 11 (2020): 1021, https://doi.org/10.3389/fphar.2020.01021.
14. S. Rathore, M. Mukim, P. Sharma, S. Devi, J. C. Nagar, and M. Khalid, “Curcumin: A Review for Health Benefits,” International Journal of Research and Review 7, no. 1 (2020): 273– 290.
15. Alhar MS, El-Sofany WI, AlRashidi AA, Hamden K. Protective Effects of Isolated Curcumin from Curcuma longa on Key Enzymes Involved in the Insulin Signaling Pathway and Digestive and Metabolic Enzymes Associated with Obesity, Type 2 Diabetes, and Hypertension. Journal of Diabetes Research. 2025;2025(1):8050374.
16. Sharifi-Rad, J.; Rodrigues, C.F.; Sharopov, F.; Docea, A.O.; Can Karaca, A.; Sharifi-Rad, M.; Calina, D. Diet, lifestyle and cardiovascular diseases: Linking pathophysiology to cardioprotective effects of natural bioactive compounds. Int. J. Environ. Res. Public Health 2020, 17, 2326.
17. Matter FO. Methods of Analysis. Retrieved from. 1984.
18. Kays AO. Determination of Moisture Content in Composites by Dielectric Measurements. 1979 Jul 1.
19. Harris GK, Marshall MR. Ash analysis. InFood analysis 2017 Jun 7 (pp. 287-297). Cham: Springer International Publishing.
20. Rohmah M, Saragih B, Amaliah N, Kristopal K, Putra YH, Rahmadi A. Determination of moisture, ash, protein, polyphenolic, flavonoids, and amino acid contents and antioxidant capacity of dried Mekai (Pycnarrhena tumefacta Miers) leaf as potential herbal flavor enhancers. InInternational Conference on Tropical Agrifood, Feed and Fuel (ICTAFF 2021) 2022 Jan 7 (pp. 149-158). Atlantis Press.
21. Querol X, UmaÑa JC, Alastuey A, Bertrana C, Lopez-Soler A, Plana F. Extraction of water-soluble impurities from fly ash. Energy Sources. 2000 Sep 1;22(8):733-49.
22. Sales J, Janssens GP. Acid-insoluble ash as a marker in digestibility studies: a review. Journal of Animal and Feed Sciences. 2003 Jul 15;12(3):383-401.
23. Sluiter A, Ruiz R, Scarlata C, Sluiter J, Templeton DJ. Determination of extractives in biomass. Laboratory analytical procedure (LAP). 2005 Jul 17;1617(4):1-6.
24. Chen SF, Mowery RA, Scarlata CJ, Chambliss CK. Compositional analysis of water-soluble materials in corn stover. Journal of agricultural and food chemistry. 2007 Jul 25;55(15):5912-8.
25. Joshi VK, Joshi A, Dhiman KS. The Ayurvedic Pharmacopoeia of India, development and perspectives. Journal of ethnopharmacology. 2017 Feb 2; 197:32-8.
26. Ramaley L, Vaughan MA, Jamieson WD. Characteristics of a thin-layer chromatogram scanner-mass spectrometer system. Analytical Chemistry. 1985 Jan 1;57(1):353-8.