Determinants of Child Mortality in Pakistan by using Multiple Regression Analysis with implementation of a New Risk Adjusted Modified EWMA Control Chart
- Sadia Sajjad , Assistant lecturer, University of Gujrat, Hafiz Hayat Campus, Gujrat Pakistan
- Afsheen Afzaal , lecturer, University of Gujrat, Hafiz Hayat Campus, Gujrat Pakistan
- Mehjabeen Zahid , Associate lecturer, University of Gujrat, Hafiz Hayat Campus, Gujrat Pakistan
- Saiqa Parveen , Assistant Director, Directorate of drugs control, Punjab
- Faeza Hasnain , Drugs controller Children’s Hospital and university of child health sciences, Lahore
- Humaira Tahir , Deputy Drugs controller Children’s Hospital and university of child health sciences, Lahore
- Shumaila Miraj , Deputy Director, Directorate of Drugs Control, Punjab
Article Information:
Abstract:
Background: In order to monitor the mean of process, this research introduces a novel Modified Exponentially weighted moving average control chart that is adjusted for risk. The residuals were used as the basis for the Risk Adjusted control chart using the MEWMA statistic. A multiple regression model was also created for Pakistan's under-five child mortality rates. In order to calculate residuals based on the discrepancy between observed and expected values, this model was further employed. Risk-adjusted EWMA control charts were also created for various values of λ in order to compare the performance of the suggested charts. The findings showed that the recommended chart outperforms the one that is already in use in the literature. It provides a real-world example of its execution that shows the remarkable outcomes and the usefulness of the suggested chart in the medical area.
Keywords:
Article :
INTRODUCTION:
Control charts have increased recognition throughout times in manufacturing, business and health sciences for being determinants of weather a process is stable or if it has variations that need corrective actions. How quickly a process change can be detected impacts the effectiveness of the control chart.
Through the control limits, the process communicates. The upper control limit (UCL) and a lower control limit (LCL) are computed and the average is established with sufficient data. The UCL is the highest value expected in a process with only common causes of variation. If there is only one common cause of variation, the LCL is the lowest number that may be expected. when every point is contained within the limits then there are only common causes of variation.
Because variability reduction and process optimization are becoming more and more important, the exponentially weighted moving average (EWMA) was created to help identify small changes in process parameters more quickly. For time series analysis, forecasting, smoothing, and control, the EWMA is a well-known technique. Because the EWMA chart is so widely used, it is preferable to address the autocorrelation issue by making a change to this conventional chart rather than developing a new one.
Shewhart and EWMA chart characteristics are combined in an understandable manner in the modified exponentially weighted moving average (MEWMA) control chart. It was based on the MEWMA control chart statistic, which fixed the EWMA chart statistic and eliminated the inertia issue [1].
A MEWMA chart is an enhanced version of standard EWMA chart, particularly designed to improve sensitivity in detecting smaller shifts in a process and also reduces false alarms at the same time [2]. Compared to other control charts, the suggested chart performs better on statistics on cancer patients' survival durations [3].
The MEWMA control statistic assigns weight to historical observations in a slightly different way than EWMA, and it assigns full weight to every current alteration. By altering the constant smoothing parameter and exponential smoothing parameter to detect changes in the process mean, this resolves the inertia problem. It functions well with autocorrelated, independently distributed, and normally distributed observations. In its generalized form, MEWMA can identify changes more quickly by taking into account both past and current activities in the process [4-5].
In order to assess and improve medical treatments and outcomes, there has been an increasing need in recent years for monitoring diverse time series. Because medical patients are diverse, monitoring medical results is different from monitoring similar goods in an industrial process. Risk-adjusted control charts identify abnormal plan quality after accounting for risk factors unique to each patient and therapy. The risk adjusted control chart, in contrast to the conventional control chart, can withstand interpatient variation in the risk factors that are being studied. In the healthcare industry, the most practical chart to use is the risk-adjusted EWMA [6-7].
The health status of a country is a popular topic at the moment. In the developed world, most people are successful in postponing death. But even though the globe's death rate has significantly decreased over the last four to five decades, the developing world still has very high neonatal and child mortality rates. The death rates for children under five in India are influenced by the rates of measles, hepatitis vaccination, and tuberculosis case detection [8]. In Pakistan, fever, diarrhea, and pneumonia were frequently associated with child mortality [9].
A new UNICEF report states that the global under-five child mortality rate decreased from 93% in 1990 to 39% in 2018. The majority of the world's under-five child mortality rate is concentrated in two regions. Compared to 29% in central and south Asia, 52% of children under five died in Africa. In 2018, the two regions of Central and South Asia and Sub-Saharan Africa accounted for almost 80% of mortality among children under five.
50% of all child deaths worldwide occurred in the five countries of Ethiopia, Nigeria, Congo, India, and Pakistan in 2018. And the following is how half of all kid fatalities are distributed globally: According to UNICEF (2013), India has a twenty two percent share, Nigeria has a thirteen percent share, Pakistan has a six percent share, Congo has a six percent share, and China has a four percent share.
A more thorough analysis of child mortality is required because Pakistan is among the countries with the lowest health scores. According to the UN Development Program 2013 Human Development Index, Pakistan is placed 146th out of 187 nations, with particularly dismal health outcomes for children. It is shameful that a large number of young children died from illnesses and injuries that were preventable and treatable.
Even with advancements, far too many Pakistani children continue to suffer from acute respiratory infections, lack of vaccinations, insufficient maternal, infant, and neonatal health care, and starvation [10].
About 70% of all child deaths in Pakistan are brought on by infectious diseases as only 58% of children who are at risk of getting them get immunized. For many years, vaccination hesitancy has been a significant barrier to overcome in Pakistan. Since 1978, Pakistan has worked to protect children from a range of childhood diseases and infections, including poliomyelitis, TB, diphtheria, tetanus, and measles. Despite these initiatives, myths, popular belief, and violence against vaccine providers have resulted in embarrassingly low immunization rates in Pakistan.
Pakistan still has a poor national immunization coverage rate; however, it increased from forty seven percent in 2006 to fifty four percent in 2012, with only 54% of children having received all the necessary vaccinations. WHO estimates that 1.2 million children in Pakistan were 'unvaccinated' in 2014. In Balochistan and Sindh, the situation has gotten worse. The vaccination rates in Punjab and KP have continued to rise. The immunization rate is 66% in urban regions and only 48% in rural areas. Forecasting Pakistan's child mortality rates under the age of five and determining the socioeconomic factors and reasons that affect these rates are vital given this reality [11].
Research design and Methodology:
A bivariate (X,Y) normal distribution was employed in this work, with the parameters µ_x, µ_y, 〖σ 〗_x, σ_y and ρ_(x,y) representing the distribution's means, variances and covariances respectively. Yi displays the relevant variables while Xi displays the auxiliary variable. There was a correlation between these variables.
EWMA Control Chart's Control Limits
The basis of the EWMA control chart is the following statistic:
Xn = (1- ρ) Xn-1+Yn; Where ρ is a constant usually between 0 and 1. The nth observation is Yn, and the nth statistic is Xn. This approach indicates a signal when the value Xn exceeds the set control limit. The following formulas were used to determine the EWMA control limits:
𝑈𝐶𝐿 = 𝜇o + 𝐿𝜎𝑒 √(ρ/(2-ρ))
𝐶𝐿 = 𝜇o
𝐿𝐶𝐿 = 𝜇o − 𝐿𝜎𝑒√(ρ/(2-ρ))
The controlling constant on the chart is denoted by 𝐿. A specific shift size is required for EWMA control charts to function. If it is necessary to identify a small shift size, a small value of ρ must be utilized. Similarly, it is necessary to utilize a big value of ρ to detect a substantial shift. Consequently, it was not feasible for a single EWMA chart to simultaneously attain the least ARL. The inertia issue was the additional problem. This method requires a lot more observations to overcome its early inertia, at worst. The MEWMA plan was proposed as a solution to these problems.
MEWMA Control Chart's Control Limits
Like EWMA, the MEWMA chart examines historical data and accounts for both recent and historical process modifications. A MEWMA control chart was constructed using the following statistic:
Xn = (1- ρ) Xn-1 + ρ Yn + (Yn - Yn-1); Here, the initial values are X0 = µ0 = Y0, where n = 0, 1, 2…. 0< ρ ≤ 1. The control limits for the MEWMA chart were as follows:
𝑈𝐶𝐿 = 𝜇o + 𝐿𝜎 √(ρ/(2-ρ)+(2ρ(1-ρ))/(2-ρ))
𝐶𝐿 = 𝜇o
𝐿𝐶𝐿 = 𝜇o − 𝐿𝜎√(ρ/(2-ρ)+(2ρ(1-ρ))/(2-ρ))
Here, L stands for the MEWMA scheme constant, which displays exponential weight, 𝜇o presents the target mean, the process variance is shown by 𝜎2.There is an inertia problem with the EWMA chart because of an error in the EWMA statistic. A rectified version of an EWMA statistic is called a MEWMA. MEWMA was now regarded as the best predictor of process mean. The auto-correlated process has an MSE of zero. For slight shifts, it works similarly to the EWMA system, and it can also identify sudden changes like Shewhart.
Risk Adjusted Control Chart
When the data is heterogeneous, it is necessary to take into account the explainable variation present in the samples. In these situations, risk-adjusted control charts are the best option. The sampled data must be subjected to a regression model that takes the explainable variation into account. Therefore, it is possible that the regression model has overlooked any assignable variation that existed in the process a risk-adjusted chart, on the other hand, shows that the process is out of control.
Instead of utilizing the observed data, the control chart needs to be made using the residuals from the regression model. Regression models lower the frequency of false signals compared to basic control charts because they allow for the consideration of explainable variance in the data arising from patient changes.
The proposed Risk Adjusted MEWMA control chart
A new RA MEWMA control chart is suggested in this work. The MEWMA statistic served as the basis for this chart. The regression model's residuals are computed and then used to determine the MEWMA statistic. For various values of 𝜆, the upper, lower, and center control limits were also computed.
Ordinary Least Squares
Using Ordinary Least Squares method, the multiple regression model was developed to assess the relation between a response variable and multiple predictor variables.
The multiple linear regression model was explained as follows:
y ̂ = β_0 +β_1x_11 + β_2 x_2+ ⋯ + β_n x_n+ ε
In this case y ̂ is the dependent and x_1,x_2,….x_n are predictor variables. The βn, n= 0, 1, 2, …., n are coefficients of regression model, which displays the change in Y as a function of the one-unit change in each independent variable.
The correlation coefficient is the measurement of the linear relationship between variables and an estimate of their interdependency. The Pearson correlation coefficient was calculated. Testing of the correlation's significance was done as
ρ_(x.y)= 0 (No significant linear correlation can be found between the two variables)
ρ_(x.y)≠ 0 (significant linear correlation can be found between the two variables)
In multiple regression analysis, multicollinearity occurs when two or more explanatory variables have a strong linear relationship. Multicollinearity in the variables may lead to inaccurate regression coefficient predictions. Regression results are adversely affected by multicollinearity. Using the variance influence factor (VIF), multicollinearity was investigated. VIF was calculated with tolerance as: 𝑉𝐼𝐹 = (1 )/(1-R_j 2). Each variable's contribution to the regression's standard error is determined by the VIF. Multicollinearity is evident when the VIF score is 10 or greater.
Real life Application
The rates of under-five child death from 2000 to 2020 were calculated using a healthcare dataset in order to apply the suggested chart to the real dataset and create a regression model. The WHO (2020) annual report and our world in data, Pakistan (2021), were the sources of this information. The model was used to determine the data sets' standard errors and apply the MEWMA control scheme monitoring together with risk adjustment to produce a useful chart. Additionally, efficiency was assessed using another current competitor chart.
This chapter discusses the use of multiple regression analysis to develop a model for the factors influencing child mortality in Pakistan. The error for the developed models is also calculated and used to create a new RA MEWMA chart for the various values of ρ. Additionally, RA EWMA charts are created for making comparison with the MEWMA scheme. The analysis uses ρ=0.1,0.2,0.3,0.5 and 0.8 to see the impact of smoothing constant.
Results Discussion and Conclusion:
Development of Child Mortality regression model
The ordinary least squares (OLS) approach is employed to estimate the parameters and provide the best description of the data set. A study in India [8] served as the basis for the factors chosen to develop a comparable model of child mortality in Pakistan. The mortality rate for children under five is the predictand variable, and the explanatory variables are: 𝑥1, 𝑥2…, 𝑥6 i.e. emanations of carbon dioxide, number of fatalities from measles, coverage of hepatitis vaccinations, rate of TB detected, number of HIV deaths, deaths from respiratory infections respectively.
To find the best fit model, variables are chosen using backward elimination. The criterion for α = 0.05, indicates that not all factors have an impact on Pakistan's under-five child mortality rate. The model did not include the explanatory factor with the highest p value. The procedure is repeated until the variable's p value drops below the α threshold.
The 3 variables, hepatitis B coverage, rate of TB and fatalities from respiratory infections are judged to be significant because all of the p values are < 0.05. VIF is also examined during this process; variables with VIF > 10 may indicate multicollinearity problems in the model. The selecting method does not take these factors into account. After eliminating X1, X2, X5 the following is the estimated regression model for Pakistan's under-five child mortality rate:
= 58.92 – 0.21 X3 – 0.13 X4 + 0.16 X6
The results of the model created by [8] are being verified by the developed model. Measles inoculation coverage, hepatitis B inoculation coverage, and the likelihood of TB detection were amongst the factors affecting the child death rate, as that predicted model found.
Table 3.1 Coefficients of regression model
|
Model |
Coefficients |
T |
Sig. |
Collinearity Statistics |
|||
|
B |
Std. Error |
Tolerance |
VIF |
||||
|
|
Constant term |
58.92 |
10.489 |
5.617 |
.000 |
|
|
|
Hepatitis B immunization coverage |
-.21 |
.050 |
-4.024 |
.001 |
.488 |
2.050 |
|
|
TB case detection |
-.13 |
.048 |
-2.695 |
.015 |
.126 |
7.932 |
|
|
Death rate Lower respiratory infections |
.16 |
.030 |
5.215 |
.000 |
.096 |
9.44 |
|
Table 3.2 Model Summary
|
Model |
R |
R Square |
Adjusted R Square |
Std. Error of the Estimate |
Durbin-Watson |
|
1 |
.989 |
.978 |
.974 |
1.461326 |
1.870 |
The constructed model's summary is shown in Table 3.2. A regression model is deemed credible if its R-square is more than 0.95. The aforementioned table makes it evident that the proposed model is a trustworthy tool for estimation.
A Durbin-Watson statistic score of 2 or almost 2 indicates that there is no first-order autocorrelation. The range of 1.50 to 2.50 is appropriate. The preceding table indicates that there is no first order autocorrelation when successive error differences are minor, indicating that the created regression model's results are reliable.
Calculation of Residuals
Expected values of child mortality are computed using the proposed model for child mortality. Residual i.e. εx,i=Dx,i− x,i is the deviation of the predicted x,i ,which takes into account the risk factors and the actual Dx,i, which ignores the risk factors. So, the residual εx,i indicates an adjusted Dx,i . The quality is then evaluated and monitored using the residuals inside a control chart framework. The plotting statistic in RA control charts is residuals. The calculation of residuals involves deducting the observed child mortality values from the expected values. For the purpose of creating RA EWMA and RA MEWMA charts, the risk is further modified.
RA EWMA Statistic
The statistic Xn = (1- ρ) Xn-1+Yn constitutes the EWMA control chart's base. The frequency of using older data in the EWMA statistic calculation is controlled by the parameter ρ. The EWMA is only impacted by the most recent measurement when the value is 1, which degrades to a Shewart chart. Older data is assigned additional weight when ρ is small, whereas new data is given additional weight when ρ is large. Its value is frequently set to fall between 0.2 and 0.3. For drawing a precise comparison are used.
Based on the child mortality model, the risk is computed and utilized in the EWMA statistic to determine the nth statistic of Xn, as well as for the computation of UCL and LCL. The controlling constant, 𝐿, has been set to 3. Like every control system, the EWMA procedure depends on measurements that precisely reflect the procedure. After calculating the data's mean value and standard deviation, if the process is under control, it can proceed and if not, the standard Phase work would have to be done firstly.
The proposed RA MEWMA Statistic
The statistic Xn = (1- ρ) Xn-1 + ρ Yn + (Yn - Yn-1) is the basis of the MEWMA control chart. The parameter ρ controls the rate at which the MEWMA statistic is computed using earlier data. A value of 1 means that the most recent measurement is the only factor affecting MEWMA. Older data is given more weight when ρ is small, whereas new data is given more weight when ρ is large. For making evaluation are used. Based on the child mortality model, the risk is computed and utilized in the MEWMA statistic to determine the nth statistic of Xn, as well as for the computation of UCL and LCL. The controlling constant, 𝐿, is set to 3 in both the UCL and LCL.
Table 3.3 RA EWMA and RA MEWMA values for the nth statistic of Xn for various ρ.
|
ρ = 0.1 |
ρ = 0.2 |
ρ = 0.3 |
ρ = 0.5 |
ρ =0.8 |
|||||
|
RA EWMA |
RA MEWMA |
RA EWMA |
RA MEWMA |
RA EWMA |
RA MEWMA |
RA EWMA |
RA MEWMA |
RA EWMA |
RA MEWMA |
|
0.9902 |
0.3418 |
0.9253 |
0.2769 |
0.8605 |
0.2121 |
0.7308 |
0.0824 |
0.5363 |
-0.112 |
|
0.949 |
0.5376 |
0.856 |
0.5094 |
0.7759 |
0.4942 |
0.6548 |
0.5027 |
0.5702 |
0.6126 |
|
0.8975 |
0.3825 |
0.7716 |
0.3496 |
0.6734 |
0.3314 |
0.5444 |
0.3236 |
0.4612 |
0.325 |
|
0.8552 |
0.4316 |
0.7121 |
0.4145 |
0.6136 |
0.4142 |
0.5092 |
0.4388 |
0.4714 |
0.4842 |
|
0.7824 |
0.0553 |
0.5953 |
0.0112 |
0.4679 |
-0.017 |
0.3186 |
-0.063 |
0.1967 |
-0.147 |
|
0.9652 |
2.7928 |
0.9982 |
3.0129 |
1.1105 |
3.2526 |
1.4643 |
3.7557 |
2.1273 |
4.5406 |
|
1.0861 |
2.2949 |
1.2334 |
2.4092 |
1.4296 |
2.493 |
1.8191 |
2.5289 |
2.1647 |
2.2113 |
|
1.2613 |
3.0132 |
1.5543 |
3.1589 |
1.8521 |
3.2605 |
2.3286 |
3.3474 |
2.7033 |
3.3767 |
|
1.1847 |
0.4195 |
1.3426 |
0.2843 |
1.4453 |
0.0892 |
1.4123 |
-0.42 |
0.9375 |
-1.27 |
|
1.1462 |
0.7604 |
1.2339 |
0.6903 |
1.2514 |
0.6051 |
1.1056 |
0.4924 |
0.8267 |
0.6882 |
|
1.181 |
1.5288 |
1.2859 |
1.546 |
1.3242 |
1.5668 |
1.2998 |
1.6882 |
1.3605 |
2.0278 |
|
1.0753 |
0.0183 |
1.0535 |
-0.108 |
0.9641 |
-0.236 |
0.7119 |
-0.464 |
0.3713 |
-0.865 |
|
1.0479 |
0.7747 |
1.0032 |
0.7517 |
0.9155 |
0.7534 |
0.757 |
0.847 |
0.7159 |
1.1466 |
|
1.0681 |
1.2702 |
1.0526 |
1.2994 |
1.0158 |
1.3504 |
1.0035 |
1.4965 |
1.1432 |
1.6773 |
|
1.0579 |
0.9558 |
1.0353 |
0.9487 |
1.0009 |
0.951 |
0.9847 |
0.9473 |
1.0014 |
0.8243 |
|
1.0506 |
0.9777 |
1.0252 |
0.9749 |
0.9961 |
0.9802 |
0.9849 |
0.9851 |
0.9883 |
0.9719 |
|
1.0074 |
0.5747 |
0.9438 |
0.5366 |
0.8827 |
0.5046 |
0.8014 |
0.4346 |
0.6921 |
0.3218 |
|
0.9176 |
0.0203 |
0.777 |
-0.057 |
0.6509 |
-0.122 |
0.4557 |
-0.236 |
0.2264 |
-0.356 |
|
0.9913 |
1.7276 |
0.9524 |
1.8294 |
0.9518 |
1.9549 |
1.0549 |
2.2531 |
1.3685 |
2.7961 |
|
1.0395 |
1.5223 |
1.0567 |
1.5783 |
1.1085 |
1.6307 |
1.2644 |
1.6836 |
1.4529 |
1.5584 |
|
1.1096 |
1.81 |
1.1934 |
1.8767 |
1.2979 |
1.9295 |
1.5022 |
1.9778 |
1.6826 |
1.9697 |
Table 3.4 UCL and LCL for various values of ρ
|
Control Limits |
UCL |
CL |
LCL |
|
|
ρ = 0.1 |
RA EWMA |
1.603 |
1.055 |
0.506 |
|
RA MEWMA |
1.973 |
1.055 |
0.136 |
|
|
ρ = 0.2 |
RA EWMA |
1.852 |
1.055 |
0.257 |
|
RA MEWMA |
2.340 |
1.055 |
-0.203 |
|
|
ρ = 0.3 |
RA EWMA |
2.059 |
1.055 |
0.050 |
|
RA MEWMA |
2.611 |
1.055 |
-0.501 |
|
|
ρ = 0.5 |
RA EWMA |
2.436 |
1.055 |
-0.326 |
|
RA MEWMA |
3.008 |
1.055 |
-0.898 |
|
|
ρ = 0.8 |
RA EWMA |
3.008 |
1.055 |
-0.898 |
|
RA MEWMA |
3.366 |
1.055 |
-1.250 |
|
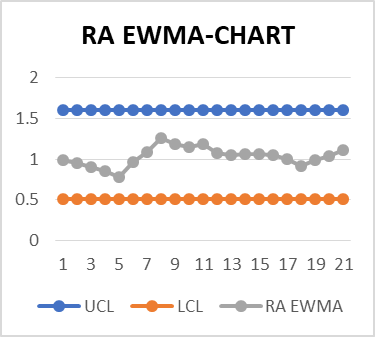
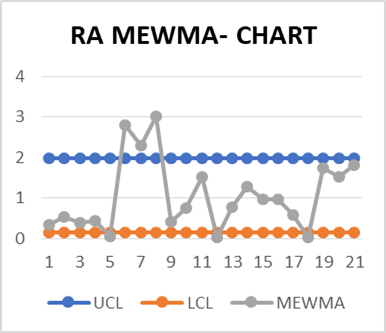
Fig 3.1 For ρ = 0.1, the RA EWMA and RA MEWMA charts
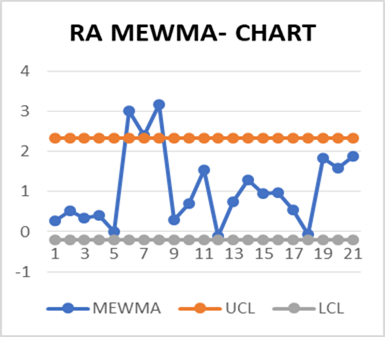
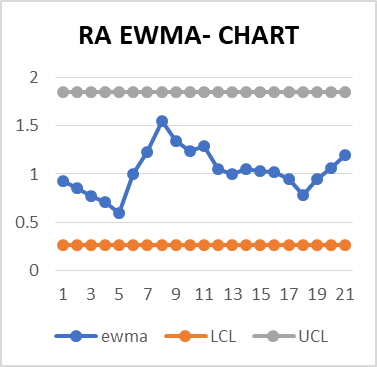
Fig 3.2 For ρ =0.2, the RA EWMA and RA MEWMA charts
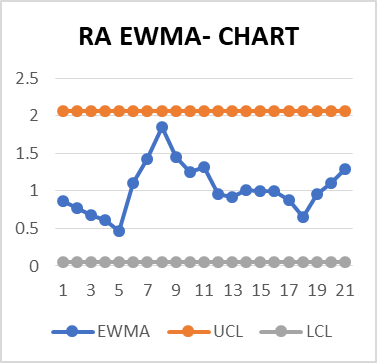
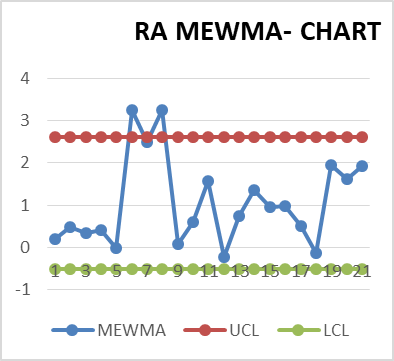
Fig 3.3 For ρ = 0.3, the RA EWMA and RA MEWMA charts
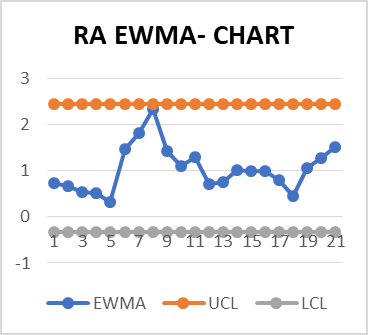
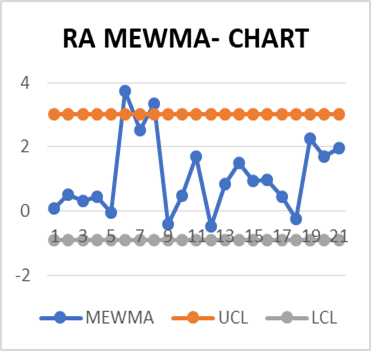
Fig 3.4 For ρ =0.5, the RA EWMA and RA MEWMA charts
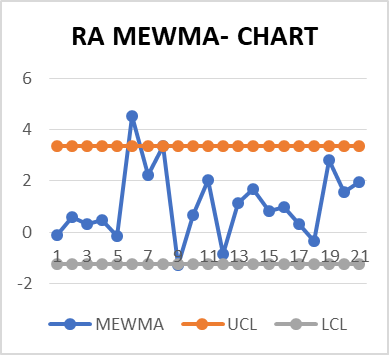
Fig 3.5 For ρ =0.8, the RA EWMA and RA MEWMA charts
Table 3.3 displays the twenty-one sample values of nth statistic of Xn for ρ = 0.10.2,0.3,0.5 and 0.8 in order to assess the performance of the proposed RA MEWMA control chart and to compare it with the current RA EWMA control chart. whereas the UCL, central, and LCL for each chart are displayed in Table 3.4. Table 3.3 makes it evident that RA MEWMA has more wider limits than RA EWMA.
Figure 3.1 displays the Risk Adjusted EWMA and Risk Adjusted MEWMA Charts when ρ = 0.1 to allow for easy comparisons between the performance of the suggested and current charts. Every plotted point on the RA EWMA incorporates information from every previous subgroup or observation based on the predetermined weight. The center line displays the process average. The control limits are positioned three standard deviations above and below the center line and represent the range of variance that can be expected in the observations.
If a point deviates from the center line by more than three standard deviations, it is deemed out of control. Out-of-control points may affect the estimation of process parameters, resulting in control limits that are not representative of the process.
There are no points that are out of control on the risk-adjusted EWMA control chart. But a pattern is evident when more than six points appear consecutively and the process level changes beginning at the fifth point. However, the suggested RA MEWMA displays the 5th, 12th, and 18th points below LCL and the 6th, 7th, and 8th points above UCL.
In terms of identifying out-of-control points, it is therefore far superior to the current chart. It is more adept at identifying both shifting and natural variations in the process mean.
When ρ equals 0.2, the Risk Adjusted EWMA and Risk Adjusted MEWMA charts are displayed in Fig. 3.2. There are no uncontrollable points on the risk-adjusted EWMA control chart. However, beginning at point five, the process level shifts. On the other hand, the suggested RA MEWMA displays the sixth, seventh, and eighth points above UCL. As a result, it can identify both shifting and natural variations in the process mean more effectively.
When ρ =0.3, the RA EWMA and RA MEWMA Charts are displayed in Fig. 3.3. There are no uncontrollable points on the RA EWMA control chart. However, beginning at point five, the process level shifts. However, the sixth and eighth points above UCL are displayed by the proposed RA MEWMA, while the remaining points are under control. In terms of identifying out-of-control points, it is therefore far superior to the current chart. It is more adept at identifying both shifting and natural variations in the process mean.
When ρ =0.5, the RA EWMA and RA MEWMA charts are displayed in Fig. 3.4. No points are out of control on the RA EWMA control chart. Even though the process level shifts beginning at points five and eight are nearly on the UCL, they are still under control. Although all other points are within control, the suggested RA MEWMA displays the sixth and eighth points over UCL. Therefore, in terms of identifying out-of-control points, it is far superior to the current chart. It is more capable of identifying both shifting and natural fluctuations in the process mean.
Figure 3.5 displays the Risk Adjusted EWMA and Risk Adjusted MEWMA Charts with ρ = 0.8 to allow for easy comparisons between the performance of the suggested and current charts. There are no uncontrollable points on the risk-adjusted EWMA control chart. However, beginning at point five, the process level changes. Nevertheless, the other points are within control, and the sixth point is above UCL in the suggested RA MEWMA. In terms of identifying out-of-control points, it is therefore far superior to the current chart. It is more adept at identifying both shifting and natural fluctuations in the process mean.
Significance of the study
Finding, measuring, and prioritizing the relative significance of factors that positively or negatively impact Pakistan's child mortality rates will be made easier with the help of the current study's findings. This study adds to the body of literature by analyzing the child mortality rate in Pakistan. This work could potentially be the basis for some important policy outcomes.
This study not only proposed a new RA MEWMA control chart, but also used it on a medical dataset to understand the constant variations in all activities. Medical researchers and policymakers can use RA MEWMA control charts as problem indicators to determine whether remedial action is necessary. The patterns may help uncover potential solutions by pointing to possible causes. With this control chart, future performance in a variety of domains can be predicted. Thus, control charts should not be limited to specific fields because they provide an objective and visible way to monitor and assess a process's performance over time.
Future Recommendations
The suggested control charts may prove to be an important tool for decision-making in a variety of medical professions. Important techniques like risk-adjusted control charts should be included in the education of healthcare workers. The monitoring and assessment of health processes are enhanced when RA techniques are incorporated into control charts. In a number of disciplines, the RA MEWMA charts can achieve greater sensitivity and specificity when compared to standard control charts.
CONCLUSION:
A new Risk Adjusted Modified EWMA chart is suggested in this study. Using the OLS approach, a multiple regression model on the factors influencing child mortality in Pakistan is created. The model's residuals are computed and used to determine the MEWMA statistic. It is also applied to the EWMA statistic in order to compare the suggested chart with the current Risk Adjusted EWMA.
For both EWMA and MEWMA, Risk Adjusted Control Charts are created. It is shown that the proposed chart can both detect larger shifts in the process mean and detect smaller shifts more accurately than the current charts. According to the findings, the suggested chart is more effective than its alternatives.
Enhancing approved pharmaceutical and medical devices is crucial to ensuring continued adherence to established standards and regulations. Control charts can be used to track ongoing process activity in order to achieve this.
References :
1. Patel, A. K., & Divecha, J. (2011). Modified exponentially weighted moving average (EWMA) control chart for an analytical process data. Journal of Chemical Engineering and Materials Science, 2(1), 12-20.
2. Peerajit, W., & Areepong, Y. (2023). Alternative to Detecting Changes in the Mean of an Autoregressive Fractionally Integrated Process with Exponential White Noise Running on the Modified EWMA Control Chart. Processes, 11(2), 503.
3. Talordphop, K., Sukparungsee, S., & Areepong, Y. (2022). New modified exponentially weighted moving average-moving average control chart for process monitoring. Connection Science, 34(1), 1981-1998.
4. Khan, N., Aslam, M., & Jun, C. H. (2017). Design of a control chart using a modified EWMA statistic. Quality and Reliability Engineering International, 33(5), 1095-1104.
5. Supharakonsakun, Y., & Areepong, Y. (2022). Design and Application of a Modified EWMA Control Chart for Monitoring Process Mean. Applied Science and Engineering Progress, 15(4), 5198-5198.
6. Roy, A., Cutright, D., Gopalakrishnan, M., Yeh, A. B., & Mittal, B. B. (2020). A risk-adjusted control chart to evaluate intensity modulated radiation therapy plan quality. Advances in Radiation Oncology, 5(5), 1032-1041.
7. Cook, D. A., Coory, M., & Webster, R. A. (2011). Exponentially weighted moving average charts to compare observed and expected values for monitoring risk-adjusted hospital indicators. British Medical Journal Quality & Safety, 20(6), 469-474.
8. Sonawane, M. A., & Tayade, A. Y. (2021). Predictive Model on Determinants of Child Mortality Using Multiple Regression Analysis. Journal of Physics: Conference Series,1850 (1), 1-
9. Afshan, K., Narjis, G., Qureshi, I. Z., & Cappello, M. (2020). Social determinants and causes of child mortality in Pakistan: Analysis of national demographic health surveys from 1990 to 2013. Journal of paediatrics and child health, 56(3), 457-472.
10. Mir, F., Ariff, S., Bhura, M., Chanar, S., Nathwani, A. A., Jawwad, M., & Bhutta, Z. A. (2022). Risk factors for acute respiratory infections in children between 0 and 23 months of age in a peri-urban district in Pakistan: A matched case–control study. Frontiers in pediatrics, 9(1) 704545.
11. Khan, R. E. A., Bari, K. M., & Raza, M. A. (2019). Socioeconomic determinants of child mortality: Evidence from Pakistan Demographic and Health Survey. Business Review, 13(2), 34-50.