AQbD-Guided Development and Validation of RP-HPLC Method for Quantitative Estimation of Tamsulosin
- Rajeshwari V. Tambe , Sandip University, School of Pharmaceutical Sciences, Sandip University, Nashik, (MH)-443201, India.
- Prashik B. Dudhe , Sandip University, School of Pharmaceutical Sciences, Sandip University, Nashik, (MH)-443201, India.
- Hrushikesh M. Suryawanshi , Sandip University, School of Pharmaceutical Sciences, Sandip University, Nashik, (MH)-443201, India.
- Akansha V. Sonawane , Sandip University, School of Pharmaceutical Sciences, Sandip University, Nashik, (MH)-443201, India
- Deep K. Puranik , Sandip University, School of Pharmaceutical Sciences, Sandip University, Nashik, (MH)-443201, India
- Abhijeet D. Kulkarni , Sandip University, School of Pharmaceutical Sciences, Sandip University, Nashik, (MH)-443201, India
Article Information:
Abstract:
A second, straightforward, apt, exact and robust reversed-phase high-performance liquid chromatographic (RP-HPLC) method was developed and confirmed to determine tamsulosin in its bulk and tablet forms of preparative dosage type in quality by design. The optimization of chromatographic condition was obtained by Central Composite Design. The separation was performed with the help of an HPLC system and Chromeleon 7.3 software and Agilent Zorbax C18 column (250 mm x 4.6mm; 5m) and separation was carried out. The detection was done at 239 nm. The RP-HPLC method developed was seen to be valid in terms of linearity, accuracy, precision, specificity, robustness with the results of the analysis were found. The developed technique was identified to be linear with correlation coefficient (r2) of one. The magnitude of precision of the method was discovered to be under 2.0%. It was found that the percent recoveries of Tamsulosin were 99.98. The relevance and effectiveness of the proposed method were good. The solution suggested was very forecasting and robust.
Keywords:
Article :
INTRODUCTION:
Tamsulosin is a selective alpha-1 adrenergic receptor antagonist selective in acting on the alpha-1 receptor of the adrenergic receptors and is mainly used in the treatment of lower urinary tract symptoms (LUTS) in benign prostate hyperplasia (BPH). [1,2].
tamsulosin inhibits 1A and 1D receptors of adrenergic receptor that are mainly found in prostate, bladder neck, prostatic urethra and smooth lower urinary tract muscle. The inhibition of these receptors causes the relaxation of the smooth muscles and this increases the urinary flow and the lower urinary tract symptoms such as urgency to urinate, hesitancy in urinary stream, nocturia and the feeling of not emptying the bladder as individuals with benign prostate hyperplasia (BPH) usually experience. Tamsulosin, with its uroselectivity pharmacological profile is not a vascular 1 B receptor blocker similar to the former non-selective blockers of the alpha-adrenergic receptors, which also leads to decreased incidences of orthostatic hypotension. [5].
The central composite design (CCD) is a good optimization tool of variable importance. CCD suggests the optimistic worth of variables that would give the favoured and the most preferable response and the circumstances of the process that can hardly be altered at will in the environments of the factors. It also implies mathematical model of response to the critical variables and thus can predict response with minimal error to the response[6-10].
It came as a revelation since the analysis of literature discovered that determination has been performed on drug using HPLC. [11-19].
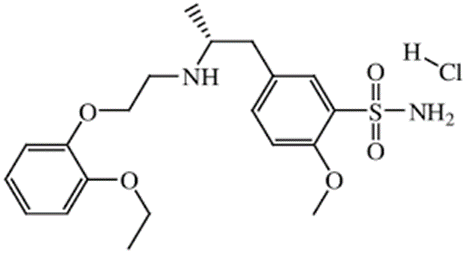
Fig 1 : Chemical structure of Tamsulosin
MATERIALS AND METHODS:
Materials:
The samples of tamsulosin were taken in Arni Analytical Laboratory. Nashik. The Acetonitrile, Methanol and HPLC solvents as well as HPLC system were purchased through Thermo Ultimate 3000.
Instrumentation :
The method was developed and validated with the HPLC Thermo Ultimate 3000 and Chromeleon 7.3 software and an Agilent Zorbax C18 column (150 mm ×4.6 mm, 5 2m). Design -The CCD model was designed using Design-Expert, version 11.0.
Preparation of Mobile Phase:
Preparation of Buffer:
Weak 0.01M KOH 2 phosphate in water.
Preparation of Mobile Phase:
Set up buffer and Acetonitrile in the proportion (60:40) v/v.
Preparation of standard solutions:
Mass 24mg Tamsulosin, 100 ml volumetric flask. In the meantime, add 60 ml of mobile and sonicate 5 minutes. Make up the volume. Continue to dilute 5 ml above solution to 50 ml with Mobile phase further.
Preparation of sample solutions:
Sample solutions Preparation: To prepare sample solutions; add 2.6 g of sodium hydroxide to 100.0 ml of distilled water and swirl gently and carefully and set aside. Weight 10 pills and take average weight. Grind the pills to fine powder. To weigh accurately the weight of powder that is equal to average weight (tablet weight) in 100 ml volumetric flask. Add mobile phase 60ml and sonicate 10 mins and fill up. Filter the above solution, filter paper Whatman filter paper no 41. To mobile phase add above filtrate to 50 ml.
Experimental Design Scouting step :
This was achieved through a certain degree of experimentation to determine the mobile phase with which an acceptable separation is achieved. During the first stage of method development, it was noted that a mixture of both buffer and acetonitrile was producing good peak, therefore mixture of buffer and acetonitrile in a ratio 60:40 of the percent volume was chosen as a mobile phase. Lastly, the 2-factor chosen percent acetonitrile , flow rate that have the potential of being a clear influence of the chosen responses were chosen.
Optimization design :
The reason why the central composite design (CCD) was extensively employed was that it is highly efficient and it can help minimize the runs. A CCD having k factor would involve k factorial runs, and 2K axis experiments that are separated at = + 2 symmetrically about both of the variable axes, and include at least one center point. The 3 large factors had been built as rotatable CCD ( = 1.68) to suit the optimum level of desired responses with 5 levels of each of the factors ( -1 0 + 1 + - ), and the total number of the 13 random runs that are covering 5 center points. The HPLC analysis methodology is expected to be of high rate of the analysis and the good resolution between the peaks. Optimization of the factors is accomplished once the chromatography or the independent factors affecting these responses of the HPLC system have been known through which the central composite design method is employed. CCD also incorporates or includes the points and factorial of two that is added so that it can be rotatable or orthogonal and hence approximation of the second order equation was expressed as presented by Box and Wilson. This way enables the determination of the coefficient of quadratic regression model that will lead to the prediction of nonlinear influence of variables. Design Expert(Version 11) was used in designing the CCD model (Stat-Ease Inc., Minneapolis, MN USA).[4-8].
There were thirteen independent variables and the response values in the CCD matrix with the levels as discussed in Table 2 and Table 1 respectively.
Table 1: Central composite design showing 13 randomized trail runs
|
Run |
% ACN |
Flow rate |
Rt Tamsulosin |
|
1 |
25 |
1 |
6.065 |
|
2 |
54 |
1 |
2.995 |
|
3 |
40 |
1 |
3.26 |
|
4 |
40 |
1 |
3.243 |
|
5 |
30 |
0.8 |
4.823 |
|
6 |
50 |
1.2 |
2.565 |
|
7 |
50 |
0.8 |
3.34 |
|
8 |
40 |
0.7 |
3.953 |
|
9 |
40 |
1 |
3.215 |
|
10 |
40 |
1 |
3.235 |
|
11 |
40 |
1.2 |
3.065 |
|
12 |
30 |
1.2 |
4.676 |
|
13 |
40 |
1 |
3.283 |
Table 2 Experimental factors and levels in central composite design.
|
Name |
Low (-1) |
Medium (0) |
High (+1) |
|
Independent factor |
|
|
|
|
A : Acetonitrile % |
30 |
40 |
50 |
|
C :Flow rate |
0.8 |
1 |
1.2 |
|
Dependent factor |
|
|
|
|
R1 |
Retention time of Tamsulosin |
|
|
Table 3:Results of the experiment and the conditions of the optimization.
|
Parameters |
Description |
|
Program |
Isocratic |
|
Mobile phase |
Phosphate buffer: ACN (60:40 v/v) |
|
Wavelength |
239 nm |
|
Injection volume |
20 µL |
|
Flow rate |
1 mL/min |
Method validation :
This was confirmed depending on the requirements of the International Conference on harmonization (ICH) (Q2R2) which consisted of the following system suitability, linearity, DL, QL, accuracy, and precision, and robustness. [20].
Specificity
Specificity can be described as the ability of the detection of the analyte in the presence of other components that can be expected to be detected. The precision of the analysis procedure (method) was accomplished by the comparison of HPLC peaks of the pure active ingredients with those of the samples that were prepared out of the dosage forms in the market and the blank and placebo.
Precision
Precision is a degree of Reproducibility of analytical procedure and this will include in percentages of relative standard of area and retention time of Solution that was prepared in percent. Validity of an analytical process refers to a measure of consensus (degree of scatter) of a set of measurements that are established on a series of sampling of the homogenous sample at the set up conditions.
Intermediate precision:
Precision in cases of repeatability of analysis i.e. a situation whereby the independent test results were subjected to the same method with the same test items under the same laboratory with the same operator using the same equipment after a short period of time.
Accuracy
The exactness of the method of analysis is what contributes to the fact that the test results are close to the actual value of the test when using the specific method. An identification of correctness was determined as percentage recovery and this was performed at three levels; 80 percent, 100 percent, 120 percent.
Linearity
The method has been evaluated and tested to be linear in five concentrations (within a range of 80 to 120 percent). The calculus of the areas at the peak was plotted against concentrations to draw the calibration curves.
Detection limit and Quantitation limit
DL is least concentration that cannot be determined not quantified other hand QL is least concentration that cannot be determined.
Solution Stability:
Tamsulosin stability at room temperature was determined using the assay procedure by placing the working standard in severely capped volumetric flasks 24 hrs at room temperature. The assay sample is also prepared and stored in a manner that will stabilize the sample of a maximum of 24 hours.
RESULTS AND DISCUSSION:
Lastly the 2 factor chosen percent acetonitrile flow rate which could be a clear factor affecting the chosen responses was chosen. The spectral analysis of drug at 200 400 nm indicated that tamsulosin possess 239 nm λmax. In this way, the chromatographic detection was fixed at 239 nm. This procedure was performed on a column of Agilent Zorbax C18 (250mm x 4.6mm; 5m) at the rate of 1.0 mL/min. Phosphate buffer: Acetonitrile (60: 40 v/v) was identified to be the best mobile phase. Each two variables obtained the sweet spot (also known as the bright yellow area) and the rest of the factors remained at a particular fixed value. CCD chose two variables (Concentration of acetonitrile, flow rate) at 5 level with 13 experiments. The equation of quadratic regression model which was created due to interaction of the factor and responses designed by the software of Expert in Analyzing variances is presented in Table 3.The analysis of variance ( ANOVA ) confirmed the P- value and F-value in Table 4. Probability (p < 0.0001) indicates that the response is not independent of the independent factors (p under 0.05 is required to make the model significant).
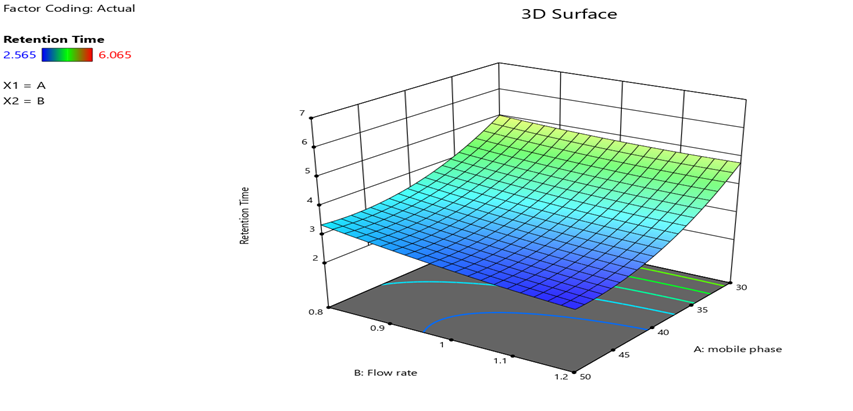
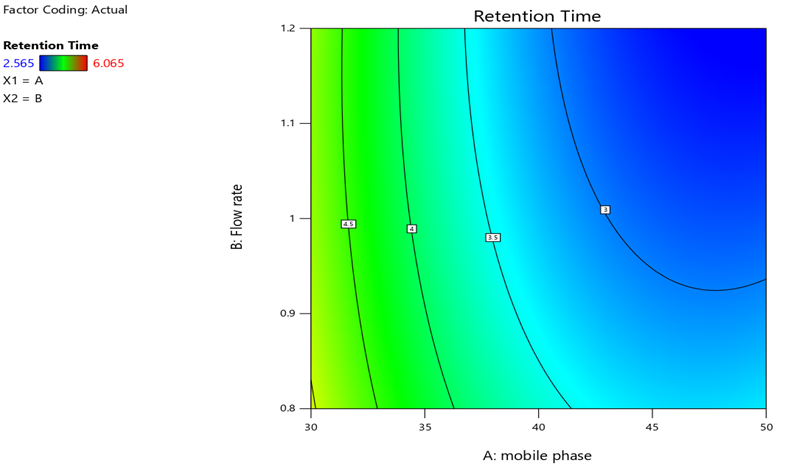
Fig 2 : 2D and 3D plot of the interaction effect of critical factors on the retention time of Tamsulosin.
Figure 2 shows both 2D and 3D plots with the relationship between each of the dependent variable with all the two independent variables. There were clear indications in its plots that the retention time decreased with an increase in the flow rate and mobile phase acetonitrile concentration.
trile concentration.
Table 4 : Statistical parameter obtained from ANOVA
|
Source |
Sum of Squares |
df |
Mean Square |
F-value |
p-value |
|
|
Model |
11.06 |
5 |
2.21 |
108.13 |
< 0.0001 |
significant |
|
A-mobile phase |
7.87 |
1 |
7.87 |
384.71 |
< 0.0001 |
|
|
B-Flow rate |
0.5929 |
1 |
0.5929 |
28.97 |
0.0010 |
|
|
AB |
0.0986 |
1 |
0.0986 |
4.82 |
0.0642 |
|
|
A² |
2.50 |
1 |
2.50 |
122.10 |
< 0.0001 |
|
|
B² |
0.0548 |
1 |
0.0548 |
2.68 |
0.1457 |
|
|
Residual |
0.1432 |
7 |
0.0205 |
|||
|
Lack of Fit |
0.1406 |
3 |
0.0469 |
70.77 |
0.0006 |
significant |
|
Pure Error |
0.0026 |
4 |
0.0007 |
|||
|
Cor Total |
11.21 |
12 |
In Table No.4 The model f -value of 108.13 suggests the model is significant. Probability of occurrence of such large F-value is only 0.06% to happen by noise.P-values which are less than 0.0500 show that model terms are significant.
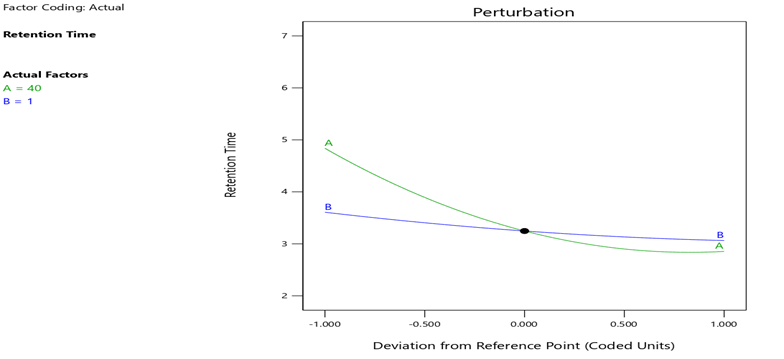
Fig 3 Perturbation plot indicate effect of factor on responses
Fig 3 show -ACN and flow rate had greatest negative influence on retention time of tamsulosin as retention time decreases with increase of flow rate and mobile phase acetonitrile concentration.
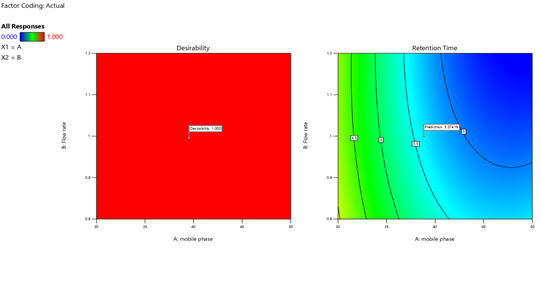
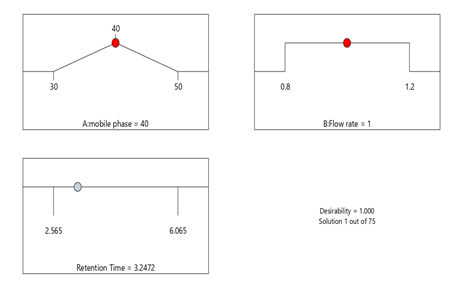
Fig 4.Graphical representation of the constraints developed to be adopted in arriving at the global desirability and the achieved optimal state.
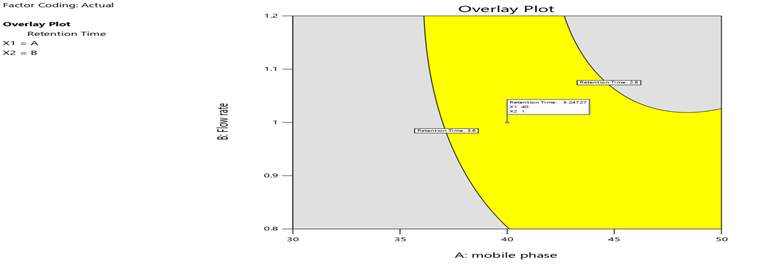
Fig 5. Overlay plot of the intersection point of the desired responses.
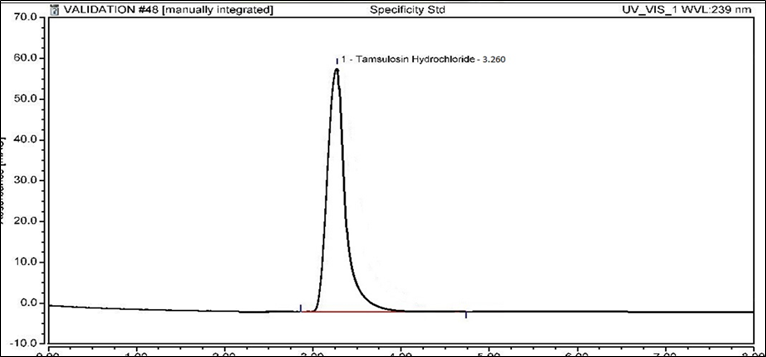
Fig 6.Optimized chromatogram of Tamsulosin.
Validation Parameter:
Specificity
No additional or co-eluting peaks were observed in the chromatograms at the retention time at which the analytes were observed. Thereby, the mountains were viewed as pure, and this fact confirms the uniqueness of the approach. Interference Standard/Sample There was no interference in Standard/Sample by Blank.
Table 5 Specificity outcome of Tamsulosin.
|
Sr.No. |
Area |
|
|
1 |
Blank |
0.000 |
|
2 |
Standard Solution |
40.796 |
|
3 |
Sample Solution |
40.189 |
Precision
1.System Precision: The assay values of three preparation of 24 mg of tamsulosin is having of percent assay is 99.92 which is NLT 90.0% and NMT 110.0% and hence the methodology of assay of 24 mg of tamsulosin tablet is precise.
2.Intermediate Precision The values of the assay of three preparation of 24 mg of tamsulosin are having 99.75% Assay is NLT 90.0% and NMT 110.0% So the procedure in terms of assay of 24 mg of tamsulosin and tablet is precise.
Accuracy
The tamsulosin percent recovery of each injection of each concentration is 101.02, 100.25, 99.66 and mean recovery is 99.98, which falls within the acceptable limits of the acceptance criteria, therefore, the method used in the determination of tamsulosin percent assay is valid.
Linearity
The 5 injections were used to determine the calibration curves which were observed to be linear within the ranges of 80 to 120%. The results obtained fall within the range, and coefficient of correlation with the standard curve is 1.000 therefore the approach is linear in given range.
Table 6 : Accuracy result for tamsulosin
|
Sr.No. |
Level |
mg of drug spiked |
Area |
mg of drug Recovered |
% Recovery
|
|
1 |
80% |
0.019200 |
19.628 |
0.019204 |
100.02 |
|
2 |
100% |
0.024000 |
24.591 |
0.024059 |
100.25 |
|
3 |
120% |
0.028800 |
29.336 |
0.028702 |
99.66 |
|
Average |
|
|
|
|
99.98 |
|
Std.dev |
|
|
|
|
0.30 |
|
%RSD |
|
|
|
|
0.30 |
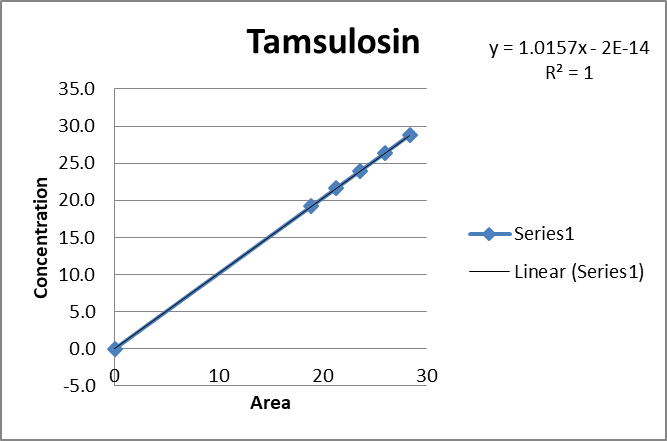
Fig 4 : Calibration curve for tamsulosin
Table 7 : Linearity result for tamsulosin
|
Sr.No. |
Concentration in ppm |
Concentration of Solution |
Diluted to |
Area |
|
1 |
19.2 |
80 |
50 |
18.902 |
|
2 |
21.6 |
90 |
50 |
21.265 |
|
3 |
24.0 |
100 |
50 |
23.628 |
|
4 |
26.4 |
110 |
50 |
25.991 |
|
5 |
28.8 |
120 |
50 |
28.354 |
Solution Stability
The RSD was measured to be below 2 thus the sample solutions of Tamsulosin 50 mg are stable at room temperature up to 4 hours.
Table 8 : Solution stability result for tamsulosin
|
Sr.No. |
Hours |
Area |
% Assay |
%Assay Difference |
|
1 |
Initial |
32.655 |
99.92 |
----- |
|
2 |
8 Hour |
32.541 |
99.65 |
0.27 |
|
3 |
24 Hour |
32.397 |
99.43 |
0.49 |
Table 9: Validation results of tamsulosin
|
Parameters |
Tamsulosin |
|
Specificity |
No interference in Standard and Sample was seen as a result of Blank. |
|
Linearity |
|
|
Range ( µg/mL) |
80-120 % |
|
Y-Intercept |
0.000 |
|
Slope |
1.0157 |
|
Correlation coefficient |
1.0000 |
|
Accuracy |
|
|
% recovery |
99.98 |
|
Precision |
|
|
System Precision |
RSD - 0.69 % |
|
Method Precision |
% Assay – 99.92 |
|
Intermediate precision |
% Assay – 99.75 |
|
Stability of solution |
RSD < 2% |
CONCLUSION :
A successful and solid procedure of RP-HPLC was established to identify tamsulosin using QbD strategy. This has been performed through the multivariate regression analysis, which has been effective in investigating the key effects of two variables on tamsulosin retention time. The chromatographic conditions were streamlined in CCD by experimenting the interaction and quadratic of significance of the most important factors of the responses that were chosen. The validation was done according to ICH Q2R2 guideline. The process is easy, solid, and exact and can be used easily to the tamsulosin during normal analysis.
Declarations:
Acknowledge: The author would acknowledge to thanks Dean and the Faculty of School of Pharmaceutical Sciences, Sandip University, Nashik to provide the facilities and support to conduct the study and Arni Analytical Laboratory, Nashik, to have availed the drug sample.
Conflict of interest: None
Funding: None
Ethics statement: None
Informed consent: None
Data availability: None
BIBLIOGRAPHY:
1. Wilde MI, McTavish D. Tamsulosin: a review of its pharmacological properties and therapeutic potential in the management of benign prostatic hyperplasia. Drugs. 1996;52:883–896.
2. Buzelin JM, Fonteyne E, Kontturi MJ, Witjes WPJ, Khan A. Comparison of tamsulosin with alfuzosin in the treatment of patients with lower urinary tract symptoms suggestive of bladder outlet obstruction (symptomatic benign prostatic hyperplasia). Br J Urol. 1997;80:597–605.
3. Lee E, Lee C. Clinical comparison of selective and non-selective α1-adrenoreceptor antagonists in benign prostatic hyperplasia: studies on tamsulosin in a fixed dose and terazosin in increasing doses. Br J Urol. 1997;80:606–611. doi:10.1046/j.1464-410x.1997.00411.x.
4. Dunn CJ, Matheson A, Faulds DM. Tamsulosin: a review of its pharmacology and therapeutic efficacy in the management of lower urinary tract symptoms. Drugs Aging. 2002;19(2):135–161.
5. Faulds D, Matheson A, Dunn C. Tamsulosin: a review of its pharmacology and therapeutic efficacy in the management of lower urinary tract symptoms. Drugs Aging. 2002;19(2):135–161.
6. Kavitha D, Sahoo SK, VR P, Nagamani M, Ch B. Development and validation of RP-HPLC method for determination of metformin and sitagliptin in bulk and pharmaceutical dosage form. Int J Pharm Sci Rev Res. 2017;5:34–39.
7. Sebaiy MM, El-Adl SM, Baraka MM, Hassan AA, El-Sayed HM. Quality by design approach for development and validation of an RP-HPLC method for simultaneous estimation of xipamide and valsartan in human plasma. BMC Chem. 2022;16:1–13.
8. Jatte KP, Masne DD, Khachane MA, Charde MS. Quality by design approach in analytical method development: a review. Int J Pharm Pharm Res. 2021;21:1–19.
9. Nadpara NP, Thumar RV, Kalola VN, Patel PB. Quality by design (QbD): a complete review. Int J Pharm Sci Rev Res. 2012;17:20–28.
10. International Conference on Harmonisation. Pharmaceutical development Q8(R2). ICH harmonised guideline. 2009. p. 1–28.
11. Qi ML, Wang P, Geng YS, Gu JL. HPLC method for the determination of tamsulosin hydrochloride in sustained-release tablets. J Beijing Inst Technol. 2003;12(2):194–197.
12. Sudha T, Dhomane D. A validated RP-HPLC method for the determination of impurities in tamsulosin hydrochloride. Int J Chem Res. 2011;2(4):29–33.
13. Kumar GS, Pavan Kumar BS. Stability-indicating RP-HPLC method for determination of tamsulosin hydrochloride in pharmaceutical dosage form. J Basic Clin Pharm. 2012;3(2):295–301.
14. Patel BN, Sharma N, Sanyal M. Development and validation of RP-HPLC method for estimation of tamsulosin hydrochloride in tablet dosage form. Asian J Pharm Clin Res. 2011;4(4):120–123
15. Singh B, Chauhan D. Development and validation of RP-HPLC method for simultaneous estimation of tamsulosin hydrochloride and dutasteride in bulk and pharmaceutical dosage forms. Int J Pharm Sci Res. 2015;6(7):2063–2072.
16. Patel NB, Patel JK. Simultaneous estimation of tamsulosin hydrochloride and finasteride in combined dosage form by RP-HPLC. Indian J Pharm Sci. 2010;72(3):371–375.
17. Rote AR, Bari PD. RP-HPLC method for simultaneous determination of tamsulosin hydrochloride and solifenacin succinate in tablet dosage form. J Chromatogr Sci. 2012;50(8):721–726.
18. Kumar A, Rao JV, Reddy SV. Development and validation of stability-indicating RP-HPLC method for simultaneous estimation of tamsulosin hydrochloride and dutasteride in capsules. J Pharm Anal. 2014;4(6):413–420.
19. Mahajan AA, Sawant SD. Simultaneous RP-HPLC estimation of tamsulosin hydrochloride and tolterodine tartrate in combined pharmaceutical dosage form. Int J Pharm Pharm Sci. 2013;5(2):375–379.
20. International Council for Harmonisation. Validation of analytical procedures Q2(R2). ICH harmonised guideline. 2022. p. 1–38.